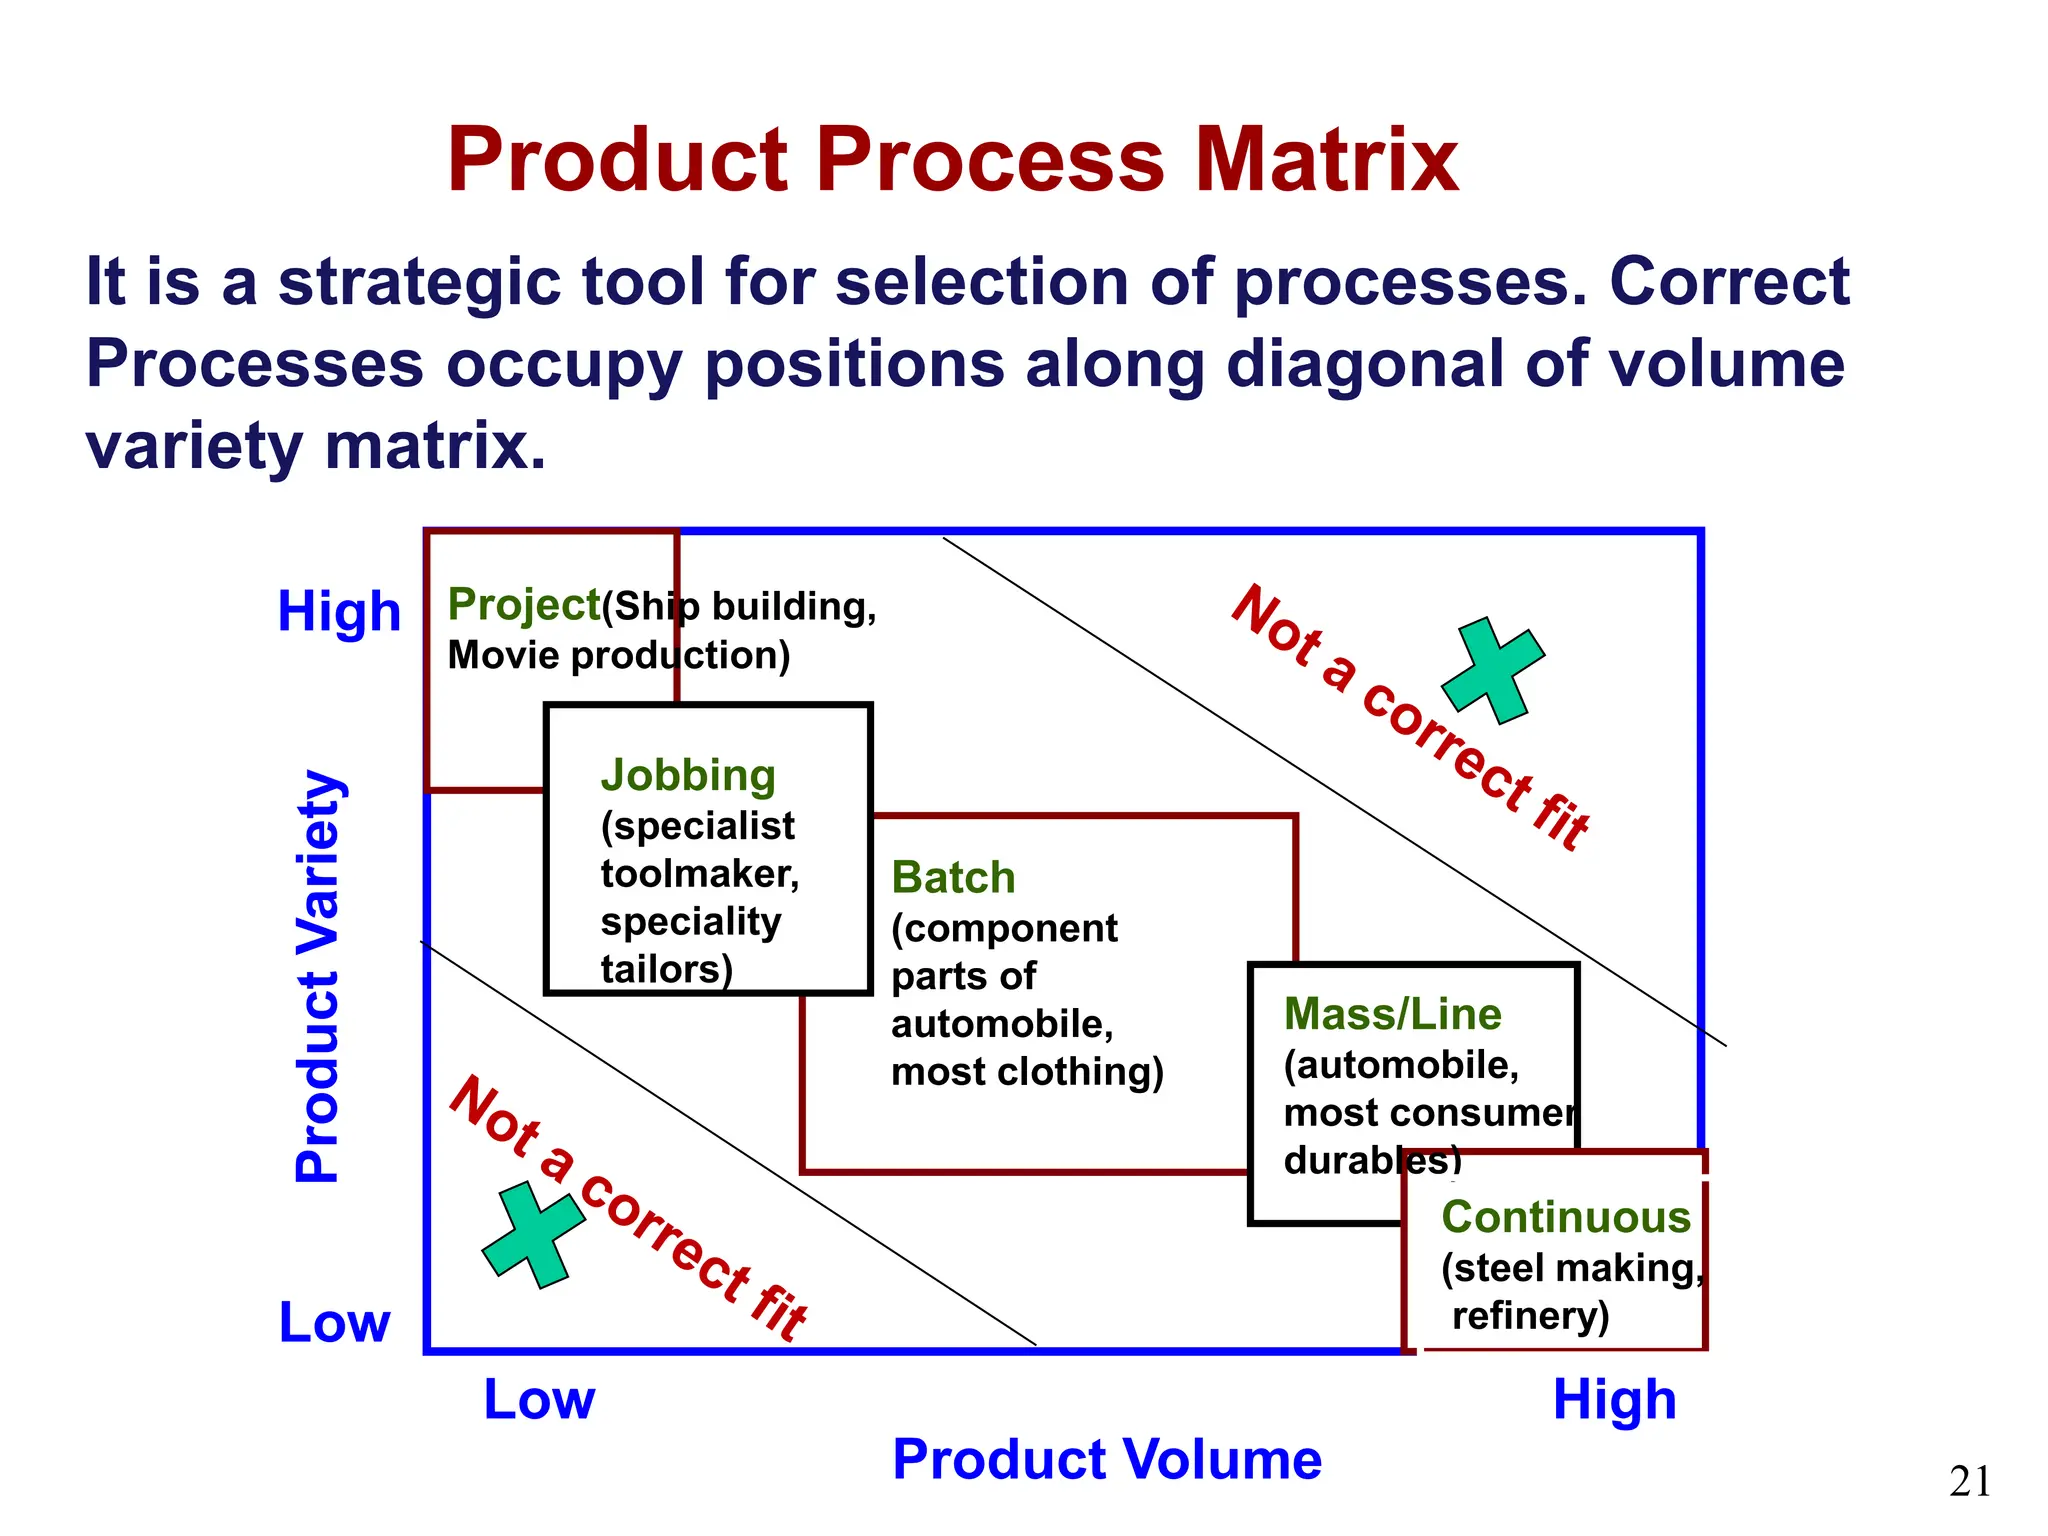
The document provides an overview of various process types in operations, including project, job shop, batch, line, and continuous processes, along with their characteristics and examples. It emphasizes the importance of process analysis through mapping, identifying bottlenecks, and measuring performance metrics such as capacity, cycle time, and throughput. Additionally, it discusses the strategic selection of process architecture based on product variety and volume.


![1.Process Capacity: The capacity is defined as the maximum output
from the process or resource (e.g., worker, machine, factory,
organization), measured in units produced per unit of time. Thus
capacity can be found by dividing total available time by the processing
time per unit.
Example of Capacity of a Single Stage Process: If a welder can do a job in 1 minute,
then his/her hourly capacity will be [1hr *60 (minutes/hr) ]/ (1 minute) = 60 units/hr
Note: Effective capacity (in long term) refers to the output that the manager is most
likely to attend in actual setting and this can be less than the maximum output rate due
to factors such as maintenance, scheduling difficulties and worker availability. To
account for this in setting long term capacity the time availability may be reduced by a
factor. For instance, welder’s weekly capacity in above example (1-8 hr shift x 5
working day) may be say 60*40*0.9 =2160 units/week (instead of 60*40=2400
units/week).
Process Performance Measures
What do we need to measure in order to understand how the
designed process will perform?
Task 1 Task 2 Task 3](https://image.slidesharecdn.com/3-240517112513-958cdc4c/75/3-Process-AnalysisNew-diagram-a-1-pptx-31-2048.jpg)


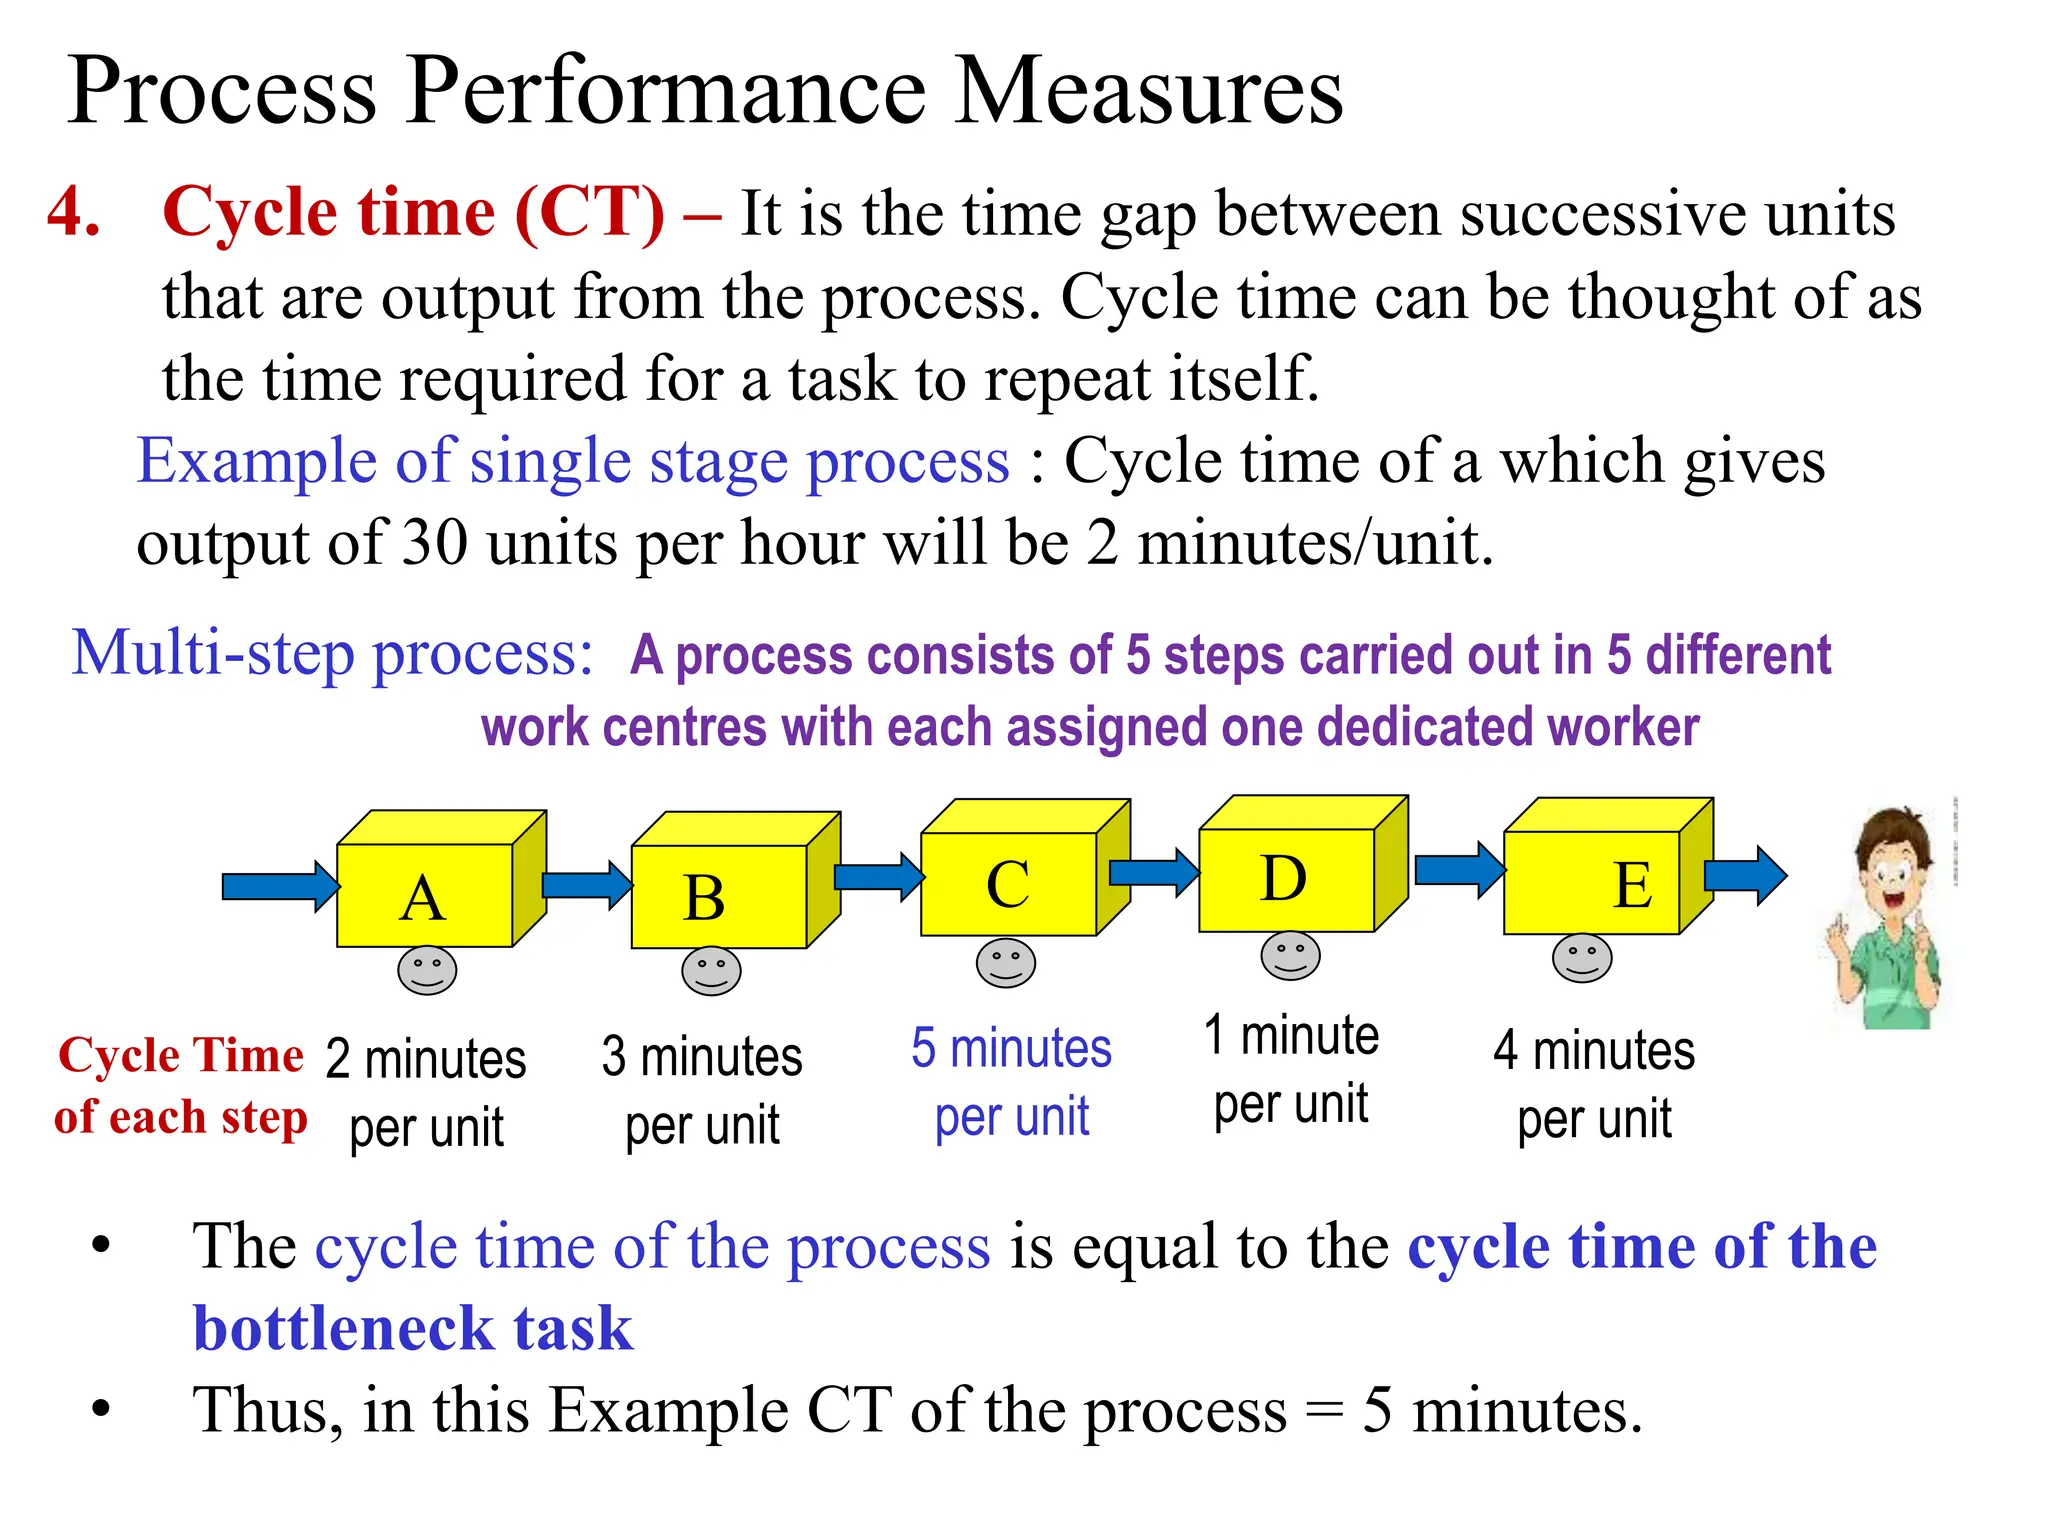
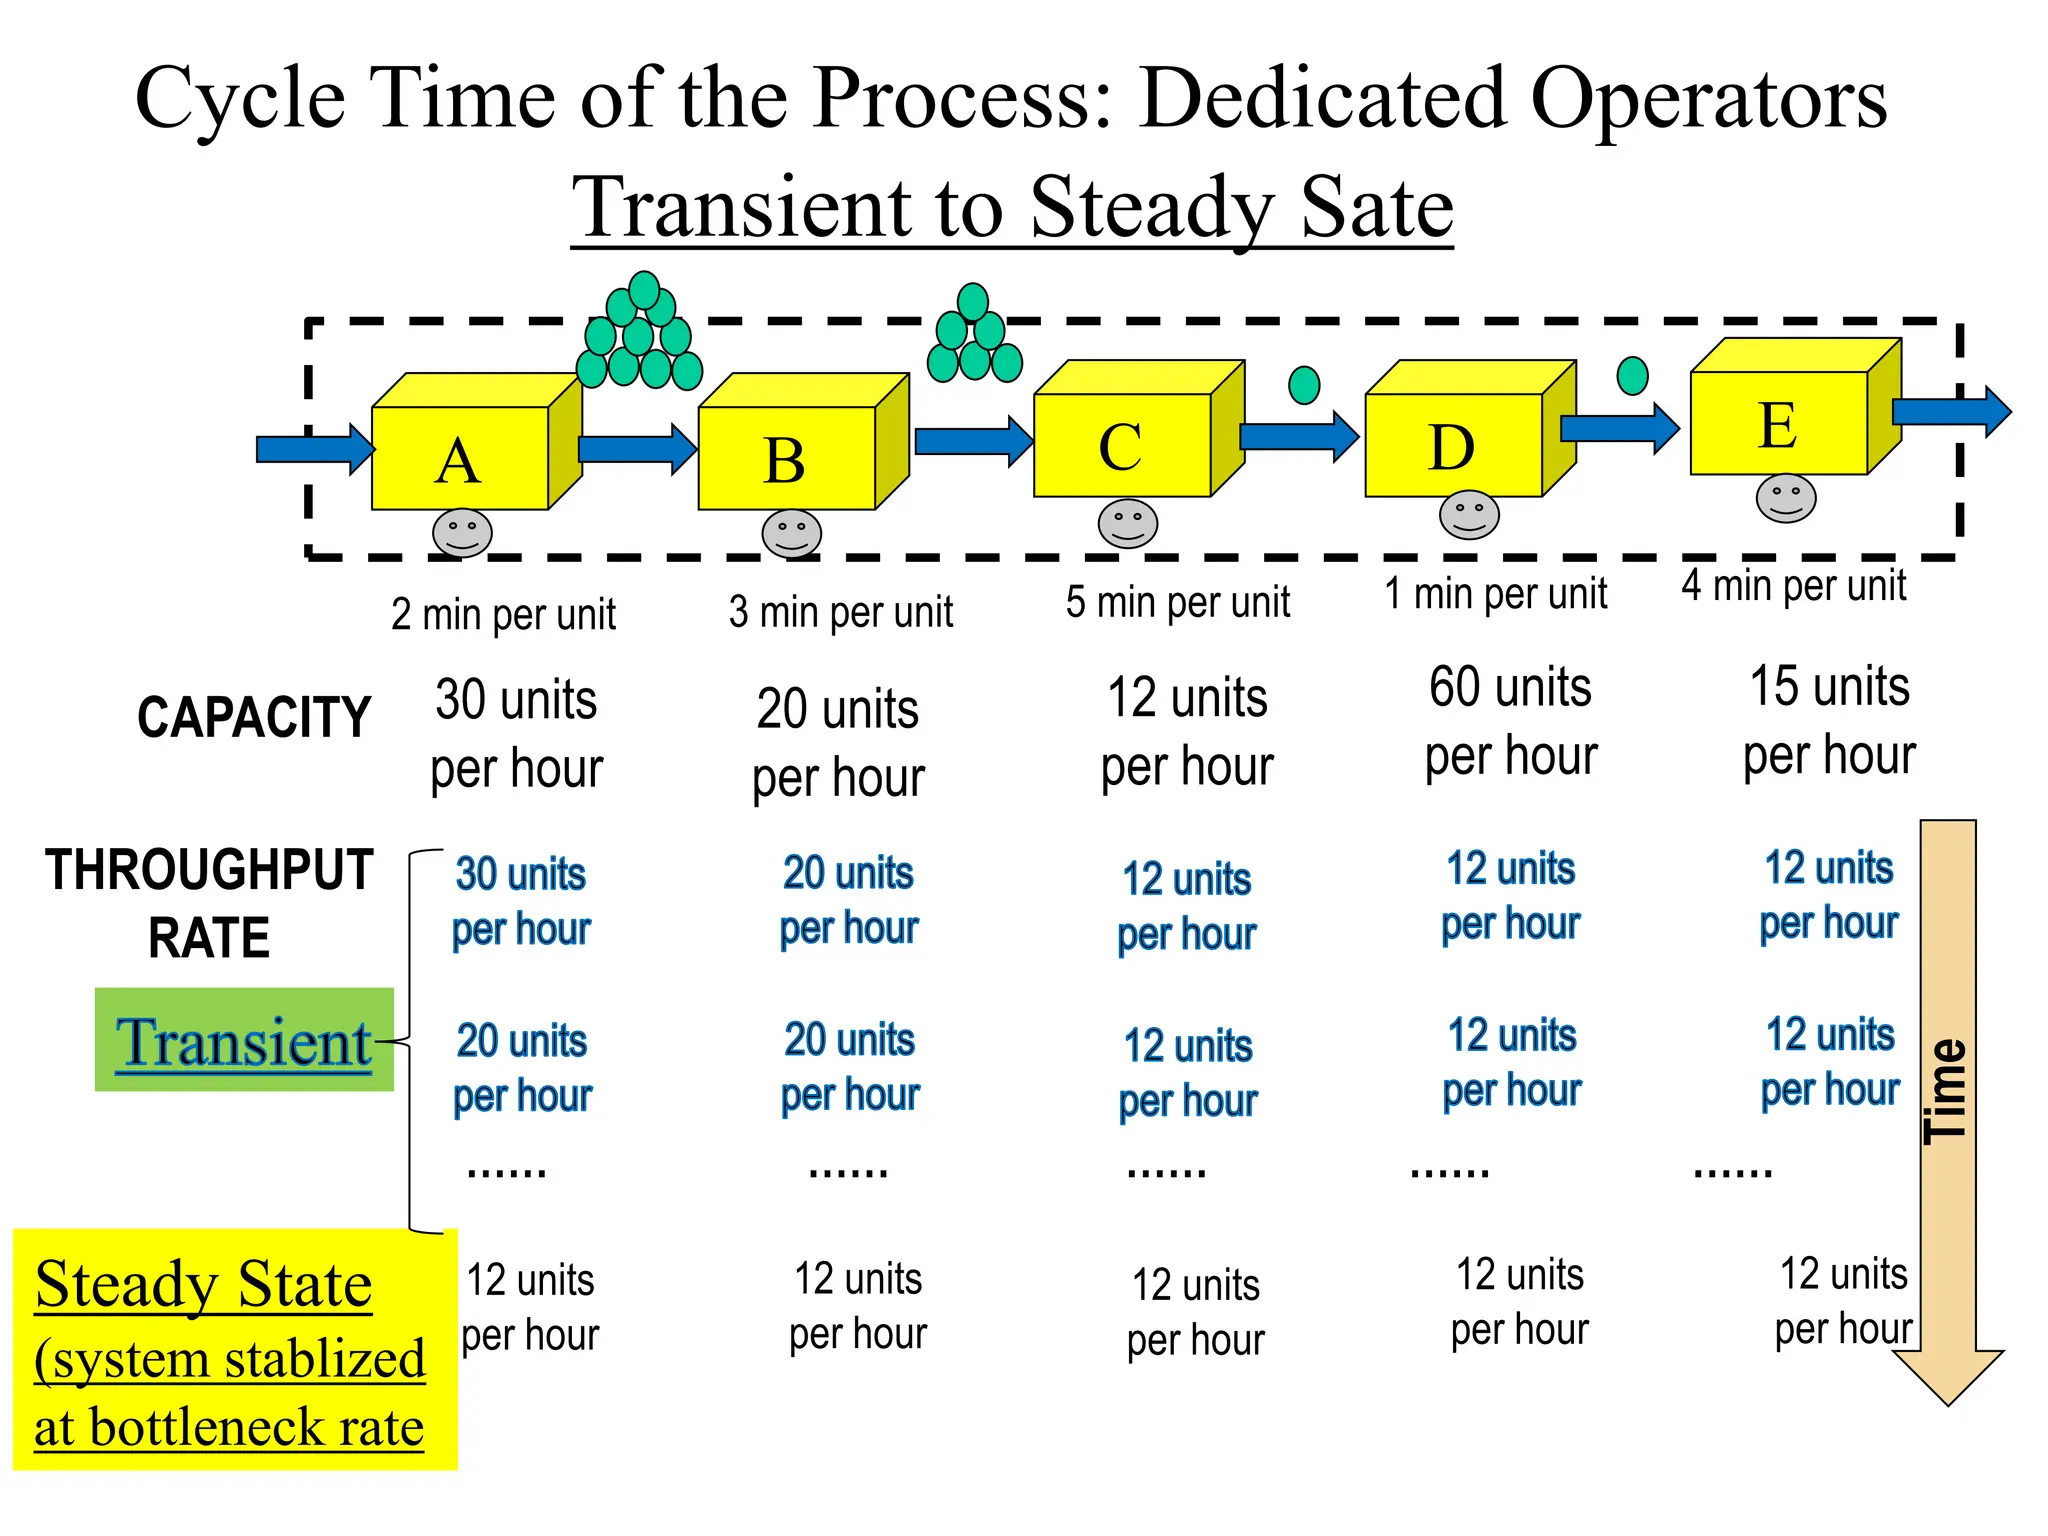
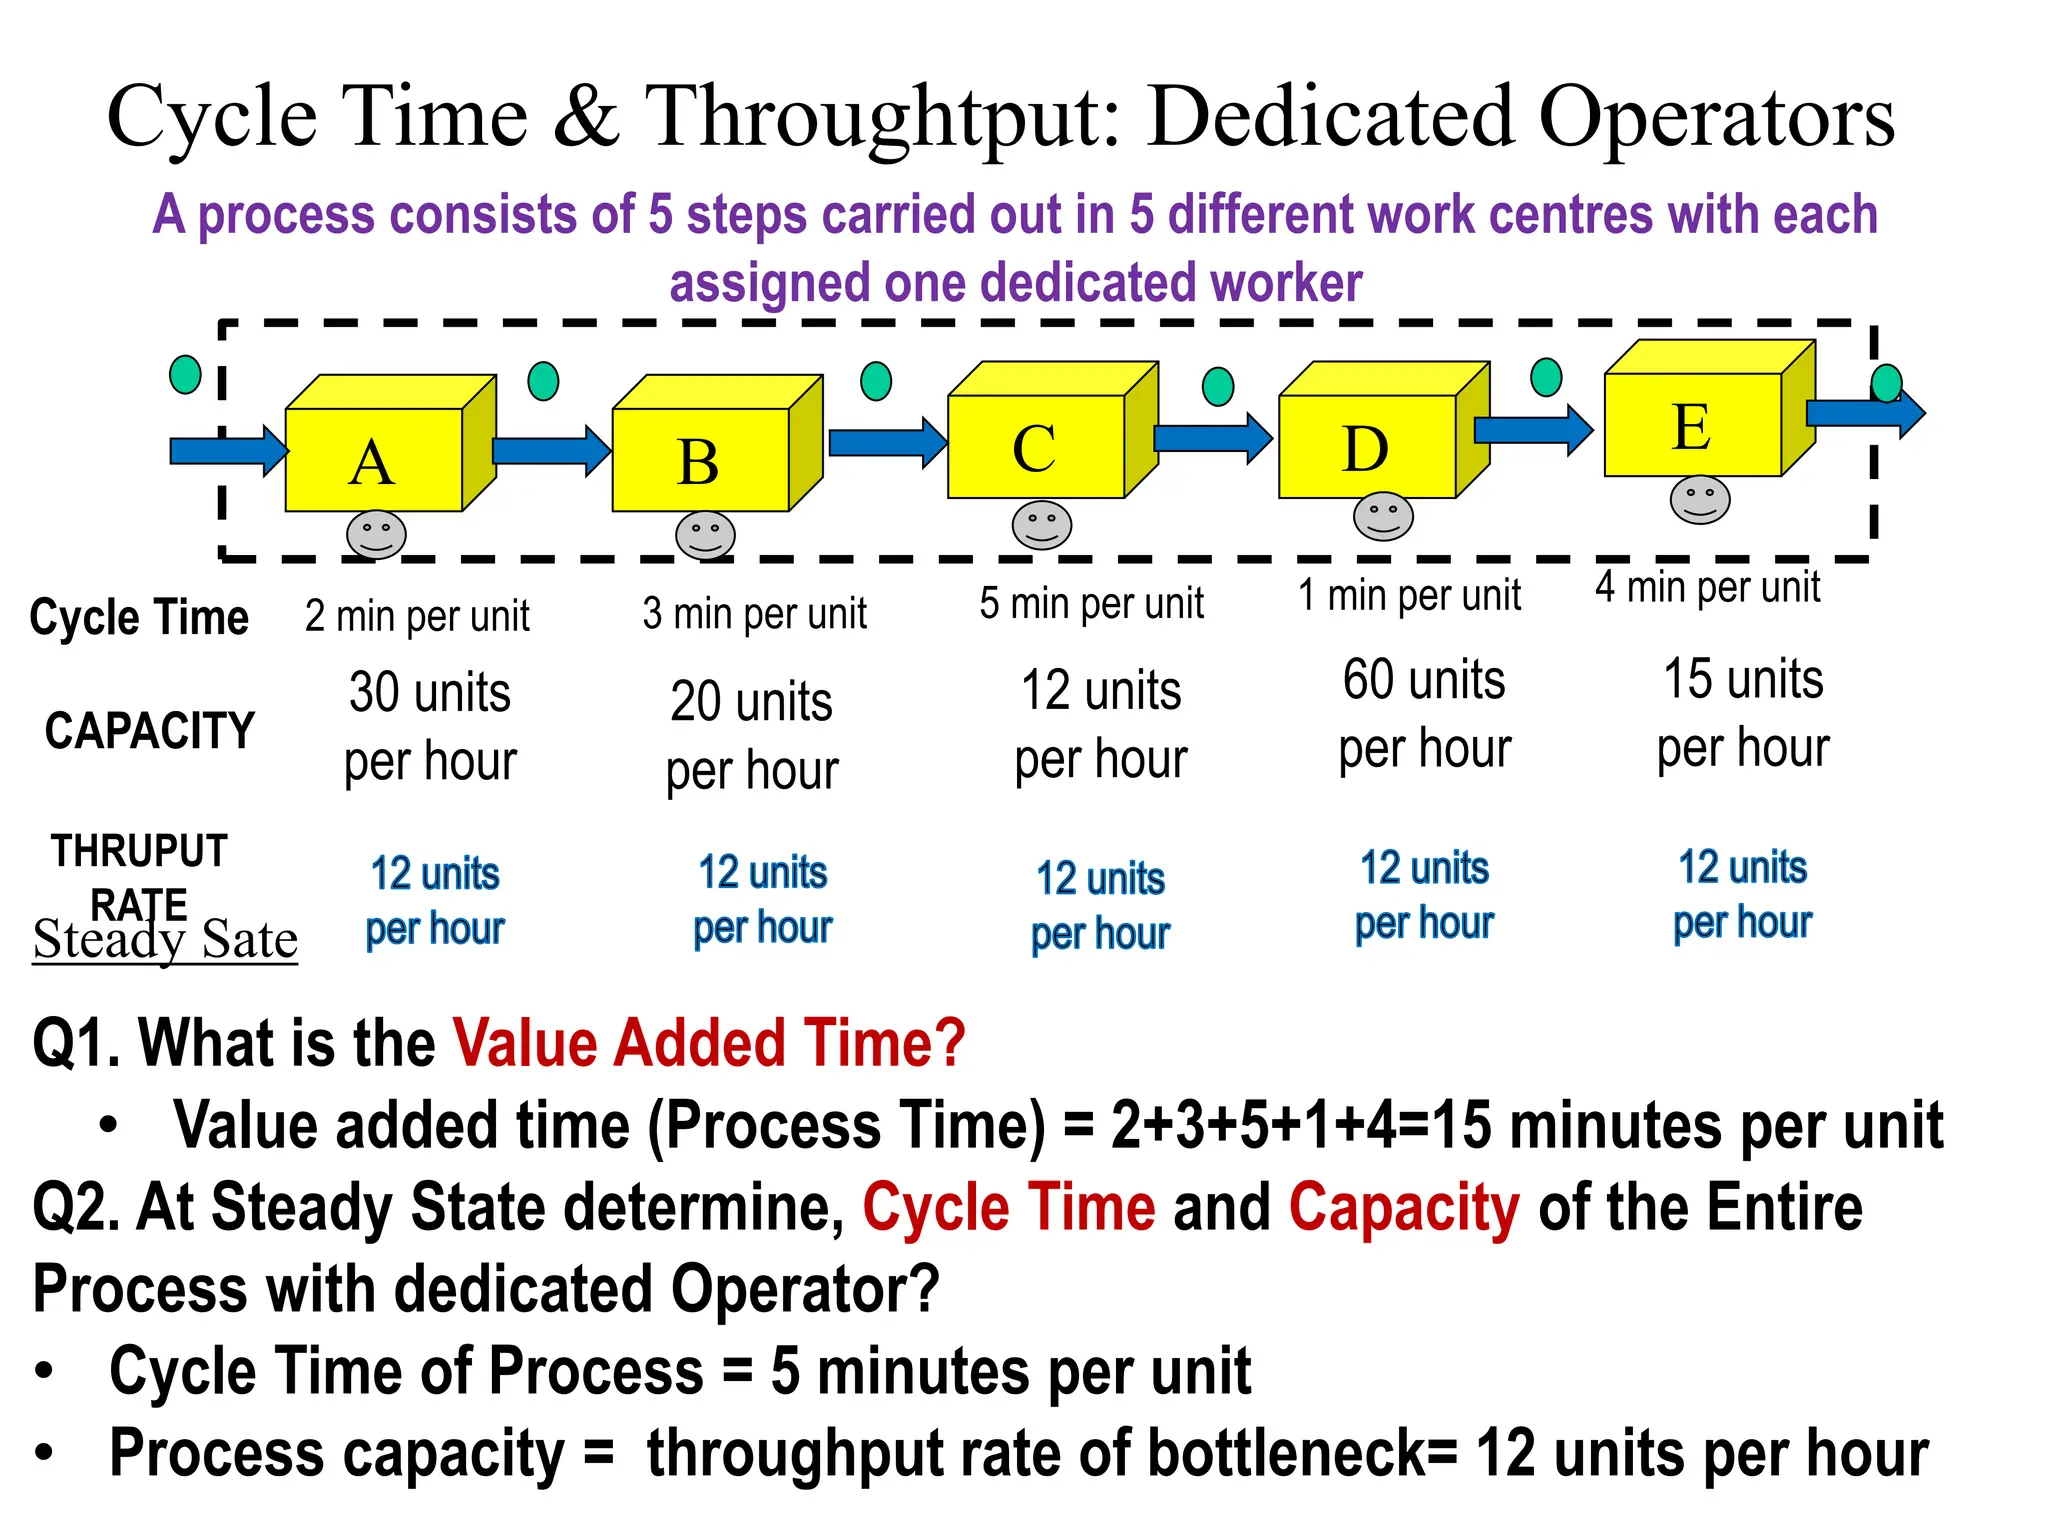
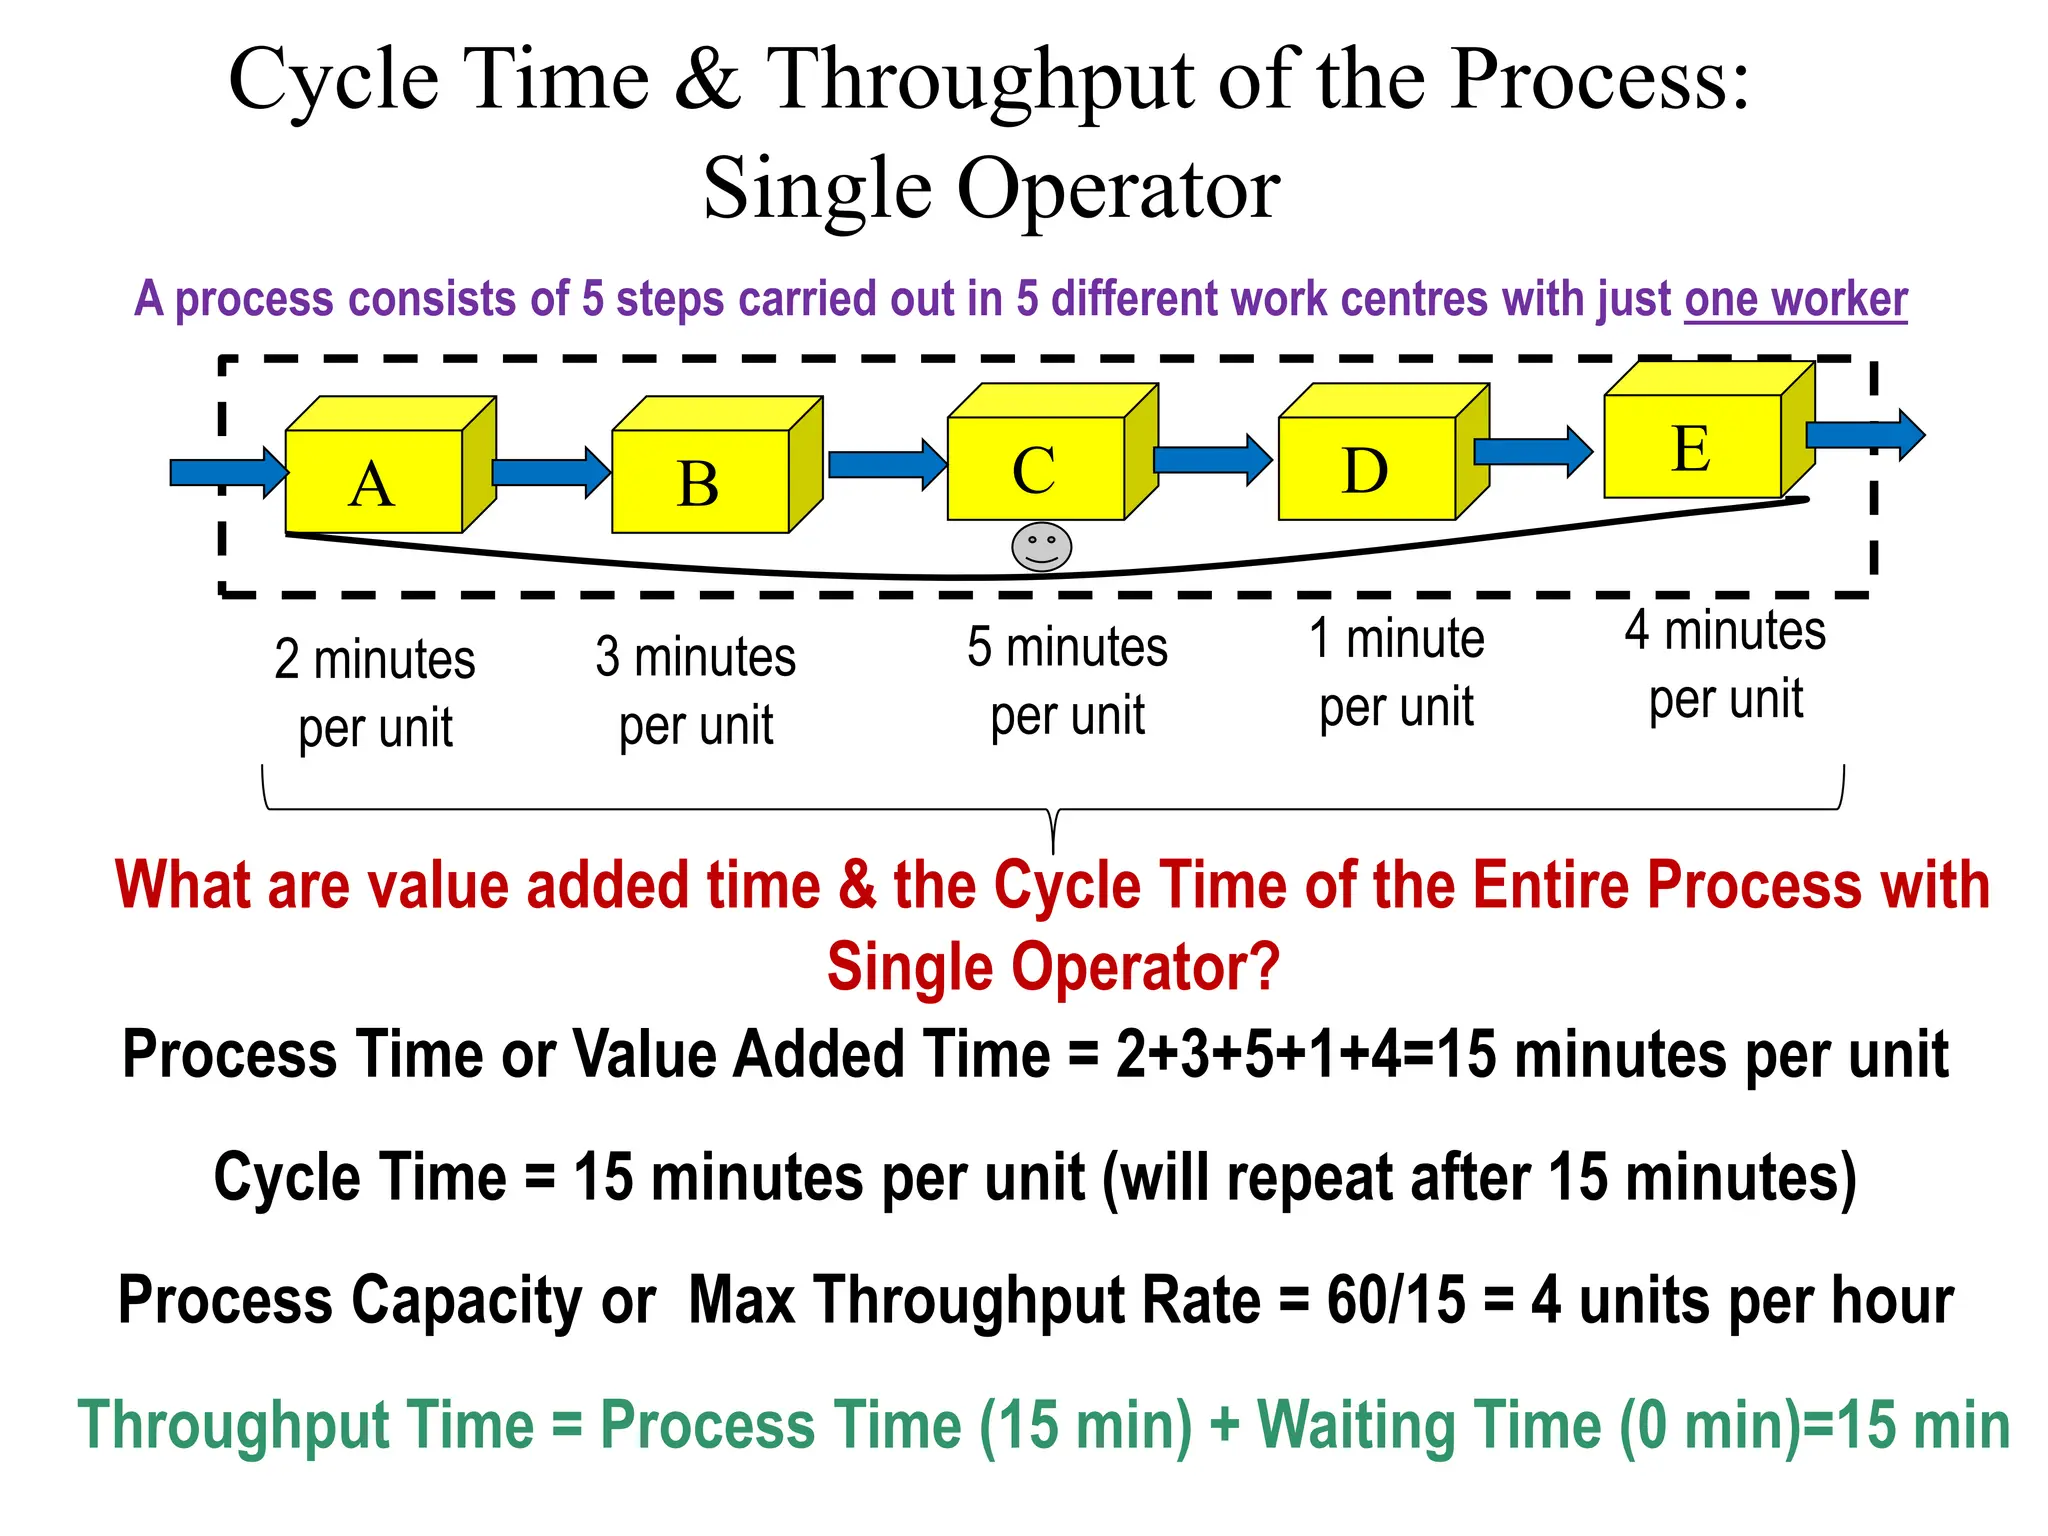
![Cycle Time & Throughput Relation
Cycle Time: Average time for completion of a unit at a production
step or process. Measured as time/unit. [Note: different kinds
of products require different processing, hence averaging]
Throughput Rate: Average number of units processed over a unit
time interval. Measured as units/time
1
Cycle Time
Throughput rate =
Key
relationship Capacity = (maximum possible) throughput rate
= throughput rate at minimum possible Cycle Time)
[Note: 1) computed this way, the maximum possible throughput
rate or Minimum possible Cycle Time through a process stage
measures its capacity]
2) Takt Time = target cycle time to meet throughput demand of
usually a day (say, 480 units production demand in an 8-hr shift
will give a takt time = 8*60/480= 1 min)](https://image.slidesharecdn.com/3-240517112513-958cdc4c/75/3-Process-AnalysisNew-diagram-a-1-pptx-35-2048.jpg)