Download as PDF, PPTX
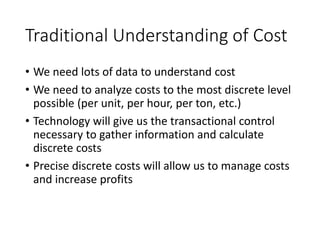
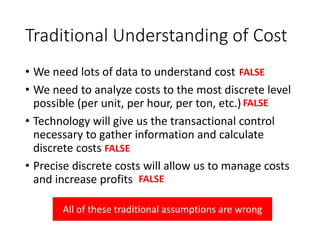
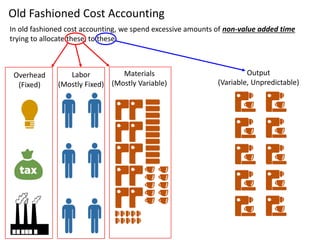
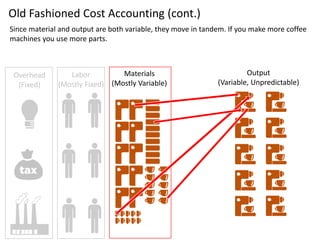
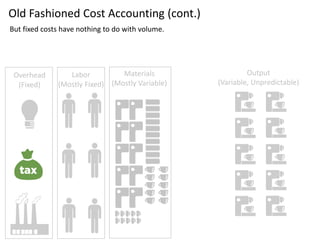
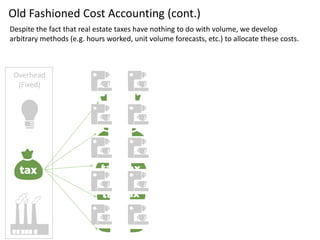
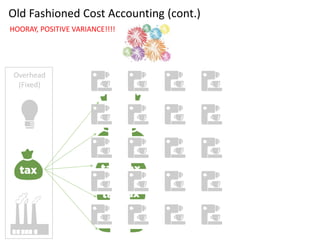
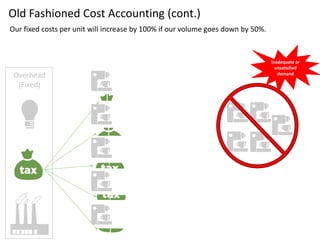
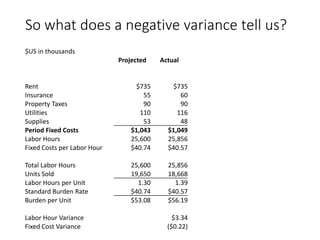

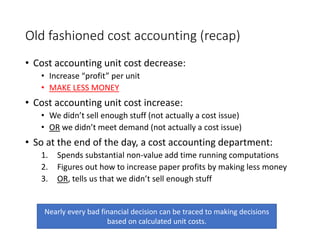
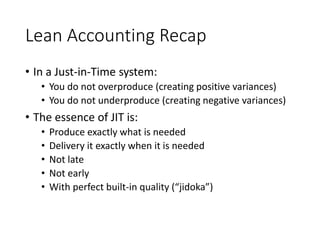
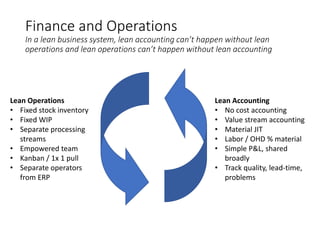
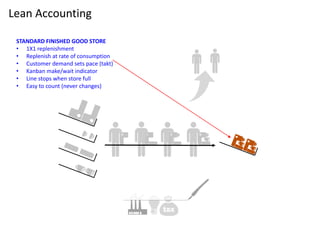
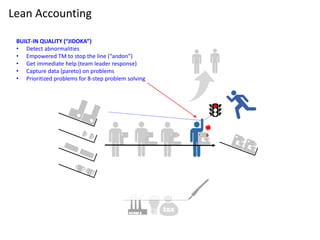
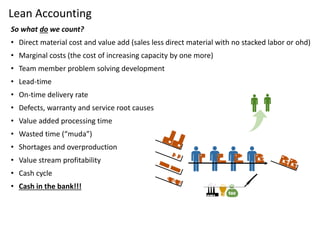
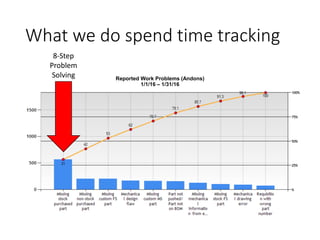
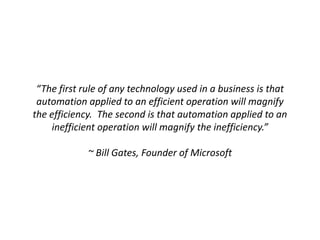
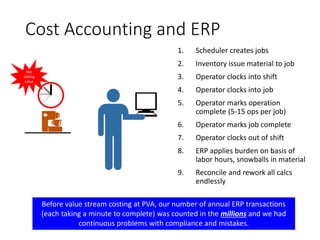
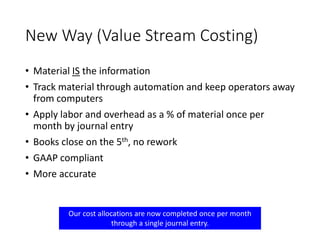
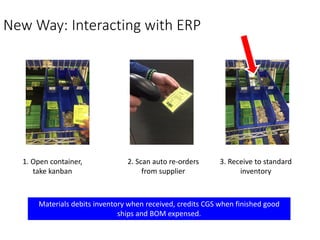
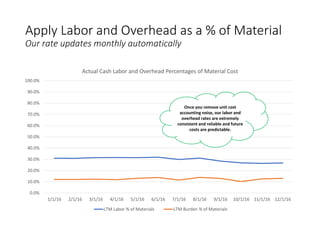
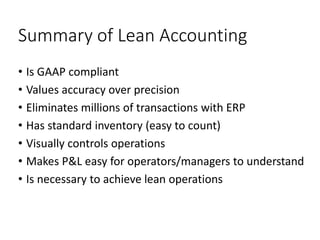
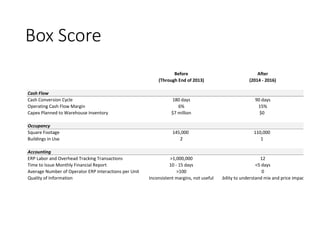


The document criticizes traditional cost accounting approaches and advocates for lean accounting. Some key points: - Traditional cost accounting focuses too much on gathering granular cost data and allocating overhead, which wastes time and can lead to bad decisions. - In lean systems like Toyota Production System, fixed and variable costs behave differently than assumed by traditional accounting. Lean accounting focuses on tracking different metrics. - Lean accounting aims to minimize inventory levels, track problems and quality issues instead of unit costs, and uses simple methods like calculating labor as a percentage of material costs each month. This reduces waste and provides more accurate information for decision making.


