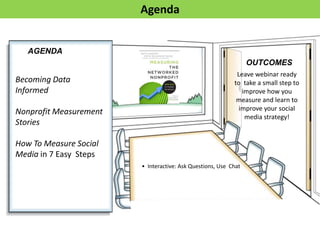
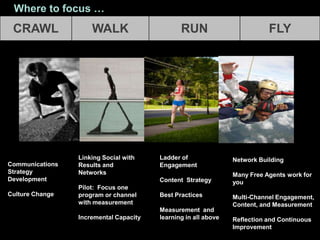
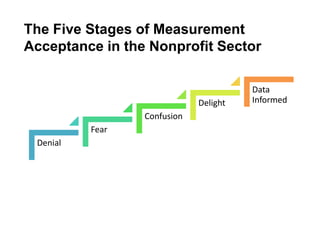
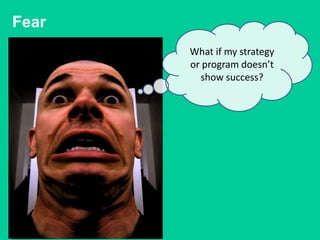
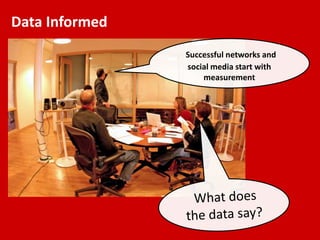
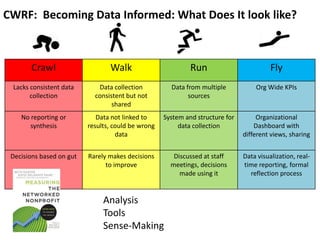
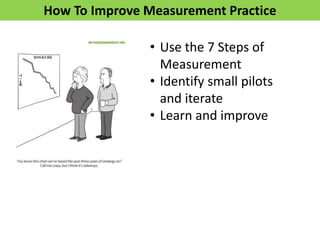
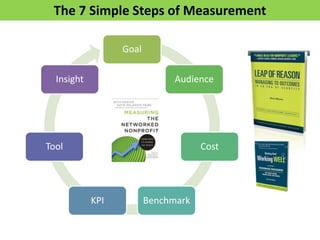
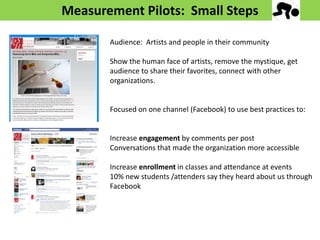
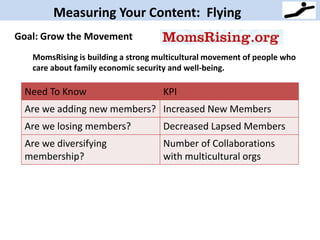
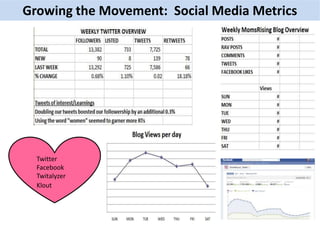
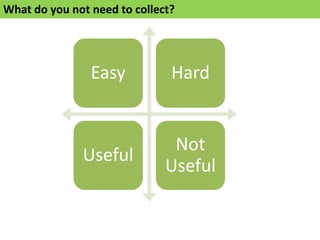
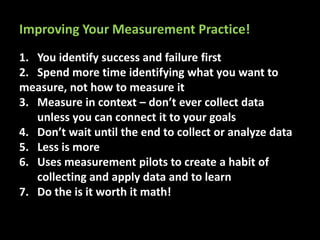
Is the time you
are spending
being networked
worth it?
Be Networked, Use Measurement,
and Make Sense of Your Data
Beth Kanter, Author, Blogger, and Master Trainer
April 21, 2013
Leadership Learning Community
Beth Kanter: Master Trainer, Blogger, Author, Speaker
Meet Keo Savon
I’m donating my author royalties to the Sharing Foundation’s Education Program
to send her to college!
AGENDA
OUTCOMES
• Interactive: Ask Questions, Use Chat
Leave webinar ready
to take a small step to
improve how you
measure and learn to
improve your social
media strategy!
Becoming Data
Informed
Nonprofit Measurement
Stories
How To Measure Social
Media in 7 Easy Steps
Agenda
Maturity of Practice Framework: Measure Progress
If you can’t fly then run, if you can’t run then walk, if
you can’t walk then crawl, but whatever you do you
have to keep moving forward.”
CRAWL WALK RUN FLY
Where to focus …
Linking Social with
Results and
Networks
Pilot: Focus one
program or channel
with measurement
Incremental Capacity
Ladder of
Engagement
Content Strategy
Best Practices
Measurement and
learning in all above
Communications
Strategy
Development
Culture Change
Network Building
Many Free Agents work for
you
Multi-Channel Engagement,
Content, and Measurement
Reflection and Continuous
Improvement
Maturity of Practice: Crawl-Walk-Run-Fly
Categories Practices Average
CULTURE Networked Mindset 2.3
Institutional Support 1.5
CAPACITY Staffing 1.8
Strategy 1.5
MEASUREMENT Analysis 1.5
Tools 2.0
Adjustment 1.8
LISTENING Brand Monitoring 1.5
Influencer Research 1.3
ENGAGEMENT Ladder of Engagement 1.5
CONTENT Integration/Optimization 1.8
NETWORK Influencer Engagement 2.0
Relationship Mapping 1.3
1 2 3 4
0.0 0.5 1.0 1.5 2.0 2.5
Arts & Cultural Alliance of
Central Florida
LA Stage Alliance
The Alliance of Resident
Theatres/New York
Austin Creative Alliance
Theatre Bay Area
C4 Atlanta
All Indicators
The Data Informed Nonprofit
Denial
Fear
Confusion
Delight
Data
Informed
The Five Stages of Measurement
Acceptance in the Nonprofit Sector
Denial
I don’t have the time
to measure.
Fear
What if my strategy
or program doesn’t
show success?
Confusion I know I should
measure our social
media and
network, but not
sure what or how?
Delight
Hey check out
these cool
charts and
graphics!
Data Informed
Successful networks and
social media start with
measurement
Crawl Walk Run Fly
Lacks consistent data
collection
Data collection
consistent but not
shared
Data from multiple
sources
Org Wide KPIs
No reporting or
synthesis
Data not linked to
results, could be wrong
data
System and structure for
data collection
Organizational
Dashboard with
different views, sharing
Decisions based on gut Rarely makes decisions
to improve
Discussed at staff
meetings, decisions
made using it
Data visualization, real-
time reporting, formal
reflection process
CWRF: Becoming Data Informed: What Does It look like?
Analysis
Tools
Sense-Making
Data-Informed Culture: It starts from the top!
Do Something.org
Tear down those silos and walls around data …
More time think about that the data, then collect it
Video
DoSomething.Org’s Fail Fest
Why did it fail?
What did we learn?
What insights can
use next time
around?
Crawl Walk Run Fly
Lacks consistent data
collection
Data collection
consistent but not
shared
Data from multiple
sources
Org Wide KPIs
No reporting or
synthesis
Data not linked to
results, could be wrong
data
System and structure for
data collection
Organizational
Dashboard with
different views, sharing
Decisions based on gut Rarely makes decisions
to improve
Discussed at staff
meetings, decisions
made using it
Data visualization, real-
time reporting, formal
reflection process
CWRF: Becoming Data Informed: What Does It look like?
Analysis
Tools
Sense-Making
How To Improve Measurement Practice
• Use the 7 Steps of
Measurement
• Identify small pilots
and iterate
• Learn and improve
Goal
Audience
Cost
BenchmarkKPI
Tool
Insight
The 7 Simple Steps of Measurement
Audience: Artists and people in their community
Show the human face of artists, remove the mystique, get
audience to share their favorites, connect with other
organizations.
Focused on one channel (Facebook) to use best practices to:
Increase engagement by comments per post
Conversations that made the organization more accessible
Increase enrollment in classes and attendance at events
10% new students /attenders say they heard about us through
Facebook
Measurement Pilots: Small Steps
Define Success, Pick The Right Data Point
Outcomes Metric
Increase donations % reduction in cost per dollar raised
Increase donor base % increase in new donors
Increase number of volunteers % increase in volunteers
Increase awareness % increase in awareness,
% increase in visibility/prominence,
Positive correlation between increase
in donors vs. visibility
Improve relationships with existing
donors/volunteers
% improvement in relationship scores,
% increase in donation from existing
donors
Improve engagement with
stakeholders
% increase in engagement (comments
on YouTube, shares on Facebook,
comments on blog, etc.
Change in behavior % decrease in bad behavior,
% increase in good behavior
Change in attitude about your
organization
% increase in trust score or
relationship score
Increase in skills and knowledge of
staff Learning
Increase in revenue per employee,
% employees understanding their
roles and organizational mission
Hooking Up Your Measurement Dashboard
Goal: Grow the Movement
MomsRising is building a strong multicultural movement of people who
care about family economic security and well-being.
Need To Know KPI
Are we adding new members? Increased New Members
Are we losing members? Decreased Lapsed Members
Are we diversifying
membership?
Number of Collaborations
with multicultural orgs
Measuring Your Content: Flying
Website Metrics
Growing the Movement: Web Site and Email Metrics
Google Analytics
& CMS Analytics
Social Media Metrics
Growing the Movement: Social Media Metrics
Twitter
Facebook
Twitalyzer
Klout
What do you not need to collect?
Easy Hard
Useful
Not
Useful
The Tools
• Sentiment
• Themes
• Messaging
Content
Analysis
• Attitudes
• Preferences
• Behavior
Survey
Research
• Reach
• Engagement
• Action
Analytics
Three Categories of Tools
http://www.bethkanter.org/datanerds-nonprofits/
The Skills
Collect Less, Think About It More
Review your Spreadsheet for 20 Minutes
Look for patterns
Data Without Insight is Trivia
Use Your Data For Decision-Making
Step 7 – Analyze Results
Joyful Funerals Metrics Mondays
Specific Time for Reflection and Improvement
Bit.ly/npfail-13ntc
Is the time you
are spending on
social media
worth it?
Be honest – Social
Media is not “free”
Be transparent
Given your
investment, are
your expected
results reasonable?
Compare alternate
ways to achieve
goals
How much did it cost?
Results Value/Cost Metric
Increase donations More efficient fund raising % reduction in cost per dollar raised
Increase donor base More revenue from a more diverse
base
% increase in new donors
Increase number of volunteers More gets done,
Less burden on existing volunteers or
staff
% increase in volunteers
Increase awareness Increase donors/volunteers
Change in behavior
% increase in awareness,
% increase in visibility/prominence,
Positive correlation between
increase in donors vs. visibility
Improve relationships with existing
donors/volunteers
Better management, more stable
finances
% improvement in relationship
scores,
% increase in donation from existing
donors
Improve engagement with
stakeholders
Better feedback and ideas for
innovation
Better understanding of attitudes
and perceptions of stakeholders
% increase in engagement
(comments on YouTube, shares on
Facebook, comments on blog, etc.
Change in behavior Achieve the mission % decrease in bad behavior,
% increase in good behavior
Change in attitude about your
organization
% likely to volunteer or donate
increases
% increase in trust score or
relationship score
Increase in skills and knowledge of
staff Learning
Improved results from intangible to
tangible
Using best practices, saving time
Increase in revenue per employee,
% employees understanding their
roles and organizational mission
Was Your Time Worth It?
Tracked Results:
Stage 1 – Integrated into staff
Stage 2 – Hired social media staff
0
20,000
40,000
60,000
80,000
100,000
120,000
140,000
160,000
180,000
0
100,000
200,000
300,000
400,000
500,000
600,000
700,000
800,000
January February March April
Uniques
Twitter Referring Traffic
Facebook Referring Traffic
1. You identify success and failure first
2. Spend more time identifying what you want to
measure, not how to measure it
3. Measure in context – don’t ever collect data
unless you can connect it to your goals
4. Don’t wait until the end to collect or analyze data
5. Less is more
6. Uses measurement pilots to create a habit of
collecting and apply data and to learn
7. Do the is it worth it math!
Improving Your Measurement Practice!
Thank you!
www.bethkanter.org
www.facebook.com/beth.kanter.blog
@kanter on Twitter
Leadership Learning Community

Leadership Learning Community

  • 1.
    Is the timeyou are spending being networked worth it? Be Networked, Use Measurement, and Make Sense of Your Data Beth Kanter, Author, Blogger, and Master Trainer April 21, 2013 Leadership Learning Community
  • 2.
    Beth Kanter: MasterTrainer, Blogger, Author, Speaker
  • 3.
    Meet Keo Savon I’mdonating my author royalties to the Sharing Foundation’s Education Program to send her to college!
  • 4.
    AGENDA OUTCOMES • Interactive: AskQuestions, Use Chat Leave webinar ready to take a small step to improve how you measure and learn to improve your social media strategy! Becoming Data Informed Nonprofit Measurement Stories How To Measure Social Media in 7 Easy Steps Agenda
  • 5.
    Maturity of PracticeFramework: Measure Progress If you can’t fly then run, if you can’t run then walk, if you can’t walk then crawl, but whatever you do you have to keep moving forward.”
  • 6.
    CRAWL WALK RUNFLY Where to focus … Linking Social with Results and Networks Pilot: Focus one program or channel with measurement Incremental Capacity Ladder of Engagement Content Strategy Best Practices Measurement and learning in all above Communications Strategy Development Culture Change Network Building Many Free Agents work for you Multi-Channel Engagement, Content, and Measurement Reflection and Continuous Improvement
  • 7.
    Maturity of Practice:Crawl-Walk-Run-Fly Categories Practices Average CULTURE Networked Mindset 2.3 Institutional Support 1.5 CAPACITY Staffing 1.8 Strategy 1.5 MEASUREMENT Analysis 1.5 Tools 2.0 Adjustment 1.8 LISTENING Brand Monitoring 1.5 Influencer Research 1.3 ENGAGEMENT Ladder of Engagement 1.5 CONTENT Integration/Optimization 1.8 NETWORK Influencer Engagement 2.0 Relationship Mapping 1.3 1 2 3 4 0.0 0.5 1.0 1.5 2.0 2.5 Arts & Cultural Alliance of Central Florida LA Stage Alliance The Alliance of Resident Theatres/New York Austin Creative Alliance Theatre Bay Area C4 Atlanta All Indicators
  • 8.
  • 10.
    Denial Fear Confusion Delight Data Informed The Five Stagesof Measurement Acceptance in the Nonprofit Sector
  • 11.
    Denial I don’t havethe time to measure.
  • 12.
    Fear What if mystrategy or program doesn’t show success?
  • 13.
    Confusion I knowI should measure our social media and network, but not sure what or how?
  • 14.
    Delight Hey check out thesecool charts and graphics!
  • 15.
    Data Informed Successful networksand social media start with measurement
  • 16.
    Crawl Walk RunFly Lacks consistent data collection Data collection consistent but not shared Data from multiple sources Org Wide KPIs No reporting or synthesis Data not linked to results, could be wrong data System and structure for data collection Organizational Dashboard with different views, sharing Decisions based on gut Rarely makes decisions to improve Discussed at staff meetings, decisions made using it Data visualization, real- time reporting, formal reflection process CWRF: Becoming Data Informed: What Does It look like? Analysis Tools Sense-Making
  • 17.
    Data-Informed Culture: Itstarts from the top! Do Something.org
  • 19.
    Tear down thosesilos and walls around data …
  • 20.
    More time thinkabout that the data, then collect it
  • 22.
  • 24.
    DoSomething.Org’s Fail Fest Whydid it fail? What did we learn? What insights can use next time around?
  • 25.
    Crawl Walk RunFly Lacks consistent data collection Data collection consistent but not shared Data from multiple sources Org Wide KPIs No reporting or synthesis Data not linked to results, could be wrong data System and structure for data collection Organizational Dashboard with different views, sharing Decisions based on gut Rarely makes decisions to improve Discussed at staff meetings, decisions made using it Data visualization, real- time reporting, formal reflection process CWRF: Becoming Data Informed: What Does It look like? Analysis Tools Sense-Making
  • 26.
    How To ImproveMeasurement Practice • Use the 7 Steps of Measurement • Identify small pilots and iterate • Learn and improve
  • 27.
  • 28.
    Audience: Artists andpeople in their community Show the human face of artists, remove the mystique, get audience to share their favorites, connect with other organizations. Focused on one channel (Facebook) to use best practices to: Increase engagement by comments per post Conversations that made the organization more accessible Increase enrollment in classes and attendance at events 10% new students /attenders say they heard about us through Facebook Measurement Pilots: Small Steps
  • 29.
    Define Success, PickThe Right Data Point
  • 30.
    Outcomes Metric Increase donations% reduction in cost per dollar raised Increase donor base % increase in new donors Increase number of volunteers % increase in volunteers Increase awareness % increase in awareness, % increase in visibility/prominence, Positive correlation between increase in donors vs. visibility Improve relationships with existing donors/volunteers % improvement in relationship scores, % increase in donation from existing donors Improve engagement with stakeholders % increase in engagement (comments on YouTube, shares on Facebook, comments on blog, etc. Change in behavior % decrease in bad behavior, % increase in good behavior Change in attitude about your organization % increase in trust score or relationship score Increase in skills and knowledge of staff Learning Increase in revenue per employee, % employees understanding their roles and organizational mission
  • 31.
    Hooking Up YourMeasurement Dashboard
  • 32.
    Goal: Grow theMovement MomsRising is building a strong multicultural movement of people who care about family economic security and well-being. Need To Know KPI Are we adding new members? Increased New Members Are we losing members? Decreased Lapsed Members Are we diversifying membership? Number of Collaborations with multicultural orgs Measuring Your Content: Flying
  • 33.
    Website Metrics Growing theMovement: Web Site and Email Metrics Google Analytics & CMS Analytics
  • 34.
    Social Media Metrics Growingthe Movement: Social Media Metrics Twitter Facebook Twitalyzer Klout
  • 35.
    What do younot need to collect? Easy Hard Useful Not Useful
  • 36.
  • 38.
    • Sentiment • Themes •Messaging Content Analysis • Attitudes • Preferences • Behavior Survey Research • Reach • Engagement • Action Analytics Three Categories of Tools
  • 39.
  • 40.
    Collect Less, ThinkAbout It More
  • 41.
    Review your Spreadsheetfor 20 Minutes Look for patterns
  • 42.
  • 43.
    Use Your DataFor Decision-Making
  • 44.
    Step 7 –Analyze Results Joyful Funerals Metrics Mondays Specific Time for Reflection and Improvement
  • 45.
  • 47.
    Is the timeyou are spending on social media worth it?
  • 48.
    Be honest –Social Media is not “free” Be transparent Given your investment, are your expected results reasonable? Compare alternate ways to achieve goals How much did it cost?
  • 49.
    Results Value/Cost Metric Increasedonations More efficient fund raising % reduction in cost per dollar raised Increase donor base More revenue from a more diverse base % increase in new donors Increase number of volunteers More gets done, Less burden on existing volunteers or staff % increase in volunteers Increase awareness Increase donors/volunteers Change in behavior % increase in awareness, % increase in visibility/prominence, Positive correlation between increase in donors vs. visibility Improve relationships with existing donors/volunteers Better management, more stable finances % improvement in relationship scores, % increase in donation from existing donors Improve engagement with stakeholders Better feedback and ideas for innovation Better understanding of attitudes and perceptions of stakeholders % increase in engagement (comments on YouTube, shares on Facebook, comments on blog, etc. Change in behavior Achieve the mission % decrease in bad behavior, % increase in good behavior Change in attitude about your organization % likely to volunteer or donate increases % increase in trust score or relationship score Increase in skills and knowledge of staff Learning Improved results from intangible to tangible Using best practices, saving time Increase in revenue per employee, % employees understanding their roles and organizational mission
  • 50.
    Was Your TimeWorth It? Tracked Results: Stage 1 – Integrated into staff Stage 2 – Hired social media staff 0 20,000 40,000 60,000 80,000 100,000 120,000 140,000 160,000 180,000 0 100,000 200,000 300,000 400,000 500,000 600,000 700,000 800,000 January February March April Uniques Twitter Referring Traffic Facebook Referring Traffic
  • 51.
    1. You identifysuccess and failure first 2. Spend more time identifying what you want to measure, not how to measure it 3. Measure in context – don’t ever collect data unless you can connect it to your goals 4. Don’t wait until the end to collect or analyze data 5. Less is more 6. Uses measurement pilots to create a habit of collecting and apply data and to learn 7. Do the is it worth it math! Improving Your Measurement Practice!
  • 52.

Editor's Notes

  • #2 http://www.flickr.com/photos/kwl/4493219149/
  • #3 Worked in the nonprofit sector for over 33 years. Had a front row seat at the creation of a field – nonprofit technology – use of technology for mission-driven work. I’m a master trainer so I get to travel around the work and work with changemakers on how to use the tools for social change or mission driven work. Most recently, have designed and delivered curriculum for nonprofits to become networked nonprofit – Middle East, Africa, India, etc. There are wicked problems in the world -- I’m passionate about social change and strongly believe that two of the skills that nonprofits need to embrace to solve them. Also a share of the royalities are going
  • #4 Meet KeoSavon. It is important to me that the book has a social change mission so I am donating my royalities to send her to college in Cambodia through supporting the Sharing Foundation program for education. It will make difference in her life.She is a civil engineering major and is 2nd in her class. I met her this summer when I visited Cambodia. She lives in the orphanage that my daughter came from in Cambodia – and KeoSavon also calls me “mom.” She told me she wants to go to graduate school in the US – MIT or Stanford. I told her that I would have to sell a lot of books!
  • #7 http://www.flickr.com/photos/oreoqueen/3235090633/in/faves-cambodia4kidsorg/http://www.flickr.com/photos/jonathandesign/7031920221/in/faves-cambodia4kidsorg/http://www.flickr.com/photos/bdfbrasil/2416260064/sizes/m/in/faves-cambodia4kidsorg/http://www.flickr.com/photos/levymh/6891554365/in/faves-cambodia4kidsorg/
  • #8 The maturing of practice framework includes looking at 7 best practice areas for networked approaches and social media – and some specific indicators – and looking at what they look at the different maturity levels. If you remember the application form, it asked you questions and that’s how I came up with the scoring system. If you were “crawl” you got 1, Walk 2, Run 3, and Fly 4 – and then I average the scores for the group. I also could come up with a score for your organization overall.So, if you got a 1.5, it means that you are on your way to walking.https://docs.google.com/spreadsheet/ccc?key=0AtsV5h84LWk0dFhENWFXVzBwZ2lWOGlzazZSek5Iemc#gid=1
  • #14 http://www.flickr.com/photos/firecloak/6774418629/sizes/l/in/photostream/
  • #15 http://www.flickr.com/photos/hockeyshooter/4132732687/
  • #16 http://www.flickr.com/photos/theimagegroup/369893824/
  • #17 The “Crawl, Walk, Run, Fly” Maturity of Social Media practice framework is in Beth’s next book, Measuring the Networked Nonprofit. We used to help us design the program, determine process outcomes, and help us evaluate our progress.Explain modelPhotos: Runhttp://www.flickr.com/photos/clover_1/2647983567/Flyhttp://www.flickr.com/photos/micahtaylor/5018789937/
  • #18 There’s another important organizational skill - data-informed this describes agile, responsive, and intelligent nonprofitsthat are better able to succeed in a rapidly changing environment and can fuel networks of networks. DoSomething.org has a big hairy social change goal:  To harnesses teenage energy and unleash it on causes teens care about by launching a national campaign per week.  The call to action is always something that has a real impact and does not require money, an adult, or a car.   Their measurable goal is to get 5 million active teen members engaged in social change campaigns by 2015.    Their use of social media, mobile, and data all strategically selected and use to reach that goal.They are a networked nonprofit with a data informed culture – and it started at the top with their board and advisors ..Reid Hoffman and DjPatil – “A Data Scientist” – have advised the CEO – Nancy Lublin – not only what infrastructure is needed to collect and make sense of data, but how she as the leader can’t rely on hunches – decisions – have to be informed by data.
  • #20 http://www.flickr.com/photos/mkrigsman/3428179614/DoSomething has two data analyst positions on staff .. And they aren’t sitting in the corner playing with their spreadsheetsWhile a big part of their job is to become the stewards of the dashboard, they work with staff – so that making sense of data Is not an adhoc process, but one of continous improvement of the programs. The data analysts work collaboratively with staff to help them apply and understand their data.
  • #21 One of their organizational mantra is “Spend More Time Thinking About The Data, Less On Collecting ItPregnancy Text” Campaign featured on their quarterly dashboard.    This clever sex education campaign is an updated version of the teen pregnancy education program where young people carried eggs around and pretend they are babies.   It was a text campaign where teens opted in to receive texts on their mobile phones from the “baby.”     Once they joined (and they could share it with their friends). they received regular annoying text messages at all hours from the “baby”  that poops, cries, and needs their immediate attention.The team at DoSomething.org uses data to base the program design, key performance indicators and a hypothesis to be tested.    They looked at  survey data from the National Campaign:  nearly 9 in 10 (87%) young people surveyed also say that it would be much easier for teens to delay sexual activity and avoid teen pregnancy if they were able to have more open, honest conversations about these topics with their parents and/or friends.    So, success of this campaign would be mean that participants talk with their family or friends about the issue and delay sexual activity.The basic design had those who signed up challenge their friends to take care of a text baby either by (1) going to DoSomething website and selecting 5 friends to challenge or (2) after receiving a text from DoSomething (sent to DoSomething’s 300k mobile subscribers) would opt to challenge friends after reading a quick stat on US teen pregnancy.   Participants that accepted the challenge would then start receiving texts the following morning from the text-baby.  After completing the challenge user were prompted to send it to their own friends.DoSomething.org also followed up with 5k of the users with a text-based survey to measure impact.Once defining success and identifying the right data collect, here’s some of the insights they gleaned  according to Nancy Lublin, CEO of DoSomething and Jeffrey Bladt:SMS as a platform:  They are monitoring engagement per communication channel and it has revealed SMS to be 30xs more powerful for getting their users to take action as compared to emailChallenging 5 friends: we’ve tested various group sizes for SMS experience and have found the a group of 6 (1 alpha inviting friends) leads to the highest overall engagementResearch Based Messaging:  The general messaging for the campaign was based on survey findings that found (1) big scare tactics (e.g. getting pregnant = not going to college) we not as effective as highlighting who being a teen parent changes daily life (e.g can’t go to the movies because baby sitter cancelled); (2) a CDC report that found: “The impact of strong pregnancy prevention messages directed to teenagers has been credited with the [recent] teen birth rates decline.A/B Testing: They pre-tested different messages and frequency of sending the messages to smaller test groups of  teens to optimize the number of messages the baby would send during the day, as well as the content.   They ended up doubling the frequency and rewording several interactions as well as building in a response system (so the baby would respond if  teen texted an unsolicited response).  The insights from these tests pushed up engagement and likelihood of forwarding at the end.Impact:  They did a survey to measure this.   1 in 2 teens said that taking the Pregnancy Text made it more likely that they would talk about the issue of teen pregnancy with their family and friends.As you can see from the above insights,  DoSomething just not gather and analyze topline data:101,444 people took part in the campaign with 100,000 text-babies delivered171,000 unsolicited incoming messages, or 1 every 20 seconds for the duration of the campaign. During the initial launch period (first 2 weeks), a new text message was received every 10 seconds.For every 1 direct sign-up, DoSomething gained 2.3 additional sign-ups from forward to a friend functionality.  The viral coefficient was between 0.60 and 0.70 for the campaign.1 in 4 (24%) of teens could not finish a day with their text-baby (texted a stop word to the baby)DoSomething.org uses its data to continuously improve programs, develop content, and shape campaign strategies. So DoSomething.org wants its staff to spend more of its brainpower thinking about the data, rather than collecting it. To ensure that this happens, DoSomething.org’s Data Analyst Bob Filbin’s job is more than programming formulas in Excel spreadsheets. Says Filbin, “One of the biggest barriers in nonprofits is finding the time to collect data, the time to analyze, and the time to act on it. Unless someone is put in charge of data, and it’s a key part of their job description, accelerating along the path towards empowered data-informed culture is going to be hard, if not impossible.”
  • #23 No addhttp://www.youtube.com/watch?v=QhgsJjNVbu0http://gawker.com/5950941/kathie-lee-dropped-a-puppy-on-his-head-on-live-tv-todayhttp://www.youtube.com/watch?v=sQzo_3yIc8M
  • #24 Back in the office, the data scientists were looking at the data in real time to figure out what was driving people to their landing page and getting them to sign up.
  • #25 Fail Fest And Pink Boas: Don’t Be Afraid To FailDoSomething.org doesn’t use its data to pat itself on the back or make the staff feel good. Lublin notes that they’re not afraid of failure. They hold regular “Fail Fest” meetings, where each person on staff has to present a campaign or program failure. They share three things they learned about themselves and three things the organization learned. To remove the stigma from failure, Lublin says, “We have to wear pink boas when we present.” http://www.flickr.com/photos/ruminatrix/2734602916/in/faves-cambodia4kidsorg/
  • #26 The “Crawl, Walk, Run, Fly” Maturity of Social Media practice framework is in Beth’s next book, Measuring the Networked Nonprofit. We used to help us design the program, determine process outcomes, and help us evaluate our progress.Explain modelPhotos: Runhttp://www.flickr.com/photos/clover_1/2647983567/Flyhttp://www.flickr.com/photos/micahtaylor/5018789937/
  • #32 HubSpot Sources tool brings it all together!
  • #36 Easy to collect, difficult to actionUse
  • #39 Categorize your specific social media measurement activities and relate to your objectivesSentiment (Messaging, positioning, themes)Attitudes (perceptions, behavior change, preferences, awareness)Do (Reach, Engagement, Action, Donate, Purchase)http://www.flickr.com/photos/leeontheroad/89666692/sizes/z/in/photostream/
  • #41 They focused on developing a robust engagement and content strategy – that was integrated with other channels, all to support objectives in communications strategy and outcomes – and used measurement. They started with one channel – FB …
  • #45 http://www.flickr.com/photos/40991157@N02/3923081100/
  • #48 http://www.flickr.com/photos/kwl/4493219149/
  • #53 http://bit.ly/network-leadership