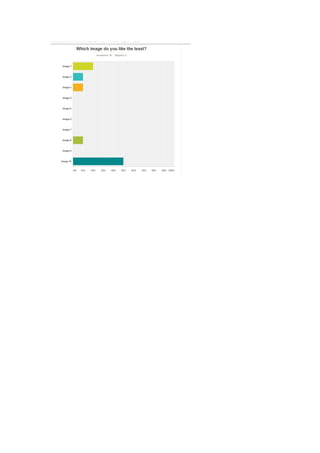
Landscape Audience Feedback
In order to determine the strengths and weaknesses of my landscape
images I gathered audience feedback through a survey consisting of
questions relating to my images, I then distributed this survey through
the social media outlet Facebook.
Do you feel these images promote Salford Quays in a positive light?
Due to the brief stating that we needed to produce landscape images
which promote Salford Quays, I felt that it was vital to ensure that the
audience felt that my final 10 images promoted Salford Quays in a
positive light. As you can see from the graph below 100% of people
who answered my survey felt that these images did in fact promote
Salford Quays in a positive light.
What do you think about the use of colours within these images?
When capturing my images I had the intentions of portraying Salford
Quays as a fast paced, vibrant place, therefore I felt the use of vibrant
colours within my images was vital, as a result I was curious as to what
the audience thought about the use of colours within the images,
therefore I provided them with the answers very good, good, could be
better and poor. As you can see from the graph below 80% of the
audience felt that the use of colours was very good and the remaining
20% felt that is was good.
What do you think about the composition of these images?
I also wanted to find out what the audience felt about the composition
of my images therefore providing them with the same answers as the
previous question. As you can see 60% of the audience answered very
good and the remaining 40% answered good.
What image do you like the best?
I then asked which image the audience liked the best, As you can see
the most popular image was image with 50% of the audience saying
that they liked this image the best. Image 5 and 6 were also popular
with both of them being chose by 20% of the audience. Image 10 was
also chose as the best image by 10% of people.
Which image do you like the least?
I then asked them to choose which image they liked the least. As you
can see from the graph below, it seems that a large portion of the
audience felt that image 10 was their least favourite image. following
this was image 1 with 20% of the audience having chosen this as the
image they like the least. Images 2, 3 and 8 were also chosen by 10% of
the audience each.
Landscape audience feedback

Landscape audience feedback

  • 1.
    Landscape Audience Feedback Inorder to determine the strengths and weaknesses of my landscape images I gathered audience feedback through a survey consisting of questions relating to my images, I then distributed this survey through the social media outlet Facebook. Do you feel these images promote Salford Quays in a positive light? Due to the brief stating that we needed to produce landscape images which promote Salford Quays, I felt that it was vital to ensure that the audience felt that my final 10 images promoted Salford Quays in a positive light. As you can see from the graph below 100% of people who answered my survey felt that these images did in fact promote Salford Quays in a positive light. What do you think about the use of colours within these images? When capturing my images I had the intentions of portraying Salford Quays as a fast paced, vibrant place, therefore I felt the use of vibrant colours within my images was vital, as a result I was curious as to what the audience thought about the use of colours within the images, therefore I provided them with the answers very good, good, could be better and poor. As you can see from the graph below 80% of the audience felt that the use of colours was very good and the remaining 20% felt that is was good.
  • 2.
    What do youthink about the composition of these images? I also wanted to find out what the audience felt about the composition of my images therefore providing them with the same answers as the previous question. As you can see 60% of the audience answered very good and the remaining 40% answered good.
  • 3.
    What image doyou like the best? I then asked which image the audience liked the best, As you can see the most popular image was image with 50% of the audience saying that they liked this image the best. Image 5 and 6 were also popular with both of them being chose by 20% of the audience. Image 10 was also chose as the best image by 10% of people. Which image do you like the least? I then asked them to choose which image they liked the least. As you can see from the graph below, it seems that a large portion of the audience felt that image 10 was their least favourite image. following this was image 1 with 20% of the audience having chosen this as the image they like the least. Images 2, 3 and 8 were also chosen by 10% of the audience each.