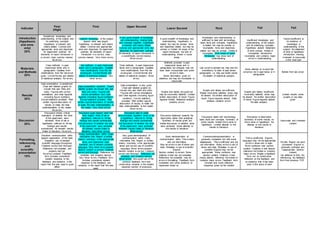
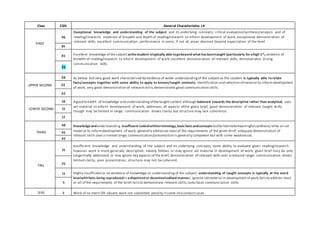
Professional and Scientific Practice 1:Labs
Department of Biosciences & Chemistry
L4 FLR Formative Assessment
Instructions:
1) Complete your name.
2) Save file as: surname_FLR_form_2019-20.docx e.g. Campbell_S_FLR _form_2019-20.docx
3) Insert your work on the final page so that the feedback forms are at the front.
4) Submit your work to Blackboard submission tool on the Blackboard site and Turnitin as a Word-
compatible file (not a pdf).
Student Name: DorobantuAdina Georgiana
Number: 30019475
Learning contract? Insert details if applicable here.
Marker:Mel Lacey
Grade: 74%
Strengths: Excellent level of detail and use of diagrams in the introduction
Methods is nice and concise, included data analysis
Excellent data analysis and written description of the results.
excellent figure legends throughout
referred to literature in the discussion
Areas to improve:
make sure introduction is complete
no need of worked examples in the methods
formating of the reference list
Student comments for feed-forward
how will you use this feedback to improve your future work?:
Indicator
First
(High)
First Upper Second
Lower Second Third Fail Fail
Introduction
(Hypothesis
and aims
only)
20%
Exceptional knowledge and
understanding of the subject and
its underlying concepts
Hypothesis is relevant and
clearly stated. Concise and
appropriate aims and objectives
for experiment outlined. All
elements of report introduced in
a correct, clear, concise manner.
No errors.
Excellent knowledge of the subject
beyond what was taught.
Hypothesis is relevant and clearly
stated. Concise and appropriate
aims and objectives for experiment
outlined. All elements of report
introduced in a correct, clear,
concise manner. Very minor errors.
A very good breadth of knowledge
and understanding relating facts
and concepts together. Hypothesis
is relevant and clearly stated.
Concise and appropriate aims and
objectives for experiment outlined.
All elements of report introduced in
a scientifically correct manner.
Minor errors.
A good breadth of knowledge and
understanding. Hypothesis is
stated, but may be unclear. Aims
and objectives stated, but may be
unclear or limited. All areas of the
report introduced, but lack of
understanding shown in some
areas.
Knowledge and understanding is
sufficient to deal with terminology,
basic facts and concepts. Hypothesis
is stated, but may be unclear or
incomplete. Aims and objectives
stated, but may be unclear, limited or
incomplete. Most areas of report
introduced, may show lack of
understanding.
Insufficient knowledge and
understanding of the subject
and its underlying concepts.
Hypothesis absent. Statement
of aims unclear, limited or
incomplete. Introduction
incomplete and contains major
errors in understanding.
Highlyinsufficient or
no evidence of
knowledge or
understanding of the
subject. No statement
of aims or hypothesis.
Introduction missing,
irrelevant or inaccurate
in the most part.
Materials
and Methods
20%
Clear methods, in past
impersonal tense and in
paragraphs. Updates from
modifications from the lab script
given. Correct format and details
of statistical analysis. No errors.
Clear methods, in past impersonal
tense and in paragraphs. Updates
from modifications from the lab
script given. Correct format and
details of statistical analysis. Very
minor errors.
Clear methods, in past impersonal
tense and in paragraphs. Updates
from modifications from the lab
script given. Correct format and
details of statistical analysis. Minor
errors.
Methods provided in past
impersonal tense and in
paragraphs but changes may not
have been incorporated and some
errors in style.
Some information given on
statistics, but may be incomplete or
inaccurate.
Lab script re-worded but may lack full
consistency to style of past tense/
paragraphs. i.e. may use bullet points.
No details of statistical analysis.
Some attempt to re-word lab
script but not in past tense or in
paragraphs.
Bullets from lab script.
Results
30%
Data presentation is exceptional.
Clear well labeled graphs (to
include title, axis titles and
units). Figures with correct
annotations and clear legends
(including figure numbers).
Correct statistics provided. Well
written logical description of
results, to make the data
understandable to the reader.
No errors.
Data presentation excellent. Clearly
labeled graphs (to include title, axis
titles and units). Figures with
correct annotations and clear
legends (including figure numbers).
Correct statistics provided. Well
written logical description of results,
to make the data understandable to
the reader. Very minor errors.
Data presentation is very good.
Clear well labeled graphs (to
include title, axis titles and units).
Figures with correct annotations
and clear legends (including figure
numbers). Correct statistics
provided. Well written logical
description of results, to make the
data understandable to the reader.
Minor errors.
Graphs and tables are good but
may be incorrectly labelled. Limited
written description of result. Figure
legends limited. Statistical analysis
contains errors.
Graphs and tables are sufficient.
Maybe incorrectly labelled, some may
be absent. No written description of
result. Figure legends absent. Data
analysis contains errors
Graphs and tables insufficient.
Incorrectly labelled, some may
be absent. No written description
of result. Figure legends absent.
No data analysis.
Limited results, some
graphs or raw data
given.
Discussion
20%
Discussion shows critical
evaluation of whether the aims
of the experiment were
achieved. Aims of lab or
hypothesis referred to. All key
findings and results
summarised. All relevant results
linked to literature. No errors.
Discussion goes beyond what has
been taught. Aims of lab or
hypothesis referred to. All key
findings and results summarised.
Full discussion of whether the aims
of the experiment were achieved.
All relevant results linked to
literature. Very minor errors.
Discussion able to relate
facts/concepts together. Aims of lab
or hypothesis referred to. All key
findings and results summarised.
Full discussion of whether the aims
of the experiment were achieved.
Relevant results linked to literature.
Minor errors.
Discussion balanced towards the
descriptive rather than analytical.
Summary of results given but
limited discussion of whether aims
were achieved. Some attempt to
link results to literature.
Discussion deals with terminology,
basic facts and concepts. Summary of
some results, limited link to aims or
hypothesis. Limited attempt to link
results to literature.
Discussion is descriptive.
Summary of some results, no
link to aims or hypothesis. No
attempt to link results to
literature.
Inaccurate and irrelevant
content
Formatting,
referencing
and
scientific
presentation
10%
Excellent communication skills
beyond expectation of the level.
Exception use of relevant
scientific language throughout.
Citations correct and thorough.
Reference list complete, and
properly laid out.
No errors present. Feedback
form includes considered
student response to the
feedback and evidence in the
report that this was used to good
effect
Strong communication skills. Clear,
informative title. Report is written
clearly, concisely, in the appropriate
tense and impersonal style.
Excellent use of relevant scientific
language. Very minor error present.
Section content is correct. Citations
correct and thorough. Reference list
complete, and properly laid out.
Very minor errors. Feedback form
includes considered student
response to the feedback and
evidence in the report that this was
used.
Very good demonstration of
communication skills. Clear,
informative title. Report is, written
clearly, concisely, in the appropriate
tense and correct use of scientific
language. Minor errors present.
Section content is correct. Citations
correct and thorough. Reference list
complete, and properly laid out.
Minor errors. Very good use of the
previous feedback form and
constructive remarks in the student
response section of previously
Good demonstration of
communication skills. Title is basic
and not informative.
May be errors in use of tense and
style. Mistakes in use of scientific
English.
Section content is correct. Some
citations in text but not complete.
Reference list complete, may be
errors in formatting. Feedback form
completed and some evidence of
responses acted on
Communication/presentation is
generally competent but with some
weaknesses. Title is sufficient and but
not informative. Many errors in use of
tense and style. Mistakes in use of
scientific English may not be
appropriate. Some confusion over
section content. Citations in text
mostly absent, reference list limited or
contains many errors. Feedback form
included and some reflection
/response given by the student
Title is insufficient. English,
language may not be appropriate
errors in tense and or style.
Much confusion over section
content. Citations in text absent,
reference list limited or contains
major errors. Maybe a feedback
form, but no constructive
reflection on the feedback and
no evidence that it has been
used in this piece of work
No title. Report not word
processed. English is
generally confused and
inappropriate. Section
content
not adhered to fully. No
referencing. No feedback
form from previous FLR
Class CG% General Characteristics L4
FIRST
96
Exceptional knowledge and understanding of the subject and its underlying concepts; critical evaluation/synthesis/analysis and of
reading/research; evidence of breadth and depth of reading/research to inform development of work; exceptional demonstration of
relevant skills; excellent communication; performance in some, if not all, areas deemed beyond expectation of the level.
89
81 Excellent knowledge of thesubjectasthestudent istypically able togobeyond what hasbeentaught (particularly forahigh 1st
); evidence of
breadth of reading/research to inform development of work; excellent demonstration of relevant skills; demonstrates strong
communication skills.
74
UPPER SECOND
68 As below but very good work characterised by evidence of wider understandingof the subjectas the student is typically able to relate
facts/concepts together with some ability to apply to known/taught contexts; identification and selection of material to informdevelopment
of work; very good demonstration of relevantskills;demonstrates good communication skills.
65
62
LOWER SECOND
58 Agood breadth of knowledge and understanding of thetaughtcontent although balanced towards the descriptive rather than analytical; uses
set material to inform development of work; addresses all aspects ofthe given brief; good demonstration of relevant taught skills,
though may be limited in range; communication shows clarity but structure may lack coherence.
55
52
THIRD
48 Knowledgeandunderstanding issufficient todealwithterminology,basicfactsandconceptsbutfailstomakemeaningful synthesis;relies on set
material to informdevelopment of work; generally addresses mostof the requirements of the given brief; adequate demonstration of
relevant skills over a limited range; communication/presentation is generally competent but with some weaknesses.
45
42
FAIL
35
Insufficient knowledge and understanding of the subject and its underlying concepts; some ability to evaluate given reading/research
however work is more generally descriptive; naively follows or may ignore set material in development of work; given brief may be only
tangentially addressed or may ignore key aspects of the brief; demonstration of relevant skills over areduced range; communication shows
limited clarity, poor presentation, structure may not be coherent.
25
15 Highly insufficientor no evidence of knowledge or understandingof the subject; understanding of taught concepts is typically at the word
levelwithfacts beingreproducedin adisjointed or decontextualised manner; ignores setmaterial in developmentof work;failsto address most
or all of the requirements of the brief;failsto demonstrate relevant skills;lacks basic communication skills.
5
ZERO 0 Work of no merit OR absent, work not submitted, penalty in some misconductcases.
The regulatory mechanisms of lac operongene expression
Feedforward
Following the feedback received from my protein determination lab report, firstly, I have tried
to be more specific in my descriptions, by adding more details to the mechanisms, figures or tables
that I choose to describe. Furthermore, I tried to avoid repetition in my description of results and at
the same time I tried to fully describe my result section in the discussion as much as possible by
corelating similar ideas into one large detailed description.
Introduction
Understanding of the knowledge of gene expression in bacteria was first approached by
molecular scientists Francois Jacob and Jacques Monod, who have been awarded the Nobel Prize in
1965 (Hardin, Bertoni & Kleinsmith, 2017) for their discovery of a genetic structure named the
operon (Monod & Jacob, n.d.), a group of genes with related functions that are located next to each
other and act as a single unit during the transcription process (Hardin, Bertoni & Kleinsmith, 2017),
which is catalyzed by RNA-polymerase, facilitating transfer of information from a DNA strand into a
new mRNA strand (Madigan, Bender, Buckley, Sattley & Stahl, 2017).
The operon gene regulating system has been showed to be more prevalent in prokaryotes,
rather than eukaryotes (Madigan, Bender, Buckley, Sattley & Stahl, 2017). For this reason,
experiments done in the light of this aspect have mostly been conducted on the Escherichia coli
bacterium which regulates its gene expression using a set of genes involved in lactose catabolism,
called the lac operon (Hardin, Bertoni & Kleinsmith, 2017), which represents the main topic to be
analyzed in this experiment.
The aim of this formal lab report is to assess gene expression control mechanisms of the lac
operon, based on three factors. The bacterial growth experiment showed the growth rate of E. coli
cells in the presence of different energy sources, explaining at the same time why one sugar was
preferred to another. The second interpreting factor is the amount of b-galactosidase present at
different time points in the E. coli samples, which was assessed by the b-galactosidase assay and
reflects the level of gene expression taking place. The third interpreting factor is the appearance in
shape, color and amount of E. coli cells analyzed under the microscope at two time points and the
variations in gene expression that this could reflect.
The lac operon consists of three enzyme encoding genes: lacZ, lacY and lacA that encode for
b-galactosidase, galactoside permease and transacetylase respectively (Hardin, Bertoni & Kleinsmith,
2017). Consequently, Figure 1 reflects the general structure of the lac operon: the RNA-polymerase
binding-site, the promoter (Plac), followed by the repressor binding-site, the operator (O), followed
by the lacZ, lacY and lacA genes (Hardin, Bertoni & Kleinsmith, 2017).
Figure 1. Structural components of the lac operon. The lac operon is formed by the lac promoter
(Plac), followed by the lac operon (O), followed by the lacZ, lacY and lacA genes (Hardin, Bertoni &
Kleinsmith, 2017).
The level of gene expression at the lac operon is greatly influenced by and regulated by two
types of transcription factors: activators, that bind DNA and increase gene expression, such as CAP
(catabolite activator protein) and repressors, that bind DNA and decrease gene expression, such as
the lacI repressor (Hardin, Bertoni & Kleinsmith, 2017) (Monod & Jacob, n.d.).
Furthermore, to control transcription of lacZ, lacY and lacA genes into mRNA, the presence
of the lacI regulatory gene, positioned adjacent to the lac operon and preceded by its own promoter
(PI) (Figure 1), is required to encode for a repressor protein that inhibits gene translation (Hardin,
Bertoni & Kleinsmith, 2017).
Gene expression of the lac operon is initiated by the presence of the lactose inducer (Hardin,
Bertoni & Kleinsmith, 2017).
In the absence of lactose, the lacI gene is active and produces the lac repressor which binds to
the lac operator (O), therefore restricting the RNA-polymerase from advancing from the promoter
binding-site to the operator, to complete gene transcription, in other words inhibiting gene expression
(Figure 2) (Hardin, Bertoni & Kleinsmith, 2017).
Figure 2. The lac repressor binds to the lac operon in the absence of lactose. When the lacI gene is
active, it produces the lac repressor transcription factor, which represses transcription of the lac
operon genes and decreases gene expression (Hardin, Bertoni & Kleinsmith, 2017).
However, when lactose enters the cell, it suffers an isomerization reaction, transforming
lactose into allolactose, that binds to the lac repressor causing a conformational change, resulting in
the lac repressor being unable to bind to the lac operator (O) anymore, allowing RNA-polymerase to
cross from the lac operator until reaching the stop sequence, to complete gene transcription (Hardin,
Bertoni & Kleinsmith, 2017). At this point, the resulting product is a single newly transcribed
polycistronic strand of mRNA that holds the lacZ, lacY and lacA genes (Madigan, Bender, Buckley,
Sattley & Stahl, 2017) which will allow synthesis of β -galactosidase, galactoside permease and
transacetylase (Figure 3).
Figure 3. The lac operator is clear in the presence of lactose and allows RNA-polymerase to
perform transcription. The lac repressor is bound by allolactose, that produces conformational
changes and makes the lac repressor unable to bind to the lac operator (Hardin, Bertoni &
Kleinsmith, 2017).
β -galactosidase degrades the lactose disaccharide, transported into the cell by galactoside
permease, into two monosaccharides: galactose and glucose, that undergo glycolysis, with the help of
transacetylase and used as energy sources (Hardin, Bertoni & Kleinsmith, 2017). As a consequence,
β -galactoside can exert its role in the cell only in the presence of lactose.
Another important factor in the lac operon regulation is the presence of cAMP, a compound
normally synthesized from ATP through a reaction catalyzed by adenylyl cyclase, an enzyme
inhibited by glucose (Hardin, Bertoni & Kleinsmith, 2017). cAMP binds to the allosteric regulatory
protein CAP (catabolite activator protein) and forms the CAP-cAMP complex which binds the CAP-
binding site, located before Plac (Hardin, Bertoni & Kleinsmith, 2017). When cAMP is bound, CAP
is active, which stimulates the transcription initiation. Therefore, the presence of glucose greatly
influences the transcription rate, as E. coli cells have been shown to prefer glucose as their first
carbon source, rather than lactose (Hardin, Bertoni & Kleinsmith, 2017).
The hypothesis of this experiment was that transcription rates and the gene expression level of
the lac operon is greatly influenced by the presence or absence of lactose and glucose, which was
assessed by plotting the growth curve. Moreover, the influence of these sugars over the gene
expression of the lac operon was to be reflected in the β -galactosidase assay, where samples
analyzed would undergo a reaction similar to the in-vivo β -galactosidase lactose hydrolysis that
would change the color of the sample into yellow; this would suggest high levels of β -galactosidase
were present in the sample, a direct representation of high gene expression of the lac operon.
Methods
Growth curve
Four flasks containing 45 mL of M9 medium were prepared and labeled as: control (M9
medium), Lac, Glu and Lac& Glu. 5 mL of glucose (25 mM) and 5 mL of lactose (25 mM) were
added to the Glu and, respectively, the Lac sample, with a final sugar concentration of 2.5 mM for
each. 2.5 mL of each sugar, glucose (25 mM) and lactose (25 mM) were both added to the Lac& Glu
sample, with a final total sugar concentration of 2.5 mM. 5 mL of sterile water were added to the
control (M9 medium) sample. Then, 4 mL of overnight bacterial culture E. coli K12 (Lac+) were
added to each sample.
The four samples were left to incubate at 37°C in a shaking incubator (120 rpm). The
absorbance was quantified using a spectrophotometer at 540 nm every 30 minutes for 6 hours.
Β-galactosidase assay
PBS (0.4 mL) was added to 0.1 mL of culture from each of the M9 medium, sugar and E. coli
bacterial culture samples prepared before. The experiment was carried out in triplicates for Glu
sample, Lac sample and Glu& Lac sample. Toluene (10 µl) and then ONPG (0.5 mL) were added to
each new sample mix of PBS and culture, after which the samples were left to incubate at 35C in a
water bath for 10 minutes.
Sodium carbonate 1M (0.25 mL) was added to each sample after incubation. The absorbance
was then quantified using a spectrophotometer at 420 nm.
This experiment was carried out at three points in time during the 6 hours period, respectively
at: 60 minutes, 180 minutes and 330 minutes.
Gram stain
E. coli culture (1 mL) was taken and centrifuged at 6000 rpm for 5 minutes. 950 µl of
supernatant were removed and the pellet was resuspended in the remaining 50 µl of supernatant. A
fixed smear was prepared and a gram stain of the E. coli bacterial culture was conducted. The gram
stain slide was then observed under a microscope.
Statistical Analysis
The OD540 measured over the 6 hours growth period and the corresponding sampling time
points of the initial M9 medium, sugar and E. coli bacterial culture K12 sample series were plotted
into a calibration graph using Excel.
Separate calibration graphs were also created for the Glu sample, Lac sample and Lac& Glu
sample with OD540 values plotted over the sampling times that occurred during exponential phase of
growth using Excel. The equation for the line and R2 were deducted from the calibration graph using
Excel. The equation for the line was used to determine the doubling times (Td) for the Glu, Lac and
Lac & Glu samples, which were then gathered into a doubling time table, also using Excel.
For example, the calculations produced for the Glu sample were done as follows:
y= 0.0764e0.008x
y=AeBx
=> B= 0.008
Td= ln2/B
Td= 0.693/0.008
Td= 87 minutes
Using the OD420 values measured at 60 minutes, 180 minutes and 330 minutes, the miller
units were calculated for the Lac, Glu and Lac& Glu triplicate samples using Excel. The miller unit
values were then plotted into a table for each sampling time point and the average and standard
deviation (SD) were generated for each individual set of Glu, Lac and Glu& Lac triplicates. The
average miller unit values for each sample from all of the three sampling time points were plotted
into a bar chart using Excel, with the SD integrated as error bars.
For example, for the Glu sample at 60 minutes, the miller units were calculated as follows:
Miller unit general formula:
𝑂𝐷420
𝑣𝑜𝑙𝑢𝑚𝑒 𝑜𝑓 𝑐𝑒𝑙𝑙𝑠 𝑖𝑛 𝑟𝑒𝑎𝑐𝑡𝑖𝑜𝑛 (𝑚𝐿) 𝑥 𝑟𝑒𝑎𝑐𝑡𝑖𝑜𝑛 𝑖𝑛𝑐𝑢𝑏𝑎𝑡𝑖𝑜𝑛 𝑡𝑖𝑚𝑒 (𝑚𝑖𝑛𝑠) 𝑥 𝑂𝐷540
𝑥 1000
Volume of cells in reaction= 0.1 mL
Reaction incubation time= 10 minutes
Replicate 1 Glu sample at 60 minutes
OD420= 0.052
OD540= 0.155
0.052
0.1 ∗ 10 ∗ 0.155
∗ 1000 = 336 𝑚𝑖𝑙𝑙𝑒𝑟 𝑢𝑛𝑖𝑡𝑠
Replicate 2 Glu sample at 60 minutes
OD420= 0.058
OD540= 0.155
0.058
0.1 ∗ 10 ∗ 0.155
∗ 1000 = 374 𝑚𝑖𝑙𝑙𝑒𝑟 𝑢𝑛𝑖𝑡𝑠
Replicate 3 Glu sample at 60 minutes
OD420= 0.041
OD540= 0.155
0.041
0.1 ∗ 10 ∗ 0.155
= 265 𝑚𝑖𝑙𝑙𝑒𝑟 𝑢𝑛𝑖𝑡𝑠
Results
Figure 4. E. coli bacterial growth. E. coli was grown in minimal media with four different variations
of sugar: with lactose (red), with glucose (green), with glucose and lactose (yellow) and with no
sugar (blue). The liquid cultures were monitored at OD540 nm every 30 minutes for 6 hours. The
OD540 values were plotted against time in minutes using Excel.
To investigate the requirement for glucose and/or lactose on the growth of E. coli, a bacterial
growth curve was carried out. An overnight culture of E. coli was diluted into fresh minimal media
supplemented with either glucose, lactose, both glucose and lactose or no sugar. Cells were
monitored over a 6-hour period. As shown in Figure 4, in the presence of lactose E. coli cells grow
well and enter the exponential phase of the growth curve at approximately 30 minutes. Exponential
growth begins to slow down after 240 minutes, when the cells enter the stationary phase of the
growth curve. For the cells grown in the absence of sugars, no growth is observed during the 6 hours
growth period.
0.01
0.1
1
10
0 60 120 180 240 300 360
Abs
540
nm
Time (minutes)
Growth Curve
Control Lactose Glucose Glu + Lac
Figure 5. The rate of E. coli growth can be observed by analyzing the exponential or log phase of
bacterial growth. The lactose (red), glucose (green) and glucose and lactose a) and b) (yellow) E.
coli samples have shown exponential growth during the 6-hour experiment, which was measured
every 30 minutes using a spectrophotometer at 540 nm. The OD540 values were plotted against time
using Excel.
For the analyses of E. coli. doubling times in the presence of different energy sources the
exponential phase of the growth curve was plotted into individual graphs. The lag phase was
determined by identifying the beginning time point of bacterial growth and the time point of entering
stationary phase, from the growth curve previously generated. As shown in figure 5, E. coli cells
enter the exponential phase of bacterial growth at approximately 90 minutes and enter the stationary
phase approximately 330 minutes in the presence of glucose. The exponential phase is observed
twice for cells growing in the presence of glucose and lactose over the 6-hour period.
Doubling times
(minutes)
Lactose 82
Glucose 87
Glu+Lac a) 78
Glu+Lac b) 131
Figure 6. The E. coli culture has doubled in the presence of different variations of sugars. Optimal
media enriched with sugars was created in order to allow the E. coli cultures to grow. The
exponential growth phase of E. coli growth was analyzed and the doubling interval of time in minutes
was determined for each sample. The doubling time (minutes) calculations were generated using
Excel.
For each sugar sample containing E. coli cells the doubling time of bacterial growth in
minutes was calculated and documented into a table. In the case of the cells grown in the presence of
both glucose and lactose, the two separate doubling times, a) and b) have been considered and
registered in the table individually. As shown in Figure 6, E. coli cells grown in the presence of
glucose and lactose have doubled first (a)) every 78 minutes and second (b)) every 131 minutes over
the 6-hour period.
Figure 7. The b-galactosidase assay. The b-galactosidase assay was carried out on samples taken at
different time points: at 60 minutes (blue), at 180 minutes (orange) and at 330 minutes (grey). The
samples taken were monitored at OD420 every 120 and 150 minutes, starting at 60 minutes over the 6-
hour period. The average miller units were plotted in a bar chart and error bars were added using
Excel.
In order to determine the average miller units, 3 samples taken in triplicates were collected from
the E. coli cells growing in glucose, lactose and glucose and lactose media. The OD420 values were
measured and used to calculate the miller units for each set of replicates. The average miller units
were determined for each sample at each individual sampling time point. As shown in Figure 7, cells
grown in the presence of glucose at any time point have an average miller unit between 300 and 500,
0
200
400
600
800
1000
1200
1400
1600
1800
Glucose+Lactose Glucose Lactose
Average
Miller
Units
b-galactosidaseassay
Time 60 minutes Time 180 minutes Time 330 minutes
while the cells grown in the presence of lactose at any time point have a higher average miller unit
value, between 700 and 1500.
Figure 8. E. coli bacterial growth was examined under the microscope. E. coli grown in minimal
media with three different variations of sugar were sampled at two time points during the 6-hour
period. A fixed smear was prepared and a gram stain was conducted. The slides were observed at
x1000 under the microscope.
For each sample of E. coli grown in the presence or absence of sugars, a new sample was taken
at 30 minutes and 270 minutes during the 6-hour period. Gram stain slides were prepared and
analyzed for each sample. As shown in Figure 8, cells grown in the presence of glucose at the 270
minutes time point are considerably numerous in comparison to the 30 minutes time point sample.
For the cells grown in the absence of sugar in the control sample, no cell growth is observed between
the two time points.
Discussion
The result analyses of the first experiment have shown that the most well E coli cell growth was
in the presence of lactose, as shown in Figure 4 and 5, where the growth curve suggests that the
exponential growth phase has a uniform doubling time of 82 minutes (Figure 6) at equal intervals in a
steady pace for a longer period of time. The reason for this manifestation, is due to the fact that when
lactose is present, transcription and gene expression can occur, which allows the synthesis of b-
galactosidase, that catalyzes the lactose hydrolysis reaction, resulting in the formation of galactose
and glucose (Hardin, Bertoni & Kleinsmith, 2017).
This result is also reflected in the b-galactosidase assay (Figure 7) where the average miller units
in the lactose sample at all three time points were higher than the Glucose and Glucose+ Lactose
samples, suggesting that the higher the miller unit, the higher the OD420 values, meaning that a higher
level of b-galactosidase was present in the lactose sample, which can also be justified by the process
described above.
The fact that E. coli cells prefer glucose as their first energy source (Hardin, Bertoni &
Kleinsmith, 2017) can be observed in the Glu+Lac sample (Figure 4 and 5) as the growth curve has
showed two log phases of growth when plotted, representing that in the first exponential phase
(Figure 5 Glu+Lac a)) cells used glucose first until finished, followed by a slight and short stationary
phase which represents the point when E. coli switched to their second preferable energy source,
lactose (Figure 5 Glu+Lac b)); this switch point being know as the diauxic point.
The lowest growth rate was observed in cells grown in the presence of glucose, since this
sugar is known to inhibit the synthesis of cAMP, that can no longer bind to CAP in order to enhance
gene expression (Hardin, Bertoni & Kleinsmith, 2017). Another reason for this result, is that in the
absence of lactose, the lac repressor binds the lac operator, which blocks RNA-polymerase from gene
transcription. Therefore, with glucose present E. coli cells already have their preferred energy source
available, so they do not need to activate gene expression (Hardin, Bertoni & Kleinsmith, 2017).
After undergoing the preparation of the gram stain slide, E. coli cells present a pink-red color,
which demonstrates that safranin has stained the cell, suggesting that E. coli cells are gram-negative,
rod-shaped cells. At the 30 minutes time point, cells are present in fewer numbers, which might be
because the growth phase is just about to or just began. On the other hand, the 270 point shows that
glucose cell density is the highest compared to lactose and lactose&glucose samples, because at 270
minutes E. coli cells are still in the exponential phase, unlike the other samples which are already in
stationary phase, beginning cell degradation (Figure 5).
Reference List
Monod Jacques & Jacob Francois (n.d.) General Conclusions: Teleonomic Mechanisms in Cellular
Metabolism, Growth, and Differentiation, Services de Biochimie Cellulaire et de Genetique
Microbienne, Institut Pasteur, Paris
http://llama.mshri.on.ca/courses/Biophysics205/Papers/Monod_Jacob.pdf
Hardin Jeff, Bertoni Paul Gregory & Kleinsmith J. Lewis (2017) Becker`s World of the Cell, 9th ed.,
Global Edition, Publisher: Pearson
Madigan T. Michael, Bender S. Kelly, Buckley H. Daniel, Sattley W. Matthew & Stahl A. David
(2017) Brock Biology of Microorganisms, Global Edition, 15th ed. Publisher: Pearson pp. 151, 152

Lac Operon Feedback.docx

  • 1.
    Professional and ScientificPractice 1:Labs Department of Biosciences & Chemistry L4 FLR Formative Assessment Instructions: 1) Complete your name. 2) Save file as: surname_FLR_form_2019-20.docx e.g. Campbell_S_FLR _form_2019-20.docx 3) Insert your work on the final page so that the feedback forms are at the front. 4) Submit your work to Blackboard submission tool on the Blackboard site and Turnitin as a Word- compatible file (not a pdf). Student Name: DorobantuAdina Georgiana Number: 30019475 Learning contract? Insert details if applicable here. Marker:Mel Lacey Grade: 74% Strengths: Excellent level of detail and use of diagrams in the introduction Methods is nice and concise, included data analysis Excellent data analysis and written description of the results. excellent figure legends throughout referred to literature in the discussion Areas to improve: make sure introduction is complete no need of worked examples in the methods formating of the reference list Student comments for feed-forward how will you use this feedback to improve your future work?:
  • 2.
    Indicator First (High) First Upper Second LowerSecond Third Fail Fail Introduction (Hypothesis and aims only) 20% Exceptional knowledge and understanding of the subject and its underlying concepts Hypothesis is relevant and clearly stated. Concise and appropriate aims and objectives for experiment outlined. All elements of report introduced in a correct, clear, concise manner. No errors. Excellent knowledge of the subject beyond what was taught. Hypothesis is relevant and clearly stated. Concise and appropriate aims and objectives for experiment outlined. All elements of report introduced in a correct, clear, concise manner. Very minor errors. A very good breadth of knowledge and understanding relating facts and concepts together. Hypothesis is relevant and clearly stated. Concise and appropriate aims and objectives for experiment outlined. All elements of report introduced in a scientifically correct manner. Minor errors. A good breadth of knowledge and understanding. Hypothesis is stated, but may be unclear. Aims and objectives stated, but may be unclear or limited. All areas of the report introduced, but lack of understanding shown in some areas. Knowledge and understanding is sufficient to deal with terminology, basic facts and concepts. Hypothesis is stated, but may be unclear or incomplete. Aims and objectives stated, but may be unclear, limited or incomplete. Most areas of report introduced, may show lack of understanding. Insufficient knowledge and understanding of the subject and its underlying concepts. Hypothesis absent. Statement of aims unclear, limited or incomplete. Introduction incomplete and contains major errors in understanding. Highlyinsufficient or no evidence of knowledge or understanding of the subject. No statement of aims or hypothesis. Introduction missing, irrelevant or inaccurate in the most part. Materials and Methods 20% Clear methods, in past impersonal tense and in paragraphs. Updates from modifications from the lab script given. Correct format and details of statistical analysis. No errors. Clear methods, in past impersonal tense and in paragraphs. Updates from modifications from the lab script given. Correct format and details of statistical analysis. Very minor errors. Clear methods, in past impersonal tense and in paragraphs. Updates from modifications from the lab script given. Correct format and details of statistical analysis. Minor errors. Methods provided in past impersonal tense and in paragraphs but changes may not have been incorporated and some errors in style. Some information given on statistics, but may be incomplete or inaccurate. Lab script re-worded but may lack full consistency to style of past tense/ paragraphs. i.e. may use bullet points. No details of statistical analysis. Some attempt to re-word lab script but not in past tense or in paragraphs. Bullets from lab script. Results 30% Data presentation is exceptional. Clear well labeled graphs (to include title, axis titles and units). Figures with correct annotations and clear legends (including figure numbers). Correct statistics provided. Well written logical description of results, to make the data understandable to the reader. No errors. Data presentation excellent. Clearly labeled graphs (to include title, axis titles and units). Figures with correct annotations and clear legends (including figure numbers). Correct statistics provided. Well written logical description of results, to make the data understandable to the reader. Very minor errors. Data presentation is very good. Clear well labeled graphs (to include title, axis titles and units). Figures with correct annotations and clear legends (including figure numbers). Correct statistics provided. Well written logical description of results, to make the data understandable to the reader. Minor errors. Graphs and tables are good but may be incorrectly labelled. Limited written description of result. Figure legends limited. Statistical analysis contains errors. Graphs and tables are sufficient. Maybe incorrectly labelled, some may be absent. No written description of result. Figure legends absent. Data analysis contains errors Graphs and tables insufficient. Incorrectly labelled, some may be absent. No written description of result. Figure legends absent. No data analysis. Limited results, some graphs or raw data given. Discussion 20% Discussion shows critical evaluation of whether the aims of the experiment were achieved. Aims of lab or hypothesis referred to. All key findings and results summarised. All relevant results linked to literature. No errors. Discussion goes beyond what has been taught. Aims of lab or hypothesis referred to. All key findings and results summarised. Full discussion of whether the aims of the experiment were achieved. All relevant results linked to literature. Very minor errors. Discussion able to relate facts/concepts together. Aims of lab or hypothesis referred to. All key findings and results summarised. Full discussion of whether the aims of the experiment were achieved. Relevant results linked to literature. Minor errors. Discussion balanced towards the descriptive rather than analytical. Summary of results given but limited discussion of whether aims were achieved. Some attempt to link results to literature. Discussion deals with terminology, basic facts and concepts. Summary of some results, limited link to aims or hypothesis. Limited attempt to link results to literature. Discussion is descriptive. Summary of some results, no link to aims or hypothesis. No attempt to link results to literature. Inaccurate and irrelevant content Formatting, referencing and scientific presentation 10% Excellent communication skills beyond expectation of the level. Exception use of relevant scientific language throughout. Citations correct and thorough. Reference list complete, and properly laid out. No errors present. Feedback form includes considered student response to the feedback and evidence in the report that this was used to good effect Strong communication skills. Clear, informative title. Report is written clearly, concisely, in the appropriate tense and impersonal style. Excellent use of relevant scientific language. Very minor error present. Section content is correct. Citations correct and thorough. Reference list complete, and properly laid out. Very minor errors. Feedback form includes considered student response to the feedback and evidence in the report that this was used. Very good demonstration of communication skills. Clear, informative title. Report is, written clearly, concisely, in the appropriate tense and correct use of scientific language. Minor errors present. Section content is correct. Citations correct and thorough. Reference list complete, and properly laid out. Minor errors. Very good use of the previous feedback form and constructive remarks in the student response section of previously Good demonstration of communication skills. Title is basic and not informative. May be errors in use of tense and style. Mistakes in use of scientific English. Section content is correct. Some citations in text but not complete. Reference list complete, may be errors in formatting. Feedback form completed and some evidence of responses acted on Communication/presentation is generally competent but with some weaknesses. Title is sufficient and but not informative. Many errors in use of tense and style. Mistakes in use of scientific English may not be appropriate. Some confusion over section content. Citations in text mostly absent, reference list limited or contains many errors. Feedback form included and some reflection /response given by the student Title is insufficient. English, language may not be appropriate errors in tense and or style. Much confusion over section content. Citations in text absent, reference list limited or contains major errors. Maybe a feedback form, but no constructive reflection on the feedback and no evidence that it has been used in this piece of work No title. Report not word processed. English is generally confused and inappropriate. Section content not adhered to fully. No referencing. No feedback form from previous FLR
  • 3.
    Class CG% GeneralCharacteristics L4 FIRST 96 Exceptional knowledge and understanding of the subject and its underlying concepts; critical evaluation/synthesis/analysis and of reading/research; evidence of breadth and depth of reading/research to inform development of work; exceptional demonstration of relevant skills; excellent communication; performance in some, if not all, areas deemed beyond expectation of the level. 89 81 Excellent knowledge of thesubjectasthestudent istypically able togobeyond what hasbeentaught (particularly forahigh 1st ); evidence of breadth of reading/research to inform development of work; excellent demonstration of relevant skills; demonstrates strong communication skills. 74 UPPER SECOND 68 As below but very good work characterised by evidence of wider understandingof the subjectas the student is typically able to relate facts/concepts together with some ability to apply to known/taught contexts; identification and selection of material to informdevelopment of work; very good demonstration of relevantskills;demonstrates good communication skills. 65 62 LOWER SECOND 58 Agood breadth of knowledge and understanding of thetaughtcontent although balanced towards the descriptive rather than analytical; uses set material to inform development of work; addresses all aspects ofthe given brief; good demonstration of relevant taught skills, though may be limited in range; communication shows clarity but structure may lack coherence. 55 52 THIRD 48 Knowledgeandunderstanding issufficient todealwithterminology,basicfactsandconceptsbutfailstomakemeaningful synthesis;relies on set material to informdevelopment of work; generally addresses mostof the requirements of the given brief; adequate demonstration of relevant skills over a limited range; communication/presentation is generally competent but with some weaknesses. 45 42 FAIL 35 Insufficient knowledge and understanding of the subject and its underlying concepts; some ability to evaluate given reading/research however work is more generally descriptive; naively follows or may ignore set material in development of work; given brief may be only tangentially addressed or may ignore key aspects of the brief; demonstration of relevant skills over areduced range; communication shows limited clarity, poor presentation, structure may not be coherent. 25 15 Highly insufficientor no evidence of knowledge or understandingof the subject; understanding of taught concepts is typically at the word levelwithfacts beingreproducedin adisjointed or decontextualised manner; ignores setmaterial in developmentof work;failsto address most or all of the requirements of the brief;failsto demonstrate relevant skills;lacks basic communication skills. 5 ZERO 0 Work of no merit OR absent, work not submitted, penalty in some misconductcases.
  • 5.
    The regulatory mechanismsof lac operongene expression Feedforward Following the feedback received from my protein determination lab report, firstly, I have tried to be more specific in my descriptions, by adding more details to the mechanisms, figures or tables that I choose to describe. Furthermore, I tried to avoid repetition in my description of results and at the same time I tried to fully describe my result section in the discussion as much as possible by corelating similar ideas into one large detailed description. Introduction Understanding of the knowledge of gene expression in bacteria was first approached by molecular scientists Francois Jacob and Jacques Monod, who have been awarded the Nobel Prize in 1965 (Hardin, Bertoni & Kleinsmith, 2017) for their discovery of a genetic structure named the operon (Monod & Jacob, n.d.), a group of genes with related functions that are located next to each other and act as a single unit during the transcription process (Hardin, Bertoni & Kleinsmith, 2017), which is catalyzed by RNA-polymerase, facilitating transfer of information from a DNA strand into a new mRNA strand (Madigan, Bender, Buckley, Sattley & Stahl, 2017). The operon gene regulating system has been showed to be more prevalent in prokaryotes, rather than eukaryotes (Madigan, Bender, Buckley, Sattley & Stahl, 2017). For this reason, experiments done in the light of this aspect have mostly been conducted on the Escherichia coli bacterium which regulates its gene expression using a set of genes involved in lactose catabolism, called the lac operon (Hardin, Bertoni & Kleinsmith, 2017), which represents the main topic to be analyzed in this experiment. The aim of this formal lab report is to assess gene expression control mechanisms of the lac operon, based on three factors. The bacterial growth experiment showed the growth rate of E. coli cells in the presence of different energy sources, explaining at the same time why one sugar was preferred to another. The second interpreting factor is the amount of b-galactosidase present at different time points in the E. coli samples, which was assessed by the b-galactosidase assay and reflects the level of gene expression taking place. The third interpreting factor is the appearance in shape, color and amount of E. coli cells analyzed under the microscope at two time points and the variations in gene expression that this could reflect. The lac operon consists of three enzyme encoding genes: lacZ, lacY and lacA that encode for b-galactosidase, galactoside permease and transacetylase respectively (Hardin, Bertoni & Kleinsmith, 2017). Consequently, Figure 1 reflects the general structure of the lac operon: the RNA-polymerase binding-site, the promoter (Plac), followed by the repressor binding-site, the operator (O), followed by the lacZ, lacY and lacA genes (Hardin, Bertoni & Kleinsmith, 2017).
  • 6.
    Figure 1. Structuralcomponents of the lac operon. The lac operon is formed by the lac promoter (Plac), followed by the lac operon (O), followed by the lacZ, lacY and lacA genes (Hardin, Bertoni & Kleinsmith, 2017). The level of gene expression at the lac operon is greatly influenced by and regulated by two types of transcription factors: activators, that bind DNA and increase gene expression, such as CAP (catabolite activator protein) and repressors, that bind DNA and decrease gene expression, such as the lacI repressor (Hardin, Bertoni & Kleinsmith, 2017) (Monod & Jacob, n.d.). Furthermore, to control transcription of lacZ, lacY and lacA genes into mRNA, the presence of the lacI regulatory gene, positioned adjacent to the lac operon and preceded by its own promoter (PI) (Figure 1), is required to encode for a repressor protein that inhibits gene translation (Hardin, Bertoni & Kleinsmith, 2017). Gene expression of the lac operon is initiated by the presence of the lactose inducer (Hardin, Bertoni & Kleinsmith, 2017). In the absence of lactose, the lacI gene is active and produces the lac repressor which binds to the lac operator (O), therefore restricting the RNA-polymerase from advancing from the promoter binding-site to the operator, to complete gene transcription, in other words inhibiting gene expression (Figure 2) (Hardin, Bertoni & Kleinsmith, 2017). Figure 2. The lac repressor binds to the lac operon in the absence of lactose. When the lacI gene is active, it produces the lac repressor transcription factor, which represses transcription of the lac operon genes and decreases gene expression (Hardin, Bertoni & Kleinsmith, 2017). However, when lactose enters the cell, it suffers an isomerization reaction, transforming lactose into allolactose, that binds to the lac repressor causing a conformational change, resulting in
  • 7.
    the lac repressorbeing unable to bind to the lac operator (O) anymore, allowing RNA-polymerase to cross from the lac operator until reaching the stop sequence, to complete gene transcription (Hardin, Bertoni & Kleinsmith, 2017). At this point, the resulting product is a single newly transcribed polycistronic strand of mRNA that holds the lacZ, lacY and lacA genes (Madigan, Bender, Buckley, Sattley & Stahl, 2017) which will allow synthesis of β -galactosidase, galactoside permease and transacetylase (Figure 3). Figure 3. The lac operator is clear in the presence of lactose and allows RNA-polymerase to perform transcription. The lac repressor is bound by allolactose, that produces conformational changes and makes the lac repressor unable to bind to the lac operator (Hardin, Bertoni & Kleinsmith, 2017). β -galactosidase degrades the lactose disaccharide, transported into the cell by galactoside permease, into two monosaccharides: galactose and glucose, that undergo glycolysis, with the help of transacetylase and used as energy sources (Hardin, Bertoni & Kleinsmith, 2017). As a consequence, β -galactoside can exert its role in the cell only in the presence of lactose. Another important factor in the lac operon regulation is the presence of cAMP, a compound normally synthesized from ATP through a reaction catalyzed by adenylyl cyclase, an enzyme inhibited by glucose (Hardin, Bertoni & Kleinsmith, 2017). cAMP binds to the allosteric regulatory protein CAP (catabolite activator protein) and forms the CAP-cAMP complex which binds the CAP- binding site, located before Plac (Hardin, Bertoni & Kleinsmith, 2017). When cAMP is bound, CAP is active, which stimulates the transcription initiation. Therefore, the presence of glucose greatly influences the transcription rate, as E. coli cells have been shown to prefer glucose as their first carbon source, rather than lactose (Hardin, Bertoni & Kleinsmith, 2017). The hypothesis of this experiment was that transcription rates and the gene expression level of the lac operon is greatly influenced by the presence or absence of lactose and glucose, which was assessed by plotting the growth curve. Moreover, the influence of these sugars over the gene expression of the lac operon was to be reflected in the β -galactosidase assay, where samples analyzed would undergo a reaction similar to the in-vivo β -galactosidase lactose hydrolysis that would change the color of the sample into yellow; this would suggest high levels of β -galactosidase were present in the sample, a direct representation of high gene expression of the lac operon.
  • 8.
    Methods Growth curve Four flaskscontaining 45 mL of M9 medium were prepared and labeled as: control (M9 medium), Lac, Glu and Lac& Glu. 5 mL of glucose (25 mM) and 5 mL of lactose (25 mM) were added to the Glu and, respectively, the Lac sample, with a final sugar concentration of 2.5 mM for each. 2.5 mL of each sugar, glucose (25 mM) and lactose (25 mM) were both added to the Lac& Glu sample, with a final total sugar concentration of 2.5 mM. 5 mL of sterile water were added to the control (M9 medium) sample. Then, 4 mL of overnight bacterial culture E. coli K12 (Lac+) were added to each sample. The four samples were left to incubate at 37°C in a shaking incubator (120 rpm). The absorbance was quantified using a spectrophotometer at 540 nm every 30 minutes for 6 hours. Β-galactosidase assay PBS (0.4 mL) was added to 0.1 mL of culture from each of the M9 medium, sugar and E. coli bacterial culture samples prepared before. The experiment was carried out in triplicates for Glu sample, Lac sample and Glu& Lac sample. Toluene (10 µl) and then ONPG (0.5 mL) were added to each new sample mix of PBS and culture, after which the samples were left to incubate at 35C in a water bath for 10 minutes. Sodium carbonate 1M (0.25 mL) was added to each sample after incubation. The absorbance was then quantified using a spectrophotometer at 420 nm. This experiment was carried out at three points in time during the 6 hours period, respectively at: 60 minutes, 180 minutes and 330 minutes. Gram stain E. coli culture (1 mL) was taken and centrifuged at 6000 rpm for 5 minutes. 950 µl of supernatant were removed and the pellet was resuspended in the remaining 50 µl of supernatant. A fixed smear was prepared and a gram stain of the E. coli bacterial culture was conducted. The gram stain slide was then observed under a microscope. Statistical Analysis The OD540 measured over the 6 hours growth period and the corresponding sampling time points of the initial M9 medium, sugar and E. coli bacterial culture K12 sample series were plotted into a calibration graph using Excel. Separate calibration graphs were also created for the Glu sample, Lac sample and Lac& Glu sample with OD540 values plotted over the sampling times that occurred during exponential phase of growth using Excel. The equation for the line and R2 were deducted from the calibration graph using Excel. The equation for the line was used to determine the doubling times (Td) for the Glu, Lac and Lac & Glu samples, which were then gathered into a doubling time table, also using Excel. For example, the calculations produced for the Glu sample were done as follows: y= 0.0764e0.008x y=AeBx => B= 0.008 Td= ln2/B
  • 9.
    Td= 0.693/0.008 Td= 87minutes Using the OD420 values measured at 60 minutes, 180 minutes and 330 minutes, the miller units were calculated for the Lac, Glu and Lac& Glu triplicate samples using Excel. The miller unit values were then plotted into a table for each sampling time point and the average and standard deviation (SD) were generated for each individual set of Glu, Lac and Glu& Lac triplicates. The average miller unit values for each sample from all of the three sampling time points were plotted into a bar chart using Excel, with the SD integrated as error bars. For example, for the Glu sample at 60 minutes, the miller units were calculated as follows: Miller unit general formula: 𝑂𝐷420 𝑣𝑜𝑙𝑢𝑚𝑒 𝑜𝑓 𝑐𝑒𝑙𝑙𝑠 𝑖𝑛 𝑟𝑒𝑎𝑐𝑡𝑖𝑜𝑛 (𝑚𝐿) 𝑥 𝑟𝑒𝑎𝑐𝑡𝑖𝑜𝑛 𝑖𝑛𝑐𝑢𝑏𝑎𝑡𝑖𝑜𝑛 𝑡𝑖𝑚𝑒 (𝑚𝑖𝑛𝑠) 𝑥 𝑂𝐷540 𝑥 1000 Volume of cells in reaction= 0.1 mL Reaction incubation time= 10 minutes Replicate 1 Glu sample at 60 minutes OD420= 0.052 OD540= 0.155 0.052 0.1 ∗ 10 ∗ 0.155 ∗ 1000 = 336 𝑚𝑖𝑙𝑙𝑒𝑟 𝑢𝑛𝑖𝑡𝑠 Replicate 2 Glu sample at 60 minutes OD420= 0.058 OD540= 0.155 0.058 0.1 ∗ 10 ∗ 0.155 ∗ 1000 = 374 𝑚𝑖𝑙𝑙𝑒𝑟 𝑢𝑛𝑖𝑡𝑠 Replicate 3 Glu sample at 60 minutes OD420= 0.041 OD540= 0.155 0.041 0.1 ∗ 10 ∗ 0.155 = 265 𝑚𝑖𝑙𝑙𝑒𝑟 𝑢𝑛𝑖𝑡𝑠
  • 10.
    Results Figure 4. E.coli bacterial growth. E. coli was grown in minimal media with four different variations of sugar: with lactose (red), with glucose (green), with glucose and lactose (yellow) and with no sugar (blue). The liquid cultures were monitored at OD540 nm every 30 minutes for 6 hours. The OD540 values were plotted against time in minutes using Excel. To investigate the requirement for glucose and/or lactose on the growth of E. coli, a bacterial growth curve was carried out. An overnight culture of E. coli was diluted into fresh minimal media supplemented with either glucose, lactose, both glucose and lactose or no sugar. Cells were monitored over a 6-hour period. As shown in Figure 4, in the presence of lactose E. coli cells grow well and enter the exponential phase of the growth curve at approximately 30 minutes. Exponential growth begins to slow down after 240 minutes, when the cells enter the stationary phase of the growth curve. For the cells grown in the absence of sugars, no growth is observed during the 6 hours growth period. 0.01 0.1 1 10 0 60 120 180 240 300 360 Abs 540 nm Time (minutes) Growth Curve Control Lactose Glucose Glu + Lac
  • 11.
    Figure 5. Therate of E. coli growth can be observed by analyzing the exponential or log phase of bacterial growth. The lactose (red), glucose (green) and glucose and lactose a) and b) (yellow) E. coli samples have shown exponential growth during the 6-hour experiment, which was measured every 30 minutes using a spectrophotometer at 540 nm. The OD540 values were plotted against time using Excel. For the analyses of E. coli. doubling times in the presence of different energy sources the exponential phase of the growth curve was plotted into individual graphs. The lag phase was determined by identifying the beginning time point of bacterial growth and the time point of entering stationary phase, from the growth curve previously generated. As shown in figure 5, E. coli cells enter the exponential phase of bacterial growth at approximately 90 minutes and enter the stationary phase approximately 330 minutes in the presence of glucose. The exponential phase is observed twice for cells growing in the presence of glucose and lactose over the 6-hour period.
  • 12.
    Doubling times (minutes) Lactose 82 Glucose87 Glu+Lac a) 78 Glu+Lac b) 131 Figure 6. The E. coli culture has doubled in the presence of different variations of sugars. Optimal media enriched with sugars was created in order to allow the E. coli cultures to grow. The exponential growth phase of E. coli growth was analyzed and the doubling interval of time in minutes was determined for each sample. The doubling time (minutes) calculations were generated using Excel. For each sugar sample containing E. coli cells the doubling time of bacterial growth in minutes was calculated and documented into a table. In the case of the cells grown in the presence of both glucose and lactose, the two separate doubling times, a) and b) have been considered and registered in the table individually. As shown in Figure 6, E. coli cells grown in the presence of glucose and lactose have doubled first (a)) every 78 minutes and second (b)) every 131 minutes over the 6-hour period. Figure 7. The b-galactosidase assay. The b-galactosidase assay was carried out on samples taken at different time points: at 60 minutes (blue), at 180 minutes (orange) and at 330 minutes (grey). The samples taken were monitored at OD420 every 120 and 150 minutes, starting at 60 minutes over the 6- hour period. The average miller units were plotted in a bar chart and error bars were added using Excel. In order to determine the average miller units, 3 samples taken in triplicates were collected from the E. coli cells growing in glucose, lactose and glucose and lactose media. The OD420 values were measured and used to calculate the miller units for each set of replicates. The average miller units were determined for each sample at each individual sampling time point. As shown in Figure 7, cells grown in the presence of glucose at any time point have an average miller unit between 300 and 500, 0 200 400 600 800 1000 1200 1400 1600 1800 Glucose+Lactose Glucose Lactose Average Miller Units b-galactosidaseassay Time 60 minutes Time 180 minutes Time 330 minutes
  • 13.
    while the cellsgrown in the presence of lactose at any time point have a higher average miller unit value, between 700 and 1500. Figure 8. E. coli bacterial growth was examined under the microscope. E. coli grown in minimal media with three different variations of sugar were sampled at two time points during the 6-hour period. A fixed smear was prepared and a gram stain was conducted. The slides were observed at x1000 under the microscope. For each sample of E. coli grown in the presence or absence of sugars, a new sample was taken at 30 minutes and 270 minutes during the 6-hour period. Gram stain slides were prepared and analyzed for each sample. As shown in Figure 8, cells grown in the presence of glucose at the 270 minutes time point are considerably numerous in comparison to the 30 minutes time point sample. For the cells grown in the absence of sugar in the control sample, no cell growth is observed between the two time points.
  • 14.
    Discussion The result analysesof the first experiment have shown that the most well E coli cell growth was in the presence of lactose, as shown in Figure 4 and 5, where the growth curve suggests that the exponential growth phase has a uniform doubling time of 82 minutes (Figure 6) at equal intervals in a steady pace for a longer period of time. The reason for this manifestation, is due to the fact that when lactose is present, transcription and gene expression can occur, which allows the synthesis of b- galactosidase, that catalyzes the lactose hydrolysis reaction, resulting in the formation of galactose and glucose (Hardin, Bertoni & Kleinsmith, 2017). This result is also reflected in the b-galactosidase assay (Figure 7) where the average miller units in the lactose sample at all three time points were higher than the Glucose and Glucose+ Lactose samples, suggesting that the higher the miller unit, the higher the OD420 values, meaning that a higher level of b-galactosidase was present in the lactose sample, which can also be justified by the process described above. The fact that E. coli cells prefer glucose as their first energy source (Hardin, Bertoni & Kleinsmith, 2017) can be observed in the Glu+Lac sample (Figure 4 and 5) as the growth curve has showed two log phases of growth when plotted, representing that in the first exponential phase (Figure 5 Glu+Lac a)) cells used glucose first until finished, followed by a slight and short stationary phase which represents the point when E. coli switched to their second preferable energy source, lactose (Figure 5 Glu+Lac b)); this switch point being know as the diauxic point. The lowest growth rate was observed in cells grown in the presence of glucose, since this sugar is known to inhibit the synthesis of cAMP, that can no longer bind to CAP in order to enhance gene expression (Hardin, Bertoni & Kleinsmith, 2017). Another reason for this result, is that in the absence of lactose, the lac repressor binds the lac operator, which blocks RNA-polymerase from gene transcription. Therefore, with glucose present E. coli cells already have their preferred energy source available, so they do not need to activate gene expression (Hardin, Bertoni & Kleinsmith, 2017). After undergoing the preparation of the gram stain slide, E. coli cells present a pink-red color, which demonstrates that safranin has stained the cell, suggesting that E. coli cells are gram-negative, rod-shaped cells. At the 30 minutes time point, cells are present in fewer numbers, which might be because the growth phase is just about to or just began. On the other hand, the 270 point shows that glucose cell density is the highest compared to lactose and lactose&glucose samples, because at 270 minutes E. coli cells are still in the exponential phase, unlike the other samples which are already in stationary phase, beginning cell degradation (Figure 5). Reference List Monod Jacques & Jacob Francois (n.d.) General Conclusions: Teleonomic Mechanisms in Cellular Metabolism, Growth, and Differentiation, Services de Biochimie Cellulaire et de Genetique Microbienne, Institut Pasteur, Paris http://llama.mshri.on.ca/courses/Biophysics205/Papers/Monod_Jacob.pdf Hardin Jeff, Bertoni Paul Gregory & Kleinsmith J. Lewis (2017) Becker`s World of the Cell, 9th ed., Global Edition, Publisher: Pearson
  • 15.
    Madigan T. Michael,Bender S. Kelly, Buckley H. Daniel, Sattley W. Matthew & Stahl A. David (2017) Brock Biology of Microorganisms, Global Edition, 15th ed. Publisher: Pearson pp. 151, 152