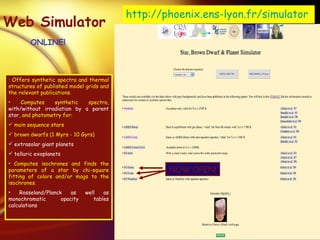
Modeling extrasolar planetary atmospheres discusses techniques for modeling exoplanet atmospheres including:
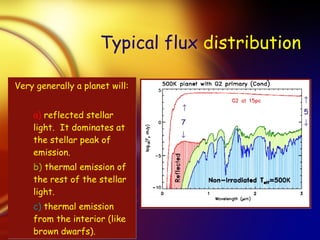
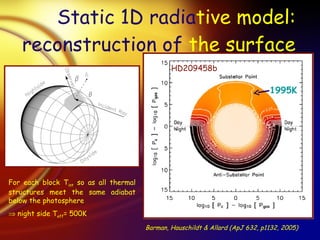
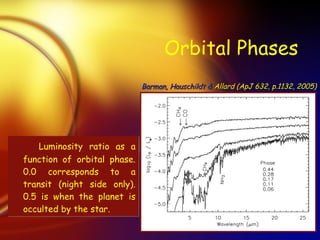
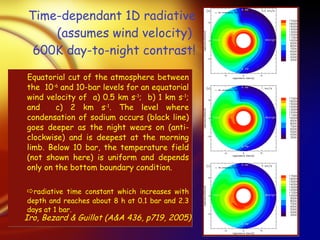
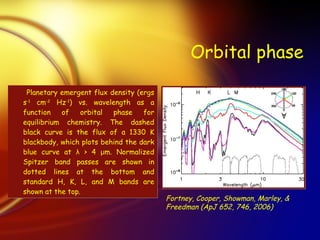
1) 1D radiative models that reconstruct atmospheric temperature structures and simulate thermal emission and reflected light.
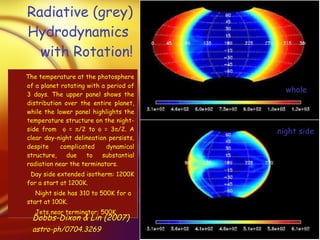
2) 2D and 3D global circulation models that simulate atmospheric winds and temperature distributions driven by stellar irradiation and planetary rotation.
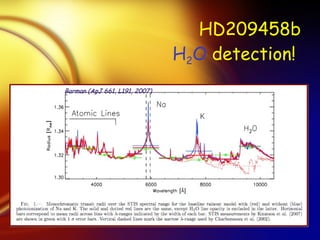
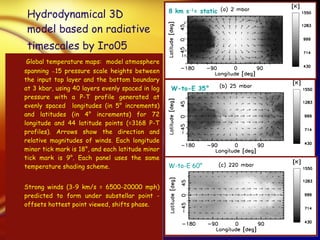
3) Advanced 3D models that combine radiative transfer with hydrodynamics to model atmospheric chemistry, clouds, and winds. These simulations produce synthetic spectra and light curves for comparison to observations.
![Quasi-2D, single layered fluid dynamics [Left] Equatorial and polar views of potential vorticity (a flow tracer) in a specific hot Jupiter model from Cho et al. (2003, 2007). Note the prominent circumpolar vortices formed as a result of potential vorticity conservation. [Right] Corresponding zonally averaged wind profile, characterized by a small number of broad jets (three in this case). Fig 3 of Showman, Menou & Cho (2007) Cho et al. (2003, 2007)](https://image.slidesharecdn.com/brazil2-12665863169894-phpapp02/85/Brazil2-8-320.jpg)


![Lecture Ch 06 [Compatibility Mode] Ast 201](https://cdn.slidesharecdn.com/ss_thumbnails/lecturech06compatibilitymodeast201-100225142109-phpapp01-thumbnail.jpg?width=640&height=640&fit=bounds)