Kv3518641870
•
0 likes•218 views

International Journal of Engineering Research and Applications (IJERA) is an open access online peer reviewed international journal that publishes research and review articles in the fields of Computer Science, Neural Networks, Electrical Engineering, Software Engineering, Information Technology, Mechanical Engineering, Chemical Engineering, Plastic Engineering, Food Technology, Textile Engineering, Nano Technology & science, Power Electronics, Electronics & Communication Engineering, Computational mathematics, Image processing, Civil Engineering, Structural Engineering, Environmental Engineering, VLSI Testing & Low Power VLSI Design etc.

Recommended
Recommended
More Related Content
What's hot
What's hot (19)
Viewers also liked
Viewers also liked (20)
Similar to Kv3518641870
Similar to Kv3518641870 (20)
Recently uploaded
Recently uploaded (20)
Kv3518641870
- 1. Yasir Khalil Ibrahim et al Int. Journal of Engineering Research and Application ISSN : 2248-9622, Vol. 3, Issue 5, Sep-Oct 2013, pp.1864-1870 RESEARCH ARTICLE www.ijera.com OPEN ACCESS A Novel Algorithm To Detect Changes In Surveillance Video Haitham Kareem Ali (**), Yasir Khalil Ibrahim(*), (*) Faculty of Engineering, Jarash University, Jarash, Jordan. (**)Slemani Polytechnic University, Slemani College of Technical Engineering, Communication & Electronics Department, Slemani, Kurdistan Region , Iraq. Abstract Tracking changes in an acquired surveillance video is essentially impractical task for the human due to the complexity of the monitoring process, specifically for a long-time period. Finding changes in a sequence of images captured by surveillance video system is a complicated task for the human and it is complicated by fitting it to a classification model. Given a sequence of images, we are concerned with automatically detecting the occurrence of changes in the given sequence of images. In this paper, the problem of detecting changes in digital images captured by surveillance video system is explored. A novel algorithm, involving correlation coefficients and eigenstructurebased Mosaab distance measure, is suggested. The proposed algorithm is a mobile-based application, that can be used to process pixel-based data (i.e., sequence of images) at camera locations and send only real-time numeric results to client's mobile device(s) . Therefore, the aim of proposed algorithm is to analyize and eliminate the amount of pixel-based data to be sent via the network. Consequently, the received real time numeric results can be visualized using an application software installed in client's mobile device. The main function of the mobile-based application software is to illustrate the received results as a real-time graph. The proposed algorithm shows effectiveness in eliminating the flow of raw pixel-based data in the network. Key words: Mosaab-distance measure, correlation coefficient, surveillance video system. I. INTRODUCTION Normally, the surveillance video system produces huge amount of data that requires analysis. Usually, the main analysis task, which is monitoring changes in a sequence of images (i.e., real time analysis), is tackled by human. Tracking changes in the acquired video is essentially impractical task for the human since it is a long-term monitoring process. In any scene, there is a number of changes that take place over the time. We assume that the input images of a scene are captured by surveillance video system with timing setup as a discrete variable. An entity can be either an object or human (i.e., individual), in this context, if an entity is not a human, then it is considered as an object. An activity is defined as an action that can happen to an entity at a particular point in time. When an activity is performed on an entity it becomes an event. Thus, implicitly, we are looking for the occurrences of an event or events in a particular scene. For example, remove is an activity, when it is performed on a book (i.e., entity) it become an event, which is: the book is removed from the table (i.e., removed from a particular scene). The state of any scene is considered as a function of time. During any period of time, a scene is said to be static if there is zero event occurred, otherwise a scene is said to be dynamic. Finding changes sequentially in a sequence of images captured by surveillance video system is complicated task for the human and it is complicated by fitting it to a classification model. Our work focuses exclusively on the following: www.ijera.com Given a sequence of images captured for a particular scene, we are concerned with autodetecting the occurrence of changes in the given sequence of images and the change occurs when one activity or a set of activates are performed on an entity or a set of entities in a particular scene, under the assumptions: (i) lack of information about those activities (i.e., no prior knowledge or insufficient labeled datasets that can be used for training) and (ii) the sets of activities and entities are previously unknown. Moreover, the detection possess must be performed locally at camera locations, to eliminate the amount of pixel-based data to be sent via the network to mobile device(s) of a client. In this study, we adding another task to the surveillance system, which is the analysis of a sequence of images captured by surveillance system installed in highly sensitive areas (e.g., offices of V.I.P.s). The advantage behind adding this task is to detect activities (i.e., changes) in a sequence of images locally at camera locations and instead of transmitting huge amount of pixel-based data to the mobile device(s) of a client via the network, the system sends only the activity detection results. In this way, we can eliminate the amount of pixel-based data to be transmitted from camera locations to the mobile device(s) of a client via the network. Sending only few real numbers (i.e., the detection results) to the mobile device (s) of a client via the network will minimize the potential threats that result from sending pixel-based data to the mobile device(s) of a client via the network. 1864 | P a g e
- 2. Yasir Khalil Ibrahim et al Int. Journal of Engineering Research and Application ISSN : 2248-9622, Vol. 3, Issue 5, Sep-Oct 2013, pp.01-05 In this paper, we briefly survey existing approaches to the problem, outline the method we have implemented and present our results and ideas for future work. The structure of this study is summarized as follows. In Section 2, which it consists of three subsections, we present materials and methods. In subsection 2.1, we present related work. In subsection 2.2, we present the statement of the problem. In subsection 2.2, we present the propose algorithm. In Section 3, we present the experimentation and results. Finally, conclusions are presented in Section 4. II. MATERIALS AND METHODS 2.1 Related work: The main stages of any pattern recognition system are: (i) feature extraction stage and (ii) classification stage. There two main types of classification: Either (i) supervised classification or (ii) unsupervised classification Jain (2000). Extracting information from data is an essential step for pattern recognition systems and the validity of the extracted information has an impact on the classification stage. Machine detection, thus, can be used to validate the human detection in order to increase accuracy. Replacing eye-based detection by machine-based detection will often be the first step in building an auto-detection system that has the capability to analyze a sequence of images captured by a surveillance system. As we mentioned in the previous section, there are two components that arise in this context: (i) a set of activities and (ii) a set of entities. The composition of any dynamic scene is result from the interaction between those two components (i.e., these two sets). An event is an activity that happens to an entity or set of entities at a particular point in time. An event is categorized as either normal event or abnormal event (i.e., anomaly). An extensive work has been done in the area of analyzing video sequences. However, there exists a few challenges that must be considered, for example: Detecting activities in surveillance video sequences at camera locations and send only numeric results as a real-time chart to the mobile device(s) of a client. Detecting activities in surveillance video sequences is well known problem in several research areas and it is under the focus of different research communities such as: Pattern Recognition, Computer Vision, Artificial Intelligence and Soft Computing, Pattern Analysis and Machine Intelligence and Computational Intelligence and Data Mining. Precisely, activities in a scene are classified as either (i) normal activates or (i) abnormal activities. They are two approaches that can be used to solve this problem: Either (i) supervised classification or (ii) unsupervised classification. The data availability for the considered activities is the key point in deciding which approach should be used to solve this problem. Since we are www.ijera.com www.ijera.com classifying each activity into two classes (i.e., either change class or no-change class), then a distancebased classifiers are required. Activities are related to an entity (e.g., human(s), object(s)) and either performed by one entity or by a group of entities (e.g., motion of one person or group of people in a scene, moving object from one position to another). We just presented the contributions achieved by researchers in the field in the recent years, however, the goal of this paper, which we stated in the previous section (i.e., paper statement) is differ from the goals of the contributions that we just reviewed in this section. In this study, the main challenge to overcome is to detect changes defined by a set of activities, those activities are either associated with an entity or a set of entities (e.g., object(s) or human (s)) in a scene, under the following assumptions: (i) lack of information about those activities (i.e., no prior knowledge or insufficient labeled datasets that can be used for training), (iii) the sets of activities and entities are previously unknown and (iii) to eliminate the amount of pixel-based data to be transmitted from camera locations to the mobile device(s) of a client via the network. In this section, we presented the related work. In the next section, we present the statement of the problem. 2.2 The statement of the problem: The problem under investigation is a well known problem in image analysis area. It is the problem of detecting changes in a sequence of images acquired by a surveillance system. Mathematically speaking, suppose that we have a surveillance system that produces a huge amount of data, where the data are represented by images. Without loss of generality, suppose that the system produces images captured for a highly sensitive site and the problems that arise in this context is to monitor those images and track the changes by human efficiently for a long-term period and send results to mobile device(s) of a client. The solution for this problem can be achieved by replacing the human-based monitoring by machine-based monitoring and thus a pattern recognition system is required since the changes in those images are considered as patterns. The core of any pattern recognition system is the recognizer or the algorithm that can used to recognize those changes over the time. The time is discrete since those images captured at discrete points in time: t1, t2, t3, ..., tk. Hence, we assume that we have a sequence of k images: Image1, Image2,..., Imagek captured at t1, t2, t3,..., tk respectively. The data under consideration are images or pixel-based data and mapping these images from the data space into the real-valued feature space is an essential step to reduce the mount of input data to be processed by the pattern recognition system in order to detect changes in these images sequentially. 1865 | P a g e
- 3. Yasir Khalil Ibrahim et al Int. Journal of Engineering Research and Application ISSN : 2248-9622, Vol. 3, Issue 5, Sep-Oct 2013, pp.01-05 www.ijera.com Fig. 1: The statement of the problem Fig. 2: The proposed decomposition process performed on two successive images captured by a surveillance system Instead of detecting changes in these images embedded in the data space, which can be achieved by measuring the distance between successive images in the sequence, detecting changes is performed in the feature space by measuring the distance between the representation of successive images embedded in the feature space (Fig. 1). In this section, we presented the statement of the problem. In the next section, we present the proposed algorithm. 2.3 The proposed algorithm: In this paper, as we mentioned, our goal is to detect changes in a sequence of images Image1, Image2,..., Imagek of size m × n captured by surveillance system(Fig 2). Those www.ijera.com changes are defined by a set of activities, those activities are either associated with an entity or a set of entities (e.g., object(s) or human(s)) in a scene, under the following assumptions: (i) lack of information about those activities (i.e., no prior knowledge or insufficient labeled datasets that can be used for training) and (ii) the sets of activities and entities are previously unknown. As we know, algorithms for monitoring changes in a sequence of images is mainly based on global features of images (e.g., global correlation between successive images) often yield many cases of false detection. In addition, the performance of threshold value-based algorithms is based on the accuracy of estimating the threshold values and changing those parameters (i.e., threshold 1866 | P a g e
- 4. Yasir Khalil Ibrahim et al Int. Journal of Engineering Research and Application ISSN : 2248-9622, Vol. 3, Issue 5, Sep-Oct 2013, pp.01-05 values) to decrease the rate of false detection may increases the rate of false detection. For the above reasons, we build our algorithm (feature extractor and distance-based classifier) by consider the following concepts:(i) statistical-based local features (e.g., the correlation coefficient between partitions of the image), (ii) eigenstructure based Mosaab distance measure (it is an inverse-free ℜp×p-based distance measure that can works with singular matrices and it require less computation compared with Mahalanobis distance), (iii) high dimensional-based representation (e.g., a representation embedded in ℜp×p). Precisely, the proposed classifier is a distance-based classifier which uses the statistical-based local features to perform the required task. As we mentioned earlier in this paper, the data under consideration are images, in fact, it is pixel-based data, which is a huge data. To reduce the amount of data to be processed, it is necessary to map those images from the data space (i.e., pixel-based) to the real-value feature space (i.e., real-valued based) Thus, we have to define a new representation to those images under consideration. The representation must be embedded in ℜp×p since eigenstructure-based Mosaab distance measure is considered. The working mechanism of the proposed algorithm can be summarized follows. First, we partitioned each image into four same size sub-images. Then, the correlation coefficients between those sub-images are computed (i.e., 6 correlation coefficients). Let (i) corr (Imagei, j Imageir ) (where, j = 1, jr 2,..., 4 and r = j + 1, 2,..., 4) be the correlation coefficient between the image partitions (i.e., subimages) Imageij and Imageir of Imagei. For each Imagei (i = 1, 2,…,k), the algorithm computes (i) (i) (i) (i) (i) 11 , 12 , 13 , 14 , (i) ,and 34 , where those coefficient 23 are real values between 0 and 1. Daoud and Kremer, (Daoud and Kremer, 2009; Daoud, 2010; Daoud and Kremer, 2006) proposed a new measure that is defined in terms of variations to capture the deviations between two sets of biosequences or between a pair of sequences. The metric is built using the objective function: (1) Maximizing the above objective function leads to the following metric: (2) where, 1 is the largest eigenvector associated with 1, the largest eigenvalue of the matrix (Ωi-Ωj) and: Var( 'X(k) ) E( 'X(k) X(k) ' ) 'E(X(k) X(k) ' ) ' i for k i, j www.ijera.com (3) www.ijera.com Definition 1: Mosaab distance measure (Daoud and Kremer, 2009; Daoud, 2010; Daoud and Kremer, 2006) Dij (1):ℜp×p×ℜp×p ⇒ ℜ+ is a variance-covariance structure-based distance measure that measures the distance between two variance-covariance structures represented by the variance-covariance matrices Ωi and Ωj. The proposed distance measure can measure the deviation in variations of the same feature vector being measured on two datasets (e.g. objects, images, sub-images, sequences, set of sequences etc...). The deviation in variations is explained by the eigenstructure of the difference between two variance covariance structures, where each variance covariance structure represents a dataset(e.g. object, image, subimage, sequence, set of sequence etc...). The eigenstructure is defined in terms of the largest eigen-value (i.e. max, see equations 1-2) of the difference between two variance-covariance structures. It is clear that Mosaab distance measure is a variance-covariance structure-based distance measure and it is a matrix-based distance measure (i.e., ℜp×p×ℜp×p ⇒ ℜ+). Thus the representation of images must be embedded in ℜp×p (i.e., feature space). Since for each Imagei (i = 1, 2,…. k), the representation (i) (where j = 1, 2,..., 4 and r = j + 1, 2,..., 4), jr thus, for each Imagei (i = 1, 2,…, k) we construct a diagonal matrix (i) (i) (i) (i) i diag(11 , 12 , 13 , 14 , (i) , (i) and (i) 66 ) . Since 23 24 34 the matrix Σi is neither variance-covariance matrix nor correlation matrix, we redefine Mosaab distance measure as follows. Definition 2: The modified form of Mosaab distance measure i (,): ℜp×p×ℜp×p ⇒ ℜ+ is defined as: ' i (i , (i 1) ) | 1 (i (i 1) )1 || 1 | 0 (4) A distance measure that measures the distance between two matrices Σi and Σ(i+1) that represent Imagei and Image(i+1) respectively, where 1 is the eigenvector associated with the largest eigenvalues 1 of the matrix (Σi-Σ(i+1)) and: (i) (i) (i) i diag (11 , 12 ,..., 34 ) (i) 11 0 (i) 0 12 M M 0 0 L L O K 0 0 M (i) 34 (5) Finally, the proposed algorithm (see Algorithm 1) produces a sequence of eigenvalues 1, 2,..., (k-1) that represent the sequential changes in Image1, Image2,..., Imagek respectively. In this section, we presented a novel algorithm to detect the changes in a sequence of images captured by a surveillance system. In the next section, we present the experimentation and results. 1867 | P a g e
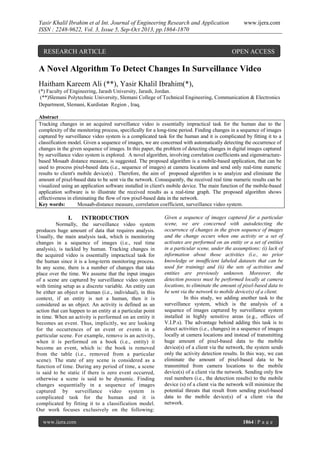
- 5. Yasir Khalil Ibrahim et al Int. Journal of Engineering Research and Application ISSN : 2248-9622, Vol. 3, Issue 5, Sep-Oct 2013, pp.01-05 III. RESULTS and DISCUSSION In this section, we used a sequence of 100 images captured by a surveillance system to evaluate the performance of the proposed algorithm and a discussion is given below. A sample output from Matlab code, which shows the partition process, is given in Fig. 3. The results of the proposed algorithm are shown in Fig. 8. In Fig. 8, the horizontal axis represents the index of the distance value i and the vertical axis represents the value of the modified Mosaab distance measure. The solid points of the red curve represent the distance values measured in the feature space between successive images in the sequence of 100 images. There are few peak values clearly appeared at i = 3, 8, 12, 31, 36, 56, 57, 84, 86 and 89. The distance values are: 3 = 0.371, 8 = 0.8618, 12 = 0.3167, 31 = 0.3199, 36 = 0.3084, 56 = 0.3494, 57 = 0.4578, 84 = 0.3572, 86 = 0.5412, and 89 = 0.3488. Algorithm 1: Detecting Changes Sequentially in a Sequence of Images input : Given a sequence of images Image1, Image2,..., Imagek of size m × n captured by surveillance system. output: A sequence of eigenvalues 1, 2,..., (k-1) that represent the sequential changes in Image1, Image2,..., Imagek. 1 for i ← 1 to k do 2 Partition Imagei into four same size sub-images (i.e. four disjoint partitions). Let Imagei1, Imagei2, Imagei3 and Imagei4 be the four partitions of Imagei respectively. Partition Imagei+1 into four same size sub-images (i.e. four disjoint partitions). Let Imagei1, Image(i+1)2, Image(i+1)3 and Image(i+1)4 be the four partitions of Imagei+1 respectively. Let corr(,) be the correlation coefficient. 3 for j ← 1 to 4 do 4 for r ← j + 1 to 4 do 5 Compute corr(Imageij ; Imageir) 6 Compute corr(Image(i+1)j ; Image(i+1)r) end end 9 Construct the diagonal matrix Σi = diag( corr(Imagei1; Imagei2), corr (Imagei1;Imagei3), corr(Imagei1, Imagei4), corr (Imagei2; Imagei3), corr(Imagei2, Imagei4), corr (Imagei3; Imagei4)) 10 Construct the diagonal matrix Σ(i+1) = diag(corr(Image(i+1)1; Image(i+1)2), corr(Image(i+1)1; Image(i+1)3), corr(Image(i+1)1; Image(i+1)4), corr(Image(i+1)2; Image(i+1)3), corr(Image(i+1)2; Image(i+1)4), corr(Image(i+1)3; Image(i+1)4)) www.ijera.com γ www.ijera.com 11 Compute λi = Abs(γ' (Σi - Σ(i+1)) γ), where is the largest eigenvector of the matrix (Σi-Σ(i+1)). end For example, the distance value 3 = 0.371 is estimated from comparing the images 3 and 4, and the distance value 8 = 0.8618 is estimated from comparing the images 8 and 9 (see Figure 4). Moreover, the distance value 84 = 0.3572 is estimated from comparing the images 84 and 85, and the distance value 89 = 0.3488 is estimated from comparing the images 89 and 90 (see Fig. 5). From Figures 4 and 5 , our conclusions (i.e. human eyes) coincided with the results of the proposed algorithm, but for a long-term period, it is harder for the human eyes to recognize such changes (i.e., in case of longterm monitoring process). However, there are other cases where the change is unrecognizable by the human eyes due to the speed of change or due to the nature of change (e.g. tiny changes), but it is easily can be recognized by the proposed algorithm. Those cases are illustrated in Figure 6. Consider the four successive images: 85, 86, 87 and 88. The discussions of those cases are given below. Fig. 3: A sample output from matlab code shows the partition process Fig. 4: Peak values 3 = 0.371 (the corresponding images: 3 and 4) 8 = 0.8618 (the corresponding images: 8 and 9) 1868 | P a g e
- 6. Yasir Khalil Ibrahim et al Int. Journal of Engineering Research and Application ISSN : 2248-9622, Vol. 3, Issue 5, Sep-Oct 2013, pp.01-05 Fig. 5: Peak values 84 = 0.3572 (the corresponding images: 84 and 85) and 89 = 0.3488 (the corresponding images: 89 and 90) Fig. 7: www.ijera.com Two images represent: (i) Light switched ON, and (ii) Light switched OFF Case 1: The main difference between image 85 and image 86 is the position of object1. Object1 moved from one position to another. This change is efficiently detected by the proposed algorithm and the distance value is 85 = 0.1835 (Fig. 6). Case 2: The main differences between image 86 and image 87 are: (i) object1 removed, (ii) object2 moved from one position to another, (iiii) object3 removed and (iv) objects4 added to the scene (Fig. 6). Those changes are efficiently detected by the proposed algorithm and the distance value is 86 = 0.5412. Since the number of changes occurred in this case is more than the number of changes occurred in case 1, then the distance value 86 is greater than the distance value 85. Fig. 6: Four successive images captured by the surveillance system Fig. 8: The results of the proposed algorithm used for testing a sequence of 100 images captured by surveillance system Case 3: There is no main difference between image 87 and image 88, thus, the distance between the two images has the value 87 = 0.0866, which is a very small value compared with distance values 85 and 86 (Fig. 6). There are two points arise here: (i) the quality of the digital camera used in this experiment www.ijera.com and (ii) the small hidden changes that are undetectable by human eyes which they may cause this problem (i.e., the distance value is not equal to 0). There is another problem that we should mention in this section, it is the visibility problem. The 1869 | P a g e
- 7. Yasir Khalil Ibrahim et al Int. Journal of Engineering Research and Application ISSN : 2248-9622, Vol. 3, Issue 5, Sep-Oct 2013, pp.01-05 www.ijera.com problem is illustrated in Fig. 7. When the lights are switched off the visibility is almost zero. However, this case is perfectly detected by the proposed algorithm as a change in lights intensity, but probably the scene details remain unchanged. In this case, advanced equipments are needed to handle such problem, which is beyond the scope of this paper. Finally, in this section, we presented the experimentation and results of the proposed algorithm. In the next section, conclusions are presented. IV. CONCLUSION While the results of the proposed algorithm were generally quite good, there are several potential areas for future improvement: instead of performing 4-subimages decomposition process on images, one may perform 8-subimages decomposition process on images which might be beneficial. In particular, we concluded that the proposed algorithm is useful for detecting changes in a sequence of images locally at camera location and send real-time numeric results to mobile device(s). In other words, the proposed algorithm showed effectiveness in eliminating the flow of raw pixel-based data in the network and minimizing the potential threats that result from sending highly sensitive pixel-based data to the mobile device(s). REFERENCES [1] [2] [3] [4] Daoud and Kremer 2006. Daoud, M. and S.C. Kremer. Neural and statistical classification to families of bio-sequences. International Joint Conference on Neural Networks, 2006 (IJCNN ’06), pp: 699-704, 2006.http://dx.doi.org/10.1109/IJCNN.2006. 246752 Daoud and Kremer 2009. Daoud, M. and S.C. Kremer. A new distance distribution paradigm to detect the variability of the influenza-A virus in high dimensional spaces, Applications of Machine Learning in Bioinformatics Workshop, IEEE International Conference on Bioinformatics & Biomedicine (IEEE BIBM 09), November 1-4, 2009, Washington D.C. Daoud, 2010. Daoud, M.. A new variancecovariance structure-based statistical pattern recognition system for solving the sequenceset proximity problem under the homologyfree assumption. PhD thesis, 2010, ISBN: 9780494678268. Jain, 2000. Jain, Duin and Mao Anil K. Jain, Robert P. W. Duin and Jianchang Mao. Statistical pattern recognition: A review. IEEE Transactions Pattern Analysis Machine Intell., 22: 4-37, 2000. http://doi.ieeecomputersociety.org/10.1109/3 4.824819 www.ijera.com 1870 | P a g e