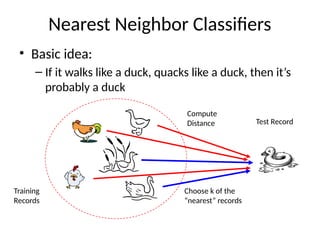
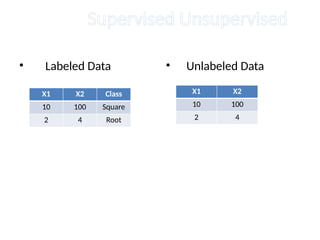
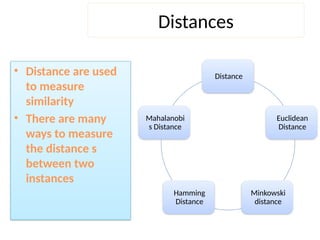
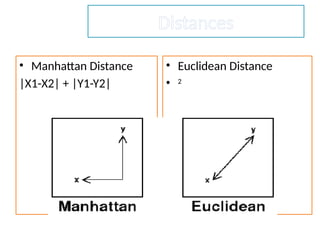
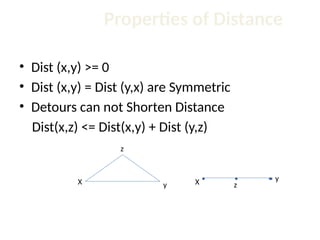
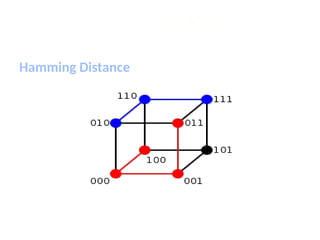
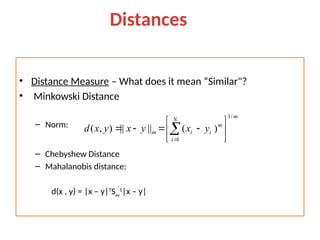
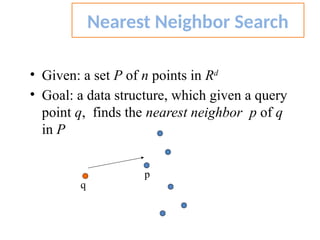
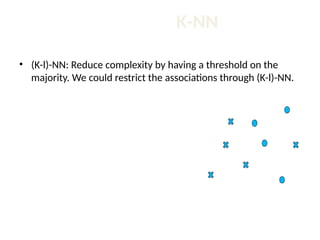
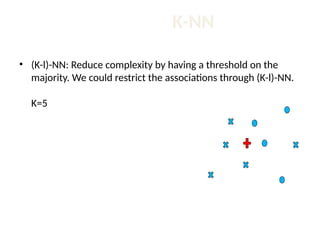
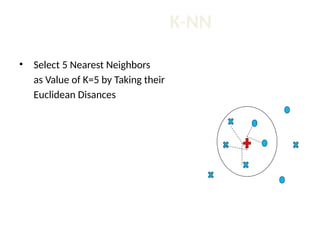
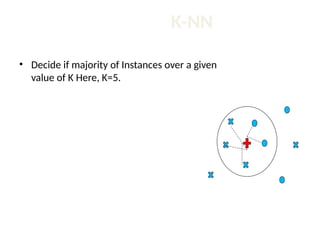
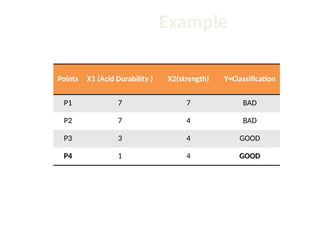
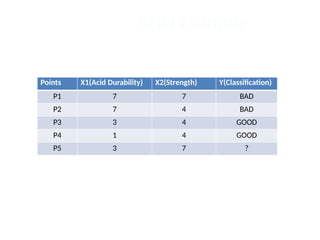
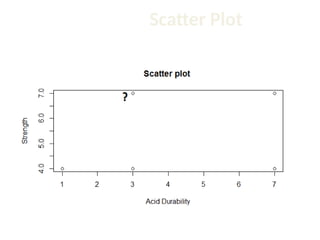
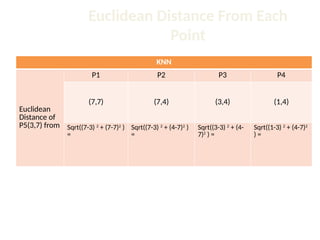
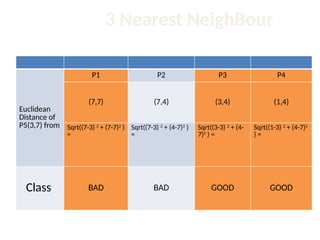
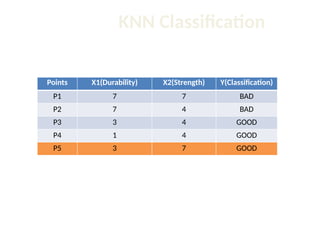
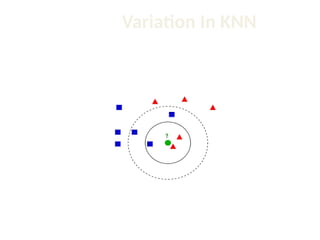
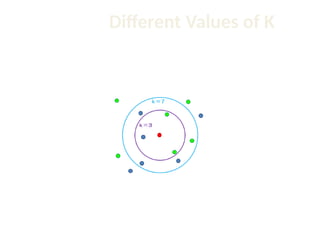
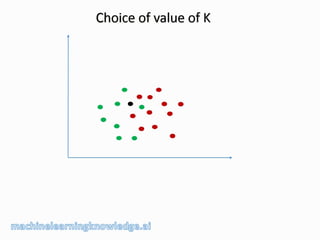
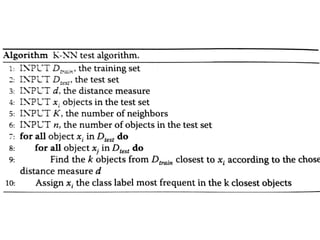
Classification Using K-Nearest
Neighbor
Nearest Neighbor Classifiers
• Basic idea:
– If it walks like a duck, quacks like a duck, then it’s
probably a duck
Training
Records
Test Record
Compute
Distance
Choose k of the
“nearest” records
Supervised Unsupervised
• Labeled Data • Unlabeled Data
X1 X2 Class
10 100 Square
2 4 Root
X1 X2
10 100
2 4
Distances
Distance
Euclidean
Distance
Minkowski
distance
Hamming
Distance
Mahalanobi
s Distance
• Distance are used
to measure
similarity
• There are many
ways to measure
the distance s
between two
instances
Distances
• Manhattan Distance
|X1-X2| + |Y1-Y2|
• Euclidean Distance
• 2
Properties of Distance
• Dist (x,y) >= 0
• Dist (x,y) = Dist (y,x) are Symmetric
• Detours can not Shorten Distance
Dist(x,z) <= Dist(x,y) + Dist (y,z)
X y
z
X y
z
Distance
Hamming Distance
• Distance Measure – What does it mean “Similar"?
• Minkowski Distance
– Norm:
– Chebyshew Distance
– Mahalanobis distance:
d(x , y) = |x – y|T
Sxy
1
|x – y|
m
N
i
m
i
i
m y
x
y
x
y
x
d
/
1
1
)
(
||
||
)
,
( 








 

Distances Measure
Nearest Neighbor and Exemplar
Exemplar
• Arithmetic Mean
• Geometric Mean
• Medoid
• Centroid
Arithmetic Mean
Geometric Mean
A term between two terms of a geometric sequence is the geometric
mean of the two terms.
Example: In the geometric sequence 4, 20, 100, ....(with a factor of 5), 20
is the geometric mean of 4 and 100.
• Given: a set P of n points in Rd
• Goal: a data structure, which given a query
point q, finds the nearest neighbor p of q
in P
Nearest Neighbor Search
q
p
K-NN
• (K-l)-NN: Reduce complexity by having a threshold on the
majority. We could restrict the associations through (K-l)-NN.
K-NN
• (K-l)-NN: Reduce complexity by having a threshold on the
majority. We could restrict the associations through (K-l)-NN.
K=5
K-NN
• Select 5 Nearest Neighbors
as Value of K=5 by Taking their
Euclidean Disances
K-NN
• Decide if majority of Instances over a given
value of K Here, K=5.
Example
Points X1 (Acid Durability ) X2(strength) Y=Classification
P1 7 7 BAD
P2 7 4 BAD
P3 3 4 GOOD
P4 1 4 GOOD
KNN Example
Points X1(Acid Durability) X2(Strength) Y(Classification)
P1 7 7 BAD
P2 7 4 BAD
P3 3 4 GOOD
P4 1 4 GOOD
P5 3 7 ?
Scatter Plot
Euclidean Distance From Each
Point
KNN
Euclidean
Distance of
P5(3,7) from
P1 P2 P3 P4
(7,7) (7,4) (3,4) (1,4)
Sqrt((7-3) 2
+ (7-7)2
)
=
Sqrt((7-3) 2
+ (4-7)2
)
=
Sqrt((3-3) 2
+ (4-
7)2
) =
Sqrt((1-3) 2
+ (4-7)2
) =
3 Nearest NeighBour
Euclidean
Distance of
P5(3,7) from
P1 P2 P3 P4
(7,7) (7,4) (3,4) (1,4)
Sqrt((7-3) 2
+ (7-7)2
)
=
Sqrt((7-3) 2
+ (4-7)2
)
=
Sqrt((3-3) 2
+ (4-
7)2
) =
Sqrt((1-3) 2
+ (4-7)2
) =
Class BAD BAD GOOD GOOD
KNN Classification
Points X1(Durability) X2(Strength) Y(Classification)
P1 7 7 BAD
P2 7 4 BAD
P3 3 4 GOOD
P4 1 4 GOOD
P5 3 7 GOOD
Variation In KNN
Different Values of K
References
• Machine Learning : The Art and Science of Algorithms that Make Sense of Data By
Peter Flach
• A presentation on KNN Algorithm : West Virginia University , Published on May 22,
2015
Thanks

KNN Algorithm Machine_Learning_KNN_Presentation.pptx