Recommended
PDF
Dr. Shivu___Machine Learning_Module 2pdf
PPTX
Most of the players scored 40+ runs in a match and only a few
PPTX
Foundational Statistics for Data Analysis.pptx
PPTX
parameter Estimation and effect size
PPTX
Different Statistical Techniques - Practical Research 1
PPT
PDF
How to learn Correlation and Regression for JEE Main 2015
PPTX
Chapter_03 Multiple Random Variables.pptx
PPT
Slideset Simple Linear Regression models.ppt
PPTX
COVARIANCE IN PROBABILITY
PPTX
PPTX
Dr Amita Marwha- Covariance and Correlation
PPT
Data analysis test for association BY Prof Sachin Udepurkar
PPTX
MODULE-3edited.pptx machine learning modulk
PPTX
MODULE-2.pptx machine learning notes for vtu 6th sem cse
PDF
Covariance and correlation(Dereje JIMA)
PDF
PPTX
9_Different_Statistical_Techniques.pptx
PDF
03-Statistics for Data Analysis.pptx.pdf
PPT
Coefficient and Correlation techniques.ppt
PDF
PPT
PDF
Analyzing Relations between Data Set - Part I
PDF
MSC III_Research Methodology and Statistics_Inferrential ststistics.pdf
PDF
qasimsir-151129033239-lva1-app6bbbbbbbb892.pdf
PDF
PPTX
PPT
PPT
k-mean-clustering algorithm for machine learning
PDF
Data-Quality-and-Preprocessing-Essential-Concepts-for-Engineering.pdf
More Related Content
PDF
Dr. Shivu___Machine Learning_Module 2pdf
PPTX
Most of the players scored 40+ runs in a match and only a few
PPTX
Foundational Statistics for Data Analysis.pptx
PPTX
parameter Estimation and effect size
PPTX
Different Statistical Techniques - Practical Research 1
PPT
PDF
How to learn Correlation and Regression for JEE Main 2015
PPTX
Chapter_03 Multiple Random Variables.pptx
Similar to Bivariate Analysis Statistics pesentation.pptx
PPT
Slideset Simple Linear Regression models.ppt
PPTX
COVARIANCE IN PROBABILITY
PPTX
PPTX
Dr Amita Marwha- Covariance and Correlation
PPT
Data analysis test for association BY Prof Sachin Udepurkar
PPTX
MODULE-3edited.pptx machine learning modulk
PPTX
MODULE-2.pptx machine learning notes for vtu 6th sem cse
PDF
Covariance and correlation(Dereje JIMA)
PDF
PPTX
9_Different_Statistical_Techniques.pptx
PDF
03-Statistics for Data Analysis.pptx.pdf
PPT
Coefficient and Correlation techniques.ppt
PDF
PPT
PDF
Analyzing Relations between Data Set - Part I
PDF
MSC III_Research Methodology and Statistics_Inferrential ststistics.pdf
PDF
qasimsir-151129033239-lva1-app6bbbbbbbb892.pdf
PDF
PPTX
PPT
More from vipulkondekar
PPT
k-mean-clustering algorithm for machine learning
PDF
Data-Quality-and-Preprocessing-Essential-Concepts-for-Engineering.pdf
PPTX
Machine Learning Presentation for Engineering
PPTX
Backpropagation algorithm in Neural Network
PPT
Deep Learning approach in Machine learning
PPTX
Decision Tree machine learning algorithms
PPT
Artificial Neural Network and Machine Learning
PPTX
AO Star Algorithm in Artificial Intellligence
PPTX
Free-Counselling-and-Admission-Facilitation-at-WIT-Campus.pptx
PPTX
Introduction to prototyping in developing the products
PPTX
Documents-Required-for- Engineering Admissions.pptx
PPTX
Exploring-Scholarship-Opportunities.pptx
PPT
Microcontroller Timer Counter Modules and applications
PPTX
Avishkar competition presentation template
PPTX
Artificial Intelligence Problem Slaving PPT
PPTX
Microcontroller Introduction and the various features
PPTX
Min Max Algorithm in Artificial Intelligence
PPT
Microcontroller 8051 timer and counter module
PPTX
A Star Algorithm in Artificial intelligence
PPT
Microcontroller 8051 Timer Counter Interrrupt
Recently uploaded
PPTX
Data Science with R Final yrUnit II.pptx
PDF
Modeltomodel_Transformation_with_ATL (1).pdf
PPTX
The Complete Guide to Energy Audits_ Unlocking Savings, Sustainability, and P...
PDF
Sensor & Instrument MODULE 3 REVISION PPT.pdf
PPTX
Introduction to Civil Engineering-Defination, Branches of civil engineering a...
PDF
Nostr : A protocol for freedom of speech
PPTX
Optimizing Operations: Key Elements of a Successful Plant Maintenance Plan — ...
PPTX
Network intrusion detection system .pptx
PPTX
Aix-Marseille Université Diploma
PPT
Intro AI DBATU.ppt ppt useful engineering
PPTX
Network Security v1.0 - Module 2.pptx
PPTX
Industrial Plant Safety – Comprehensive Guide for Workplace Safety & Risk Pre...
PPTX
Preventive Maintenance Program for Compressors – Complete Guide
PPTX
Fiber reinforced concrete (FRC) is a composite material made from Portland ce...
PPTX
Plant Bio-additives (2).pptxA plant bioadditive is a functional substance der...
PPTX
A7383 3D Printing UNIT-III : 3D printing techniques
PDF
Paralleling of Alternators - First Edition - 2022
PPTX
KTU 2024 SCHEME -PEMET 413 COMPOSITE MATERIALS MODULE 1 LECTURE 1.pptx
DOCX
Project Management(BOE 070) notes Unite 4 AKTU
PPTX
Industrial Smart Ventilation system.pptx
Bivariate Analysis Statistics pesentation.pptx 1. 2. Concept of Bivariate Statistics
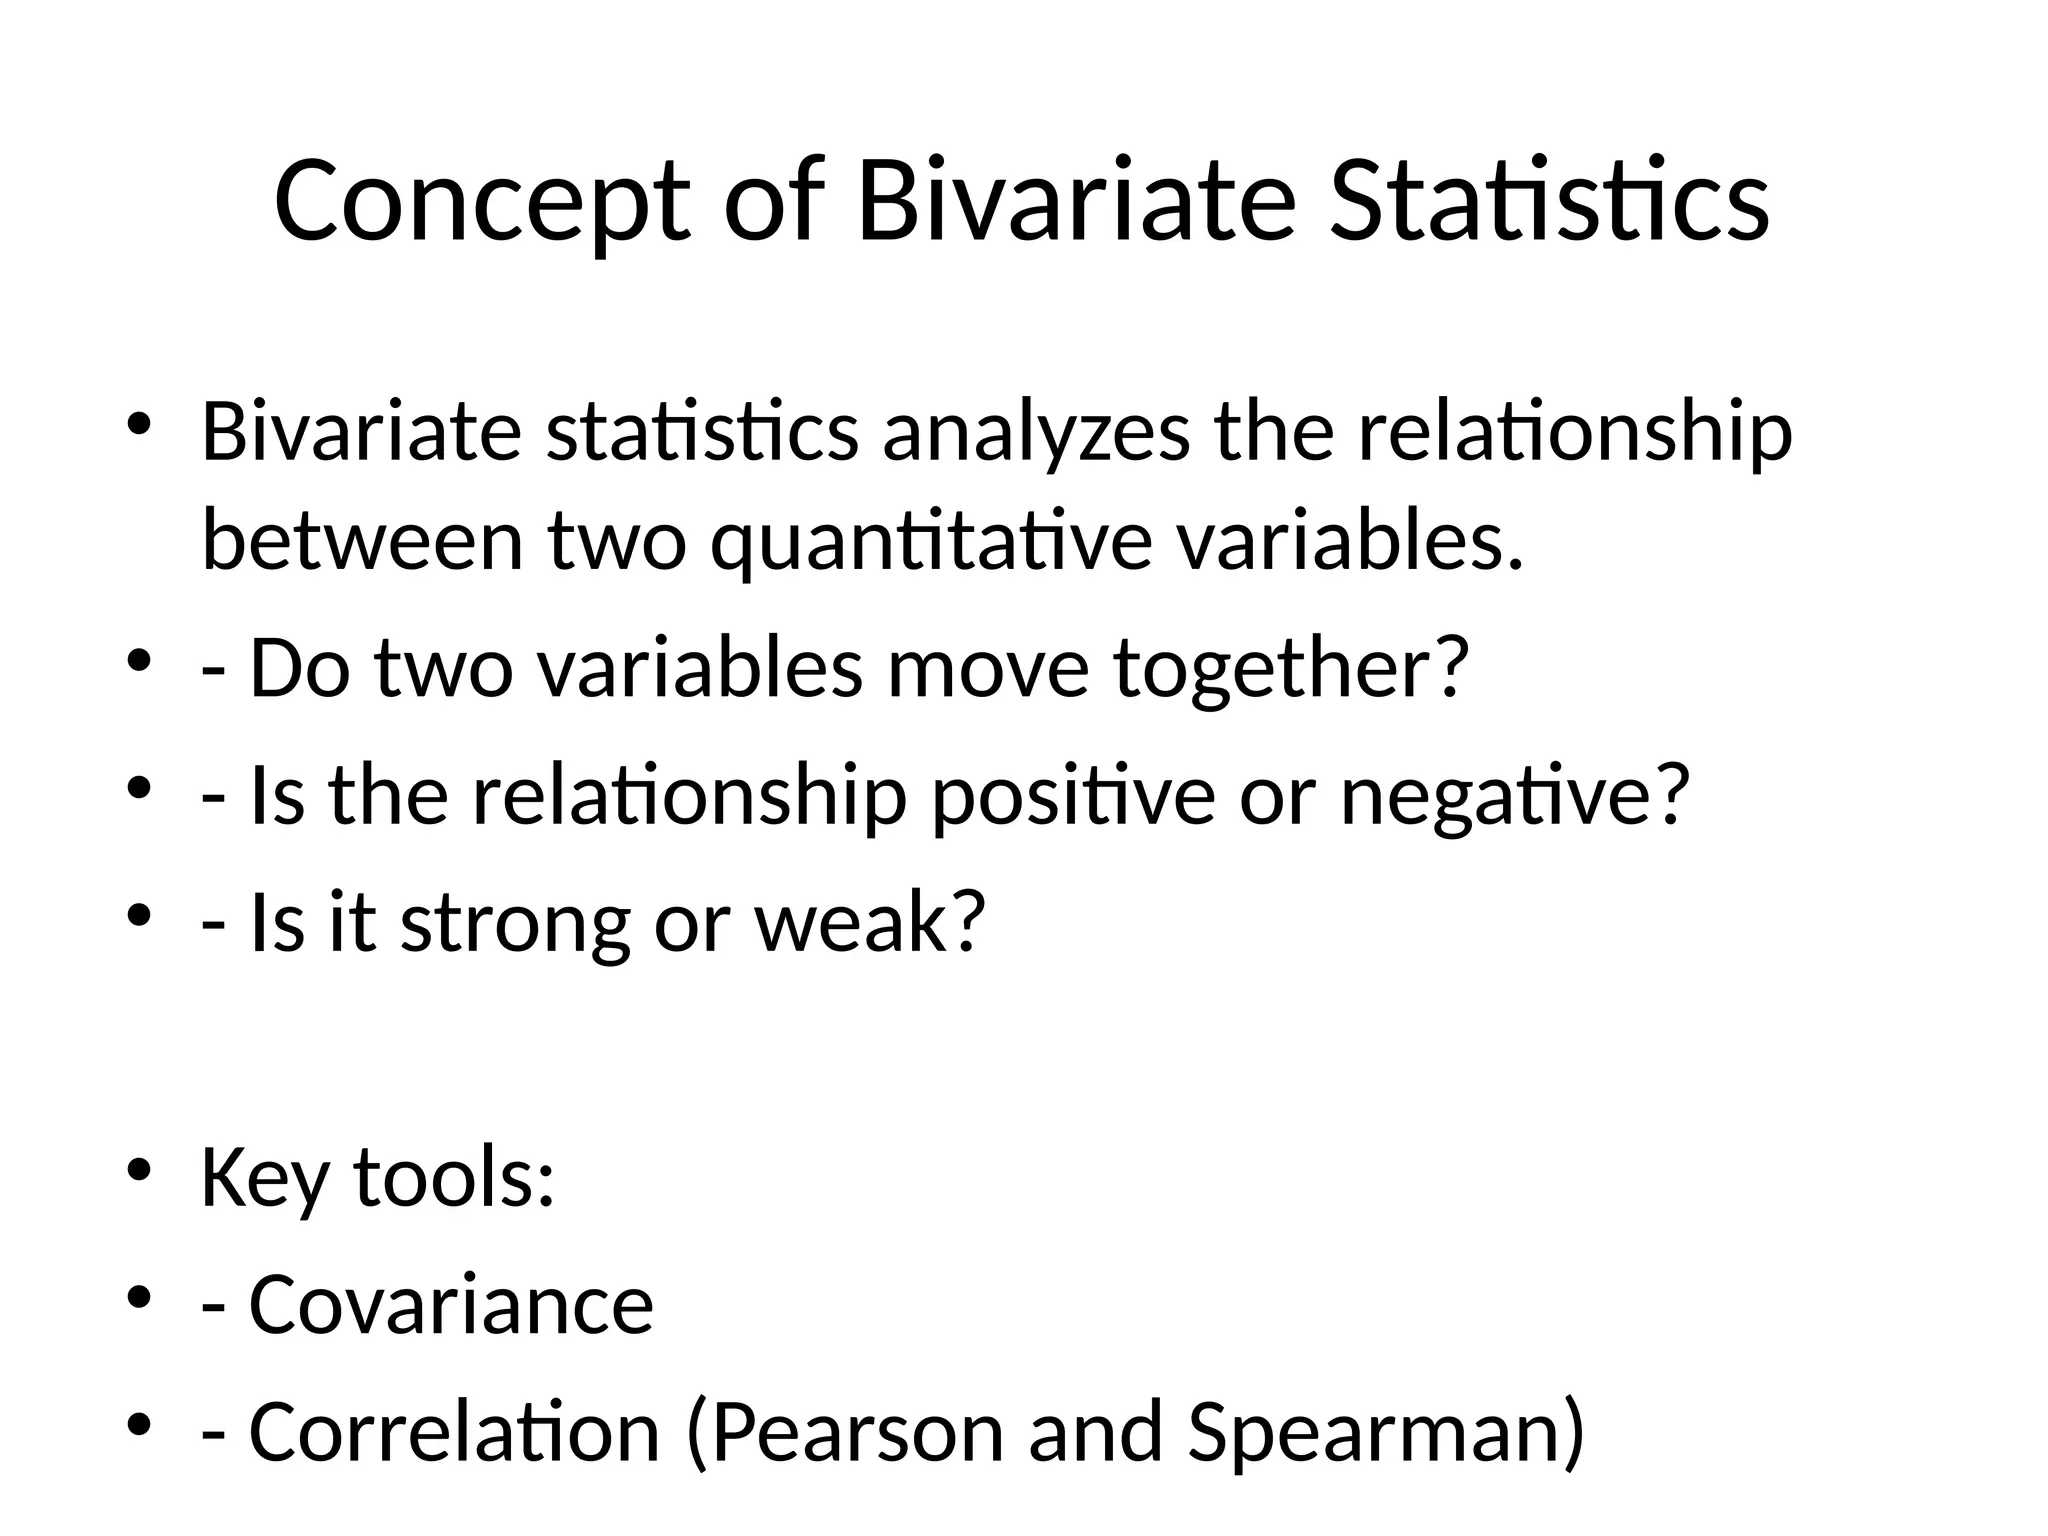
• Bivariate statistics analyzes the relationship
between two quantitative variables.
• - Do two variables move together?
• - Is the relationship positive or negative?
• - Is it strong or weak?
• Key tools:
• - Covariance
• - Correlation (Pearson and Spearman)
3. Covariance
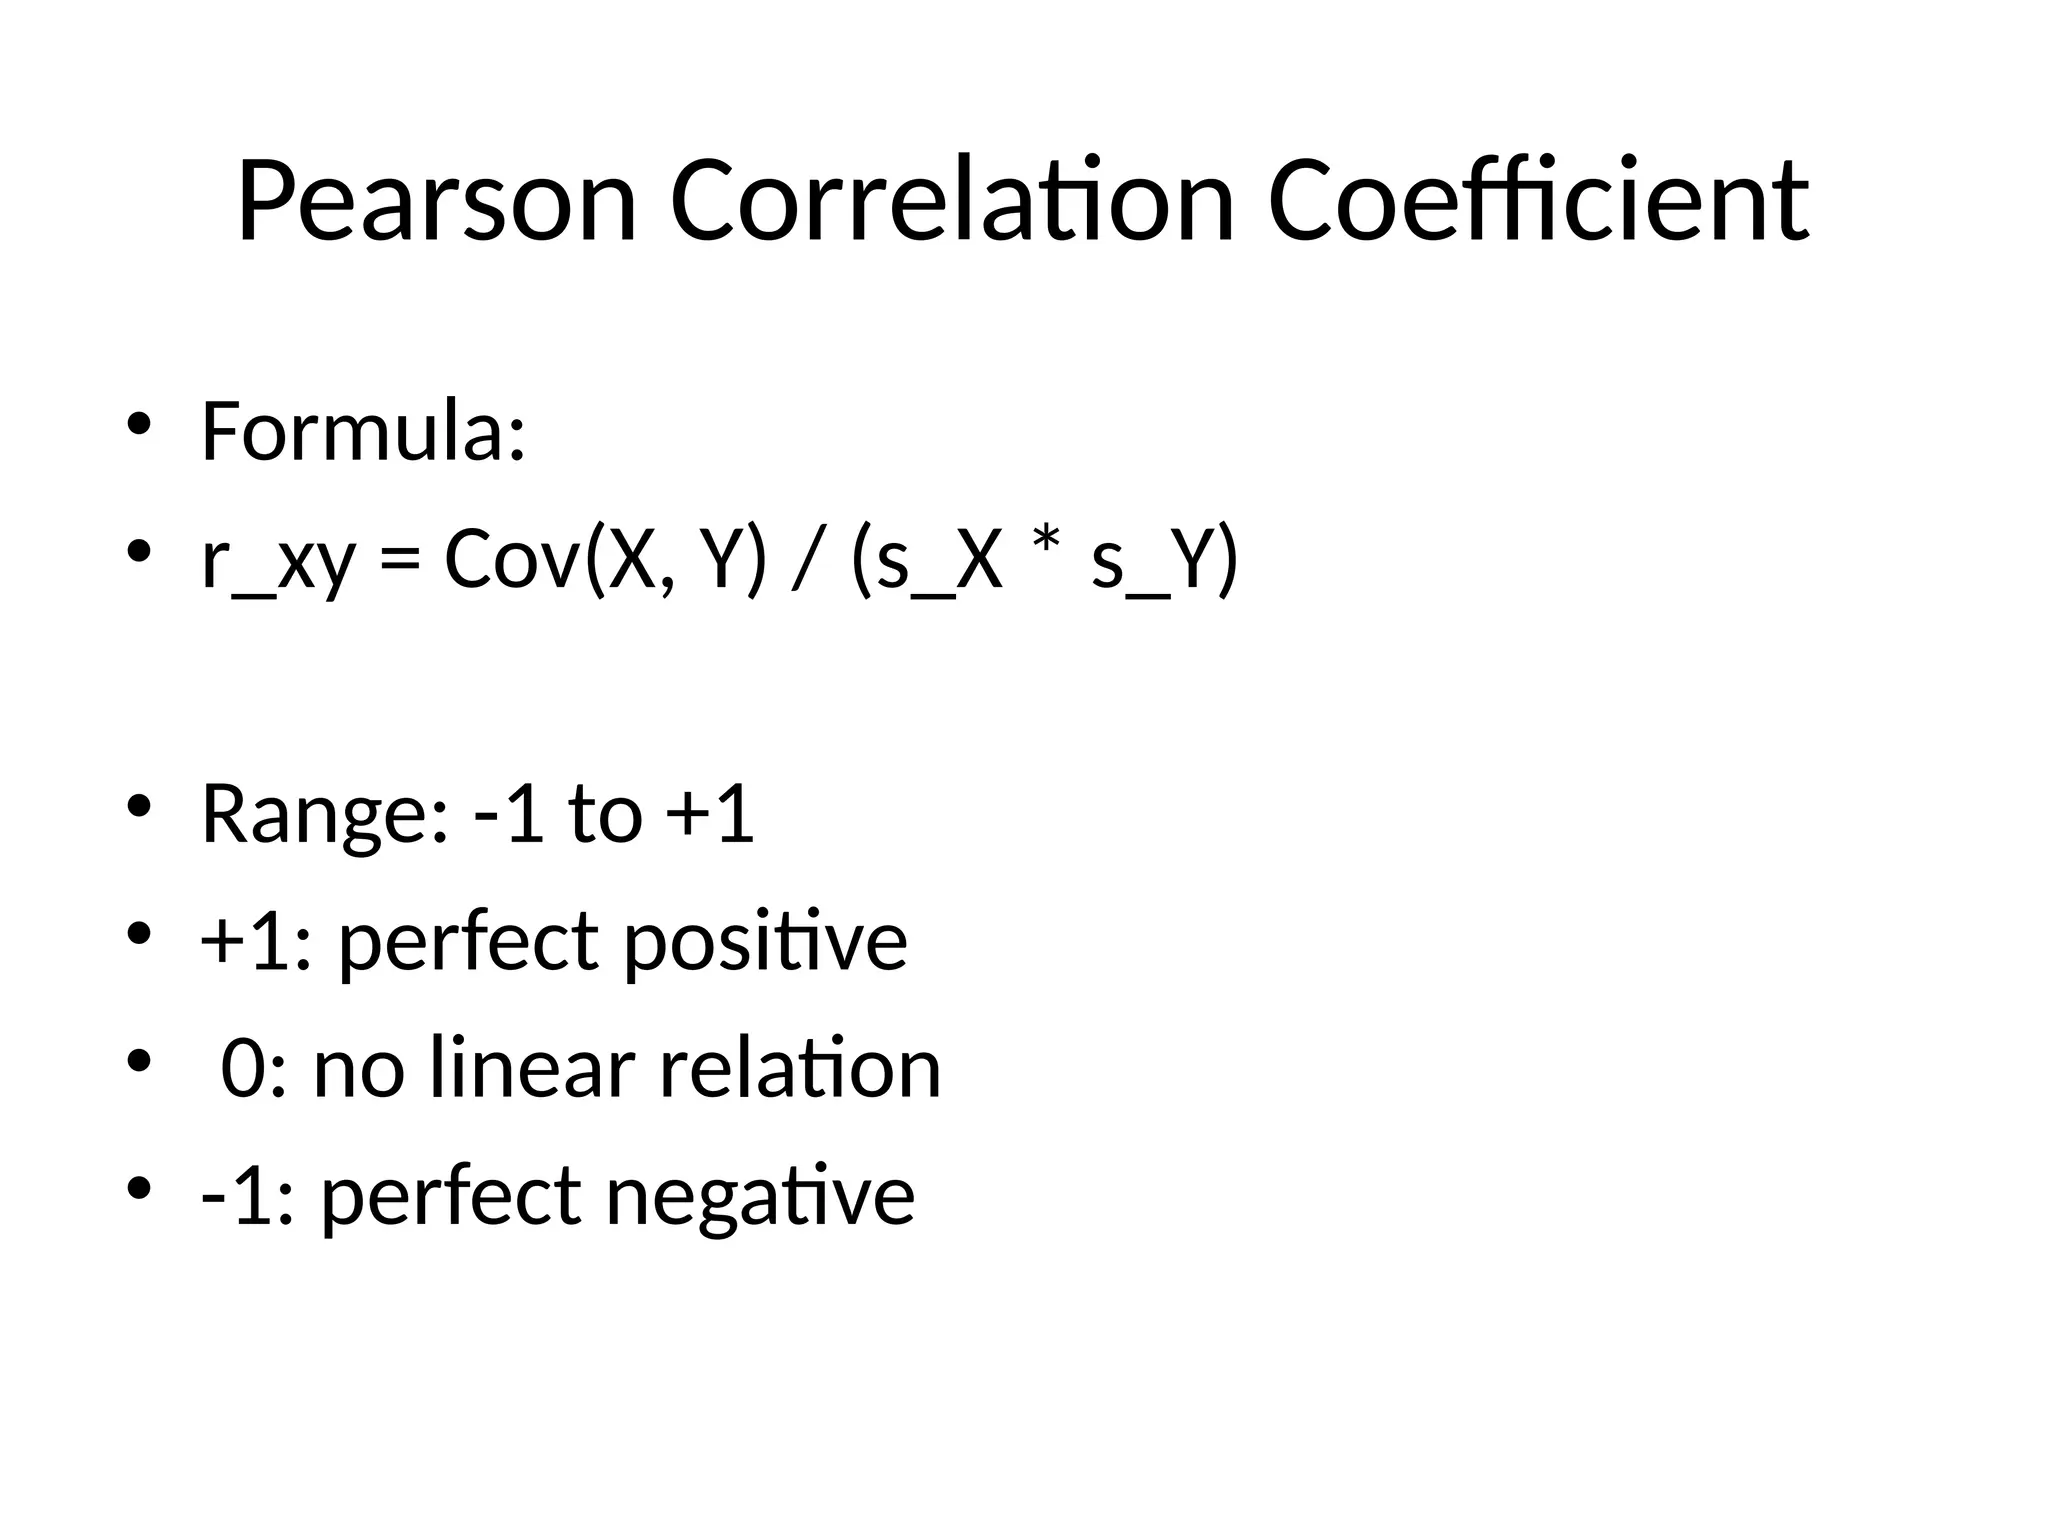
• Formula:
• Cov(X, Y) = (1 / (n - 1)) * Sum[(x_k - )(y_k - ȳ)]
x̄
• Interpretation:
• - Positive: both increase together
• - Negative: one increases, other decreases
• - Zero: no linear relationship
4. Covariance - Solved Example
• X = [60, 70, 80, 90, 100], Y = [160, 165, 170,
175, 180]
• Mean = 80, Ȳ = 170
X̄
• Sum[(x_k - )(y_k - ȳ)] = 500
x̄
• Cov(X,Y) = 500 / 4 = 125
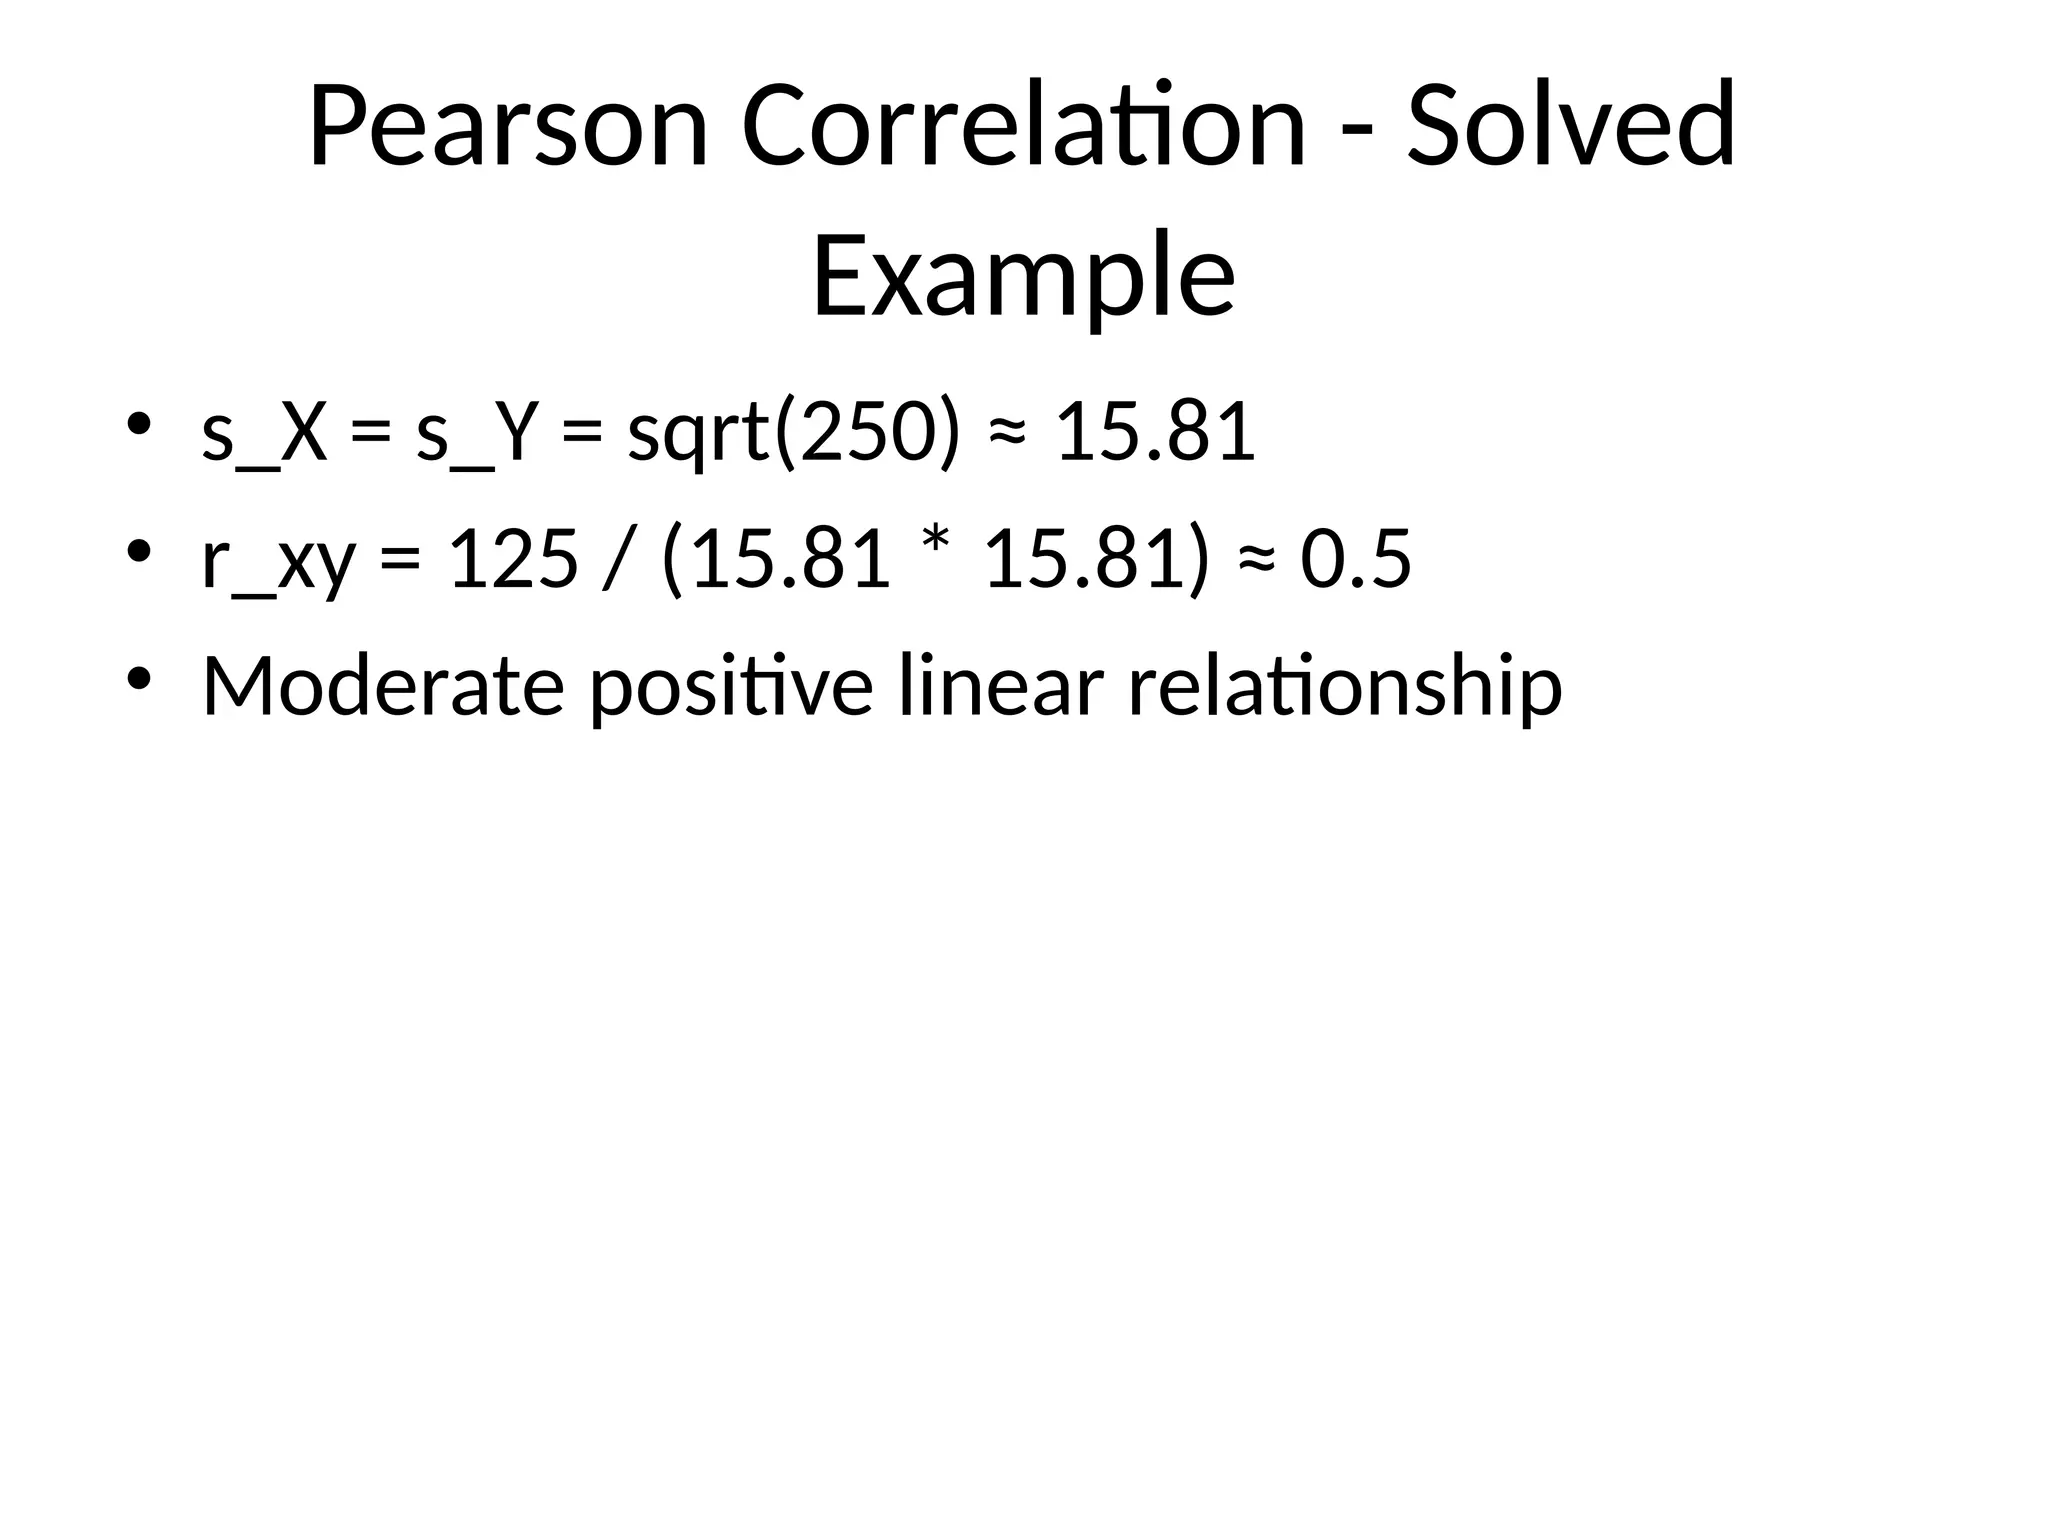
5. 6. Pearson Correlation - Solved
Example
• s_X = s_Y = sqrt(250) ≈ 15.81
• r_xy = 125 / (15.81 * 15.81) ≈ 0.5
• Moderate positive linear relationship
7. Spearman Rank Correlation
• Formula:
• r_s = 1 - [6 * Sum(d_i^2)] / [n(n^2 - 1)]
• Ranks:
• X = [1, 2, 3, 4, 5], Y = [2, 1, 3, 5, 4]
• d_i = [-1, 1, 0, -1, 1], Sum = 4
• r_s = 1 - (6 * 4) / (5 * 24) = 0.8
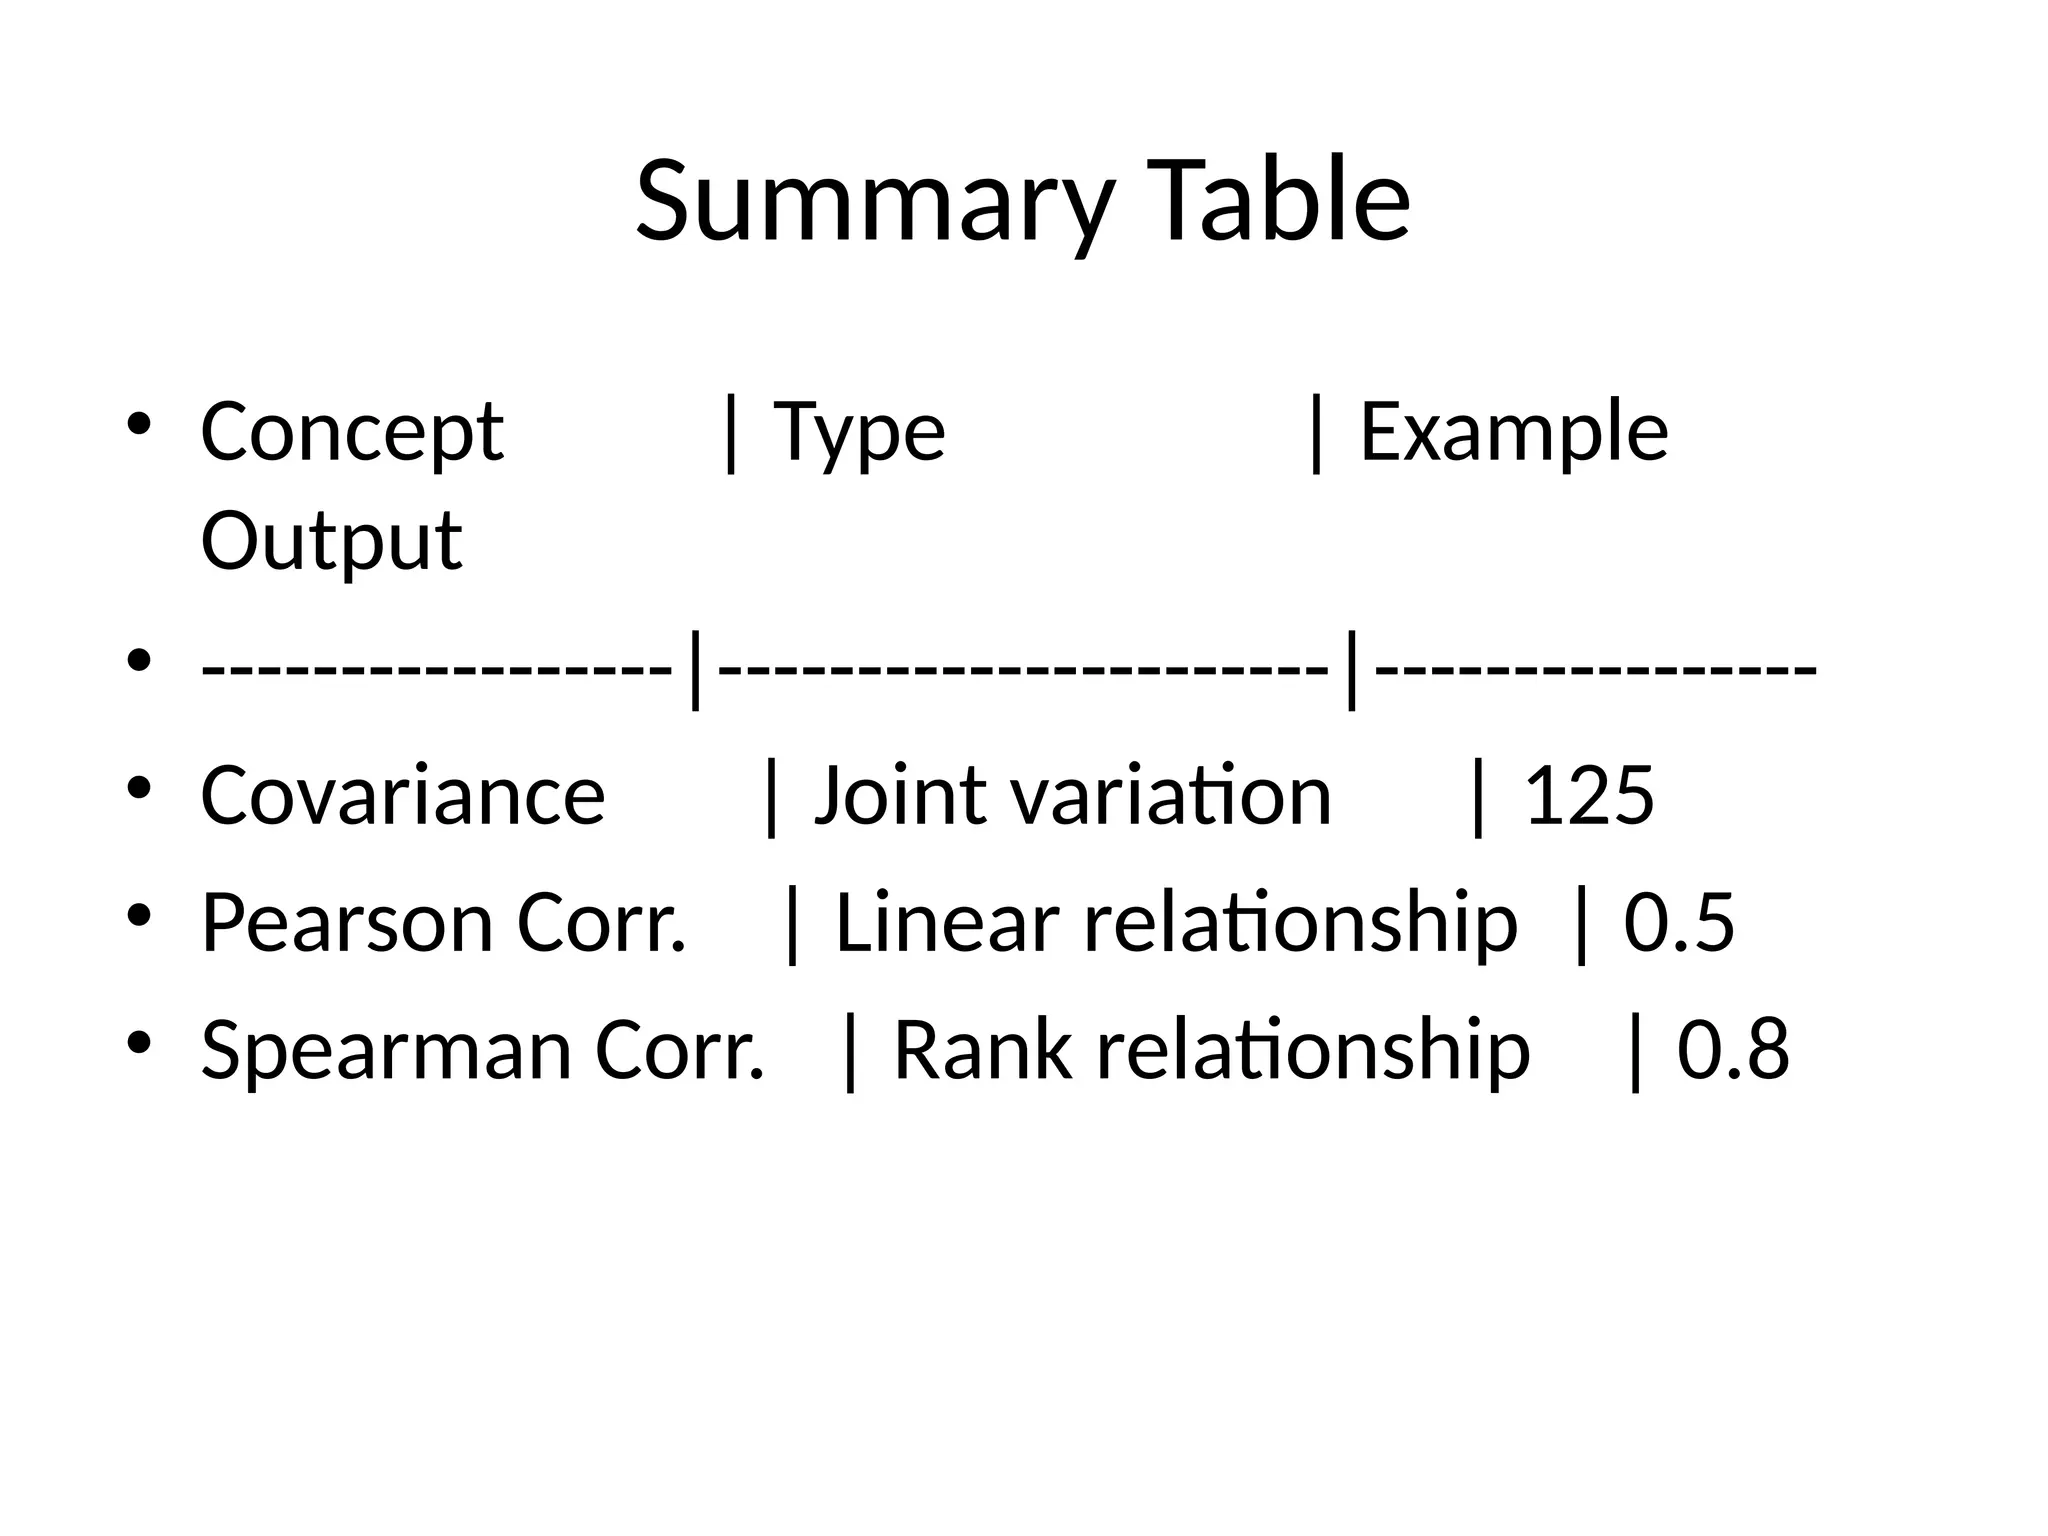
8. Summary Table
• Concept | Type | Example
Output
• -----------------|----------------------|----------------
• Covariance | Joint variation | 125
• Pearson Corr. | Linear relationship | 0.5
• Spearman Corr. | Rank relationship | 0.8
![Covariance
• Formula:
• Cov(X, Y) = (1 / (n - 1)) * Sum[(x_k - )(y_k - ȳ)]
x̄
• Interpretation:
• - Positive: both increase together
• - Negative: one increases, other decreases
• - Zero: no linear relationship](https://image.slidesharecdn.com/bivariatestatisticspresentation-250902050556-0c3bfec9/75/Bivariate-Analysis-Statistics-pesentation-pptx-3-2048.jpg)
![Covariance - Solved Example
• X = [60, 70, 80, 90, 100], Y = [160, 165, 170,
175, 180]
• Mean = 80, Ȳ = 170
X̄
• Sum[(x_k - )(y_k - ȳ)] = 500
x̄
• Cov(X,Y) = 500 / 4 = 125](https://image.slidesharecdn.com/bivariatestatisticspresentation-250902050556-0c3bfec9/75/Bivariate-Analysis-Statistics-pesentation-pptx-4-2048.jpg)
![Spearman Rank Correlation
• Formula:
• r_s = 1 - [6 * Sum(d_i^2)] / [n(n^2 - 1)]
• Ranks:
• X = [1, 2, 3, 4, 5], Y = [2, 1, 3, 5, 4]
• d_i = [-1, 1, 0, -1, 1], Sum = 4
• r_s = 1 - (6 * 4) / (5 * 24) = 0.8](https://image.slidesharecdn.com/bivariatestatisticspresentation-250902050556-0c3bfec9/75/Bivariate-Analysis-Statistics-pesentation-pptx-7-2048.jpg)