Keynote technicals daily report for 280912
•
0 likes•85 views

The document provides a daily technical outlook and analysis of the Indian stock market indices and some stocks. It states that the markets witnessed a flat opening but managed to move higher due to short covering and selective buying, though selling pressure increased later due to derivative segment expiry and lack of follow up buying support. The indices ended the day with modest losses. Technically, the market breadth was neutral amid lower volumes. It provides analysis of index technical levels and moving averages. It also lists some stocks to watch out for and provides intra-day pivot points and resistance and support levels.

Recommended
Recommended
More Related Content
What's hot
What's hot (20)
Viewers also liked
Viewers also liked (8)
Similar to Keynote technicals daily report for 280912
Similar to Keynote technicals daily report for 280912 (20)
More from Keynote Capitals Ltd.
More from Keynote Capitals Ltd. (20)
Keynote technicals daily report for 280912
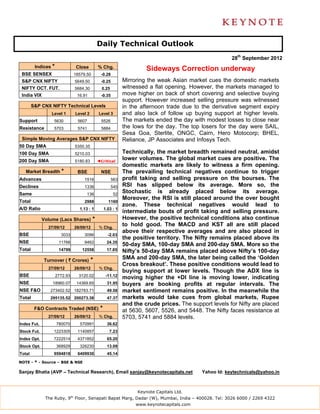
- 1. Daily Technical Outlook 28th September 2012 Indices * Close % Chg. Sideways Correction underway BSE SENSEX 18579.50 -0.28 S&P CNX NIFTY 5649.50 -0.25 Mirroring the weak Asian market cues the domestic markets NIFTY OCT. FUT. 5684.30 0.25 witnessed a flat opening. However, the markets managed to India VIX 16.91 -0.35 move higher on back of short covering and selective buying support. However increased selling pressure was witnessed S&P CNX NIFTY Technical Levels in the afternoon trade due to the derivative segment expiry Level 1 Level 2 Level 3 and also lack of follow up buying support at higher levels. Support 5630 5607 5526 The markets ended the day with modest losses to close near Resistance 5703 5741 5884 the lows for the day. The top losers for the day were SAIL, Sesa Goa, Sterlite, ONGC, Cairn, Hero Motocorp; BHEL, Simple Moving Averages S&P CNX NIFTY Reliance, JP Associates and Infosys Tech. 50 Day SMA 5350.35 100 Day SMA 5210.03 Technically, the market breadth remained neutral, amidst 200 Day SMA 5180.83 ◄Critical lower volumes. The global market cues are positive. The domestic markets are likely to witness a firm opening. Market Breadth * BSE NSE The prevailing technical negatives continue to trigger Advances 1516 563 profit taking and selling pressure on the bourses. The Declines 1336 545 RSI has slipped below its average. More so, the Same 136 52 Stochastic is already placed below its average. Moreover, the RSI is still placed around the over bought Total 2988 1160 zone. These technical negatives would lead to A/D Ratio 1.13 : 1 1.03 : 1 intermediate bouts of profit taking and selling pressure. Volume (Lacs Shares) * However, the positive technical conditions also continue 27/09/12 26/09/12 % Chg. to hold good. The MACD and KST all are still placed above their respective averages and are also placed in BSE 3033 3096 -2.03 the positive territory. The Nifty remains placed above its NSE 11766 9462 24.35 50-day SMA, 100-day SMA and 200-day SMA. More so the Total 14799 12558 17.85 Nifty’s 50-day SMA remains placed above Nifty’s 100-day Turnover ( ` Crores) * SMA and 200-day SMA, the later being called the ‘Golden Cross breakout’. These positive conditions would lead to 27/09/12 26/09/12 % Chg. buying support at lower levels. Though the ADX line is BSE 2772.93 3120.02 -11.12 moving higher the +DI line is moving lower, indicating NSE 18960.07 14369.65 31.95 buyers are booking profits at regular intervals. The NSE F&O 273402.52 182783.71 49.58 market sentiment remains positive. In the meanwhile the Total 295135.52 200273.38 47.37 markets would take cues from global markets, Rupee and the crude prices. The support levels for Nifty are placed F&O Contracts Traded (NSE) * at 5630, 5607, 5526, and 5448. The Nifty faces resistance at 27/09/12 26/09/12 % Chg. 5703, 5741 and 5884 levels. Index Fut. 780070 570991 36.62 Stock Fut. 1223305 1140857 7.23 Index Opt. 7222514 4371852 65.20 Stock Opt. 368929 326230 13.09 Total 9594818 6409930 45.14 NOTE - * - Source – BSE & NSE Sanjay Bhatia (AVP – Technical Research), Email sanjay@keynotecapitals.net Yahoo Id: keytechnicals@yahoo.in Keynote Capitals Ltd. The Ruby, 9th Floor, Senapati Bapat Marg, Dadar (W), Mumbai, India – 400028. Tel: 3026 6000 / 2269 4322 www.keynotecapitals.com
- 2. Jaldi 5 (Short Term Technical Ideas for 5 Trading Days) Stop Initiation Stop Loss Target Stock Close Action Price Loss * (%) Target (%) Remarks Bhushan Steel 492.00 Buy Above 497.00 485.00 2.41 523 5.23 Chambal Fert. 75.15 Buy Above 76.00 74.20 2.37 80 5.26 Tech Mahindra 952.15 Buy Above 955.00 934.75 2.12 1000 4.71 * Stop Losses are to be considered strictly on closing basis. Intra-day Resistance Intra-day Support Indices Close Pivot Point R1 R2 R3 S1 S2 S3 BSE SENSEX 18580 18623 18693 18806 18989 18509 18439 18256 S&P CNX NIFTY 5650 5661 5682 5715 5769 5628 5607 5553 NIFTY OCT. FUT. 5684 5691 5713 5741 5791 5663 5642 5592 Stocks To Watch Out Today ACC, Ambuja Cements, Bhushan Steel. Chambal Fert; Fortis, GVK; HCL tech; HDIL, HUL, IDBI, India Cement, ITC, Jubilant Foods, Kotak Bk; Karnataka Bk; Lupin, M&M, Maruti, Max India, Rel. Capital, Sobha, Sun TV, Tata Power, Tech Mahindra, Titan, Ultratech Cemco, United Spirits, VIP, Yes bank, ZEEL Coal India, Hexaware, Hindalco, Hind Zinc’ Infosys Tech; Jet Airways, Jindal Saw, JSW ispat, MTNL, NTPC, ONGC, Petronet, REC, SAIL,, Sesa Goa, Sterlite, Tata Motors, TCS, TVS Motors, Videocon Keynote Capitals Ltd. The Ruby, 9th Floor, Senapati Bapat Marg, Dadar (W), Mumbai, India – 400028. Tel: 3026 6000 / 2269 4322 www.keynotecapitals.com
- 3. NOTE: TECHNICAL ANALYSIS ABBREVATIONS SMA – Simple Moving Average EMA – Exponential Moving Average WMA – Weighted Moving Average Disclaimer This document is not for public distribution and has been furnished to you solely for your information and must not be reproduced or redistributed to any other person. Persons into whose possession this document may come are required to observe these restrictions. This material is for the personal information of the authorized recipient, and we are not soliciting any action based upon it. This report is not to be construed as an offer to sell or the solicitation of an offer to buy any security in any jurisdiction where such an offer or solicitation would be illegal. It is for the general information of clients of Keynote Capitals Ltd. It does not constitute a personal recommendation or take into account the particular investment objectives, financial situations, or needs of individual clients. We have reviewed the report, and in so far as it includes current or historical information, it is believed to be reliable though its accuracy or completeness cannot be guaranteed. Neither Keynote Capitals Ltd., nor any person connected with it, accepts any liability arising from the use of this document. The recipients of this material should rely on their own investigations and take their own professional advice. Price and value of the investments referred to in this material may go up or down. Past performance is not a guide for future performance. Certain transactions -including those involving futures, options and other derivatives as well as non-investment grade securities - involve substantial risk and are not suitable for all investors. Reports based on technical analysis centers on studying charts of a stock’s price movement and trading volume, as opposed to focusing on a company’s fundamentals and as such, may not match with a report on a company’s fundamentals. Opinions expressed are our current opinions as of the date appearing on this material only. While we endeavor to update on a reasonable basis the information discussed in this material, there may be regulatory, compliance, or other reasons that prevent us from doing so. Prospective investors and others are cautioned that any forward-looking statements are not predictions and may be subject to change without notice. Our proprietary trading and investment businesses may make investment decisions that are inconsistent with the recommendations expressed herein. We and our affiliates, officers, directors, and employees world wide may: (a) from time to time, have long or short positions in, and buy or sell the securities thereof, of company (ies) mentioned herein or (b) be engaged in any other transaction involving such securities and earn brokerage or other compensation or act as a market maker in the financial instruments of the company (ies) discussed herein or act as advisor or lender / borrower to such company (ies) or have other potential conflict of interest with respect to any recommendation and related information and opinions. The analyst for this report certifies that all of the views expressed in this report accurately reflect his or her personal views about the subject company or companies and its or their securities, and no part of his or her compensation was, is or will be, directly or indirectly related to specific recommendations or views expressed in this report. No part of this material may be duplicated in any form and/or redistributed without Keynote Capitals Ltd’s., prior written consent. Keynote Capitals Ltd. The Ruby, 9th Floor, Senapati Bapat Marg, Dadar (W), Mumbai, India – 400028. Tel: 3026 6000 / 2269 4322 www.keynotecapitals.com