Daily Technical Outlook for Nifty
•
0 likes•122 views

The domestic markets opened higher, mirroring positive global cues. Gains were limited due to lack of follow-up buying and profit taking. Trading was range-bound and volumes were low. The markets ended the day with modest gains near the daily high. Technically, breadth was robust but volumes were lower. The markets may see a subdued open as stocks remain in an oversold position on daily charts. Support levels are at 5500, 5364 and 5262, while resistance is at 5600, 5740 and 5885.

Recommended
Recommended
More Related Content
What's hot
What's hot (19)
Viewers also liked
Viewers also liked (16)
Similar to Daily Technical Outlook for Nifty
Similar to Daily Technical Outlook for Nifty (20)
More from Keynote Capitals Ltd.
More from Keynote Capitals Ltd. (20)
Recently uploaded
Recently uploaded (20)
Daily Technical Outlook for Nifty
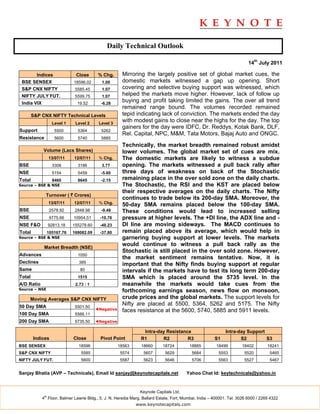
- 1. Daily Technical Outlook 14th July 2011 Indices Close % Chg. Mirroring the largely positive set of global market cues, the BSE SENSEX 18596.02 1.00 domestic markets witnessed a gap up opening. Short S&P CNX NIFTY 5585.45 1.07 covering and selective buying support was witnessed, which NIFTY JULY FUT. 5599.75 1.07 helped the markets move higher. However, lack of follow up India VIX 19.52 -6.28 buying and profit taking limited the gains. The over all trend remained range bound. The volumes recorded remained S&P CNX NIFTY Technical Levels tepid indicating lack of conviction. The markets ended the day Level 1 Level 2 Level 3 with modest gains to close near the highs for the day. The top gainers for the day were IDFC, Dr. Reddys, Kotak Bank, DLF, Support 5500 5364 5262 Rel. Capital, NPC, M&M, Tata Motors, Bajaj Auto and ONGC. Resistance 5600 5740 5885 Technically, the market breadth remained robust amidst Volume (Lacs Shares) lower volumes. The global market set of cues are mix. 13/07/11 12/07/11 % Chg. The domestic markets are likely to witness a subdue BSE 3306 3186 3.77 opening. The markets witnessed a pull back rally after NSE 5154 5459 -5.60 three days of weakness on back of the Stochastic Total 8460 8645 -2.15 remaining place in the over sold zone on the daily charts. Source – BSE & NSE The Stochastic, the RSI and the KST are placed below their respective averages on the daily charts. The Nifty Turnover ( ` Crores) continues to trade below its 200-day SMA. Moreover, the 13/07/11 12/07/11 % Chg. 50-day SMA remains placed below the 100-day SMA. BSE 2578.92 2848.98 -9.48 These conditions would lead to increased selling NSE 9775.66 10954.51 -10.76 pressure at higher levels. The +DI line, the ADX line and - NSE F&O 92813.18 155278.60 -40.23 DI line are moving sideways. The MACD continues to Total 105167.76 169082.09 -37.80 remain placed above its average, which would help in Source – BSE & NSE garnering buying support at lower levels. The markets Market Breadth (NSE) would continue to witness a pull back rally as the Stochastic is still placed in the over sold zone. However, Advances 1050 the market sentiment remains tentative. Now, it is Declines 385 important that the Nifty finds buying support at regular Same 80 intervals if the markets have to test its long term 200-day Total 1515 SMA which is placed around the 5735 level. In the A/D Ratio 2.73 : 1 meanwhile the markets would take cues from the Source – NSE forthcoming earnings season, news flow on monsoon, Moving Averages S&P CNX NIFTY crude prices and the global markets. The support levels for 50 Day SMA 5501.50 Nifty are placed at 5500, 5364, 5262 and 5175. The Nifty ◄Negative faces resistance at the 5600, 5740, 5885 and 5911 levels. 100 Day SMA 5566.11 200 Day SMA 5735.50 ◄Negative Intra-day Resistance Intra-day Support Indices Close Pivot Point R1 R2 R3 S1 S2 S3 BSE SENSEX 18596 18563 18660 18724 18885 18499 18402 18241 S&P CNX NIFTY 5585 5574 5607 5629 5684 5553 5520 5465 NIFTY JULY FUT. 5600 5587 5623 5646 5706 5563 5527 5467 Sanjay Bhatia (AVP – Technicals), Email Id sanjay@keynotecapitals.net Yahoo Chat Id: keytechnicals@yahoo.in Keynote Capitals Ltd. th 4 Floor, Balmer Lawrie Bldg., 5, J. N. Heredia Marg, Ballard Estate, Fort, Mumbai, India – 400001. Tel: 3026 6000 / 2269 4322 www.keynotecapitals.com
- 2. Short Term Trading Ideas Based On Technical Analysis (5 - 7 Days) Stop Initiation Stop Loss Target Stock CMP Action Price Loss * (%) Target (%) Remarks Biocon 363.75 Buy Above 365.00 357.50 2.05 381 4.38 Target of 340 Achieved given @ 320 on CESC 340.05 Buy Above 341.50 333.00 2.49 360 5.42 08/07/11 GMDC 164.65 Buy Above 167.00 162.00 2.99 178 6.59 * Stop Losses are to be considered on Closing basis. Keynote Capitals Ltd. th 4 Floor, Balmer Lawrie Bldg., 5, J. N. Heredia Marg, Ballard Estate, Fort, Mumbai, India – 400001. Tel: 3026 6000 / 2269 4322 www.keynotecapitals.com
- 3. Disclaimer This document is not for public distribution and has been furnished to you solely for your information and must not be reproduced or redistributed to any other person. Persons into whose possession this document may come are required to observe these restrictions. This material is for the personal information of the authorized recipient, and we are not soliciting any action based upon it. This report is not to be construed as an offer to sell or the solicitation of an offer to buy any security in any jurisdiction where such an offer or solicitation would be illegal. It is for the general information of clients of Keynote Capitals Ltd. It does not constitute a personal recommendation or take into account the particular investment objectives, financial situations, or needs of individual clients. We have reviewed the report, and in so far as it includes current or historical information, it is believed to be reliable though its accuracy or completeness cannot be guaranteed. Neither Keynote Capitals Ltd., nor any person connected with it, accepts any liability arising from the use of this document. The recipients of this material should rely on their own investigations and take their own professional advice. Price and value of the investments referred to in this material may go up or down. Past performance is not a guide for future performance. Certain transactions -including those involving futures, options and other derivatives as well as non-investment grade securities - involve substantial risk and are not suitable for all investors. Reports based on technical analysis centers on studying charts of a stock’s price movement and trading volume, as opposed to focusing on a company’s fundamentals and as such, may not match with a report on a company’s fundamentals. Opinions expressed are our current opinions as of the date appearing on this material only. While we endeavor to update on a reasonable basis the information discussed in this material, there may be regulatory, compliance, or other reasons that prevent us from doing so. Prospective investors and others are cautioned that any forward-looking statements are not predictions and may be subject to change without notice. Our proprietary trading and investment businesses may make investment decisions that are inconsistent with the recommendations expressed herein. We and our affiliates, officers, directors, and employees world wide may: (a) from time to time, have long or short positions in, and buy or sell the securities thereof, of company (ies) mentioned herein or (b) be engaged in any other transaction involving such securities and earn brokerage or other compensation or act as a market maker in the financial instruments of the company (ies) discussed herein or act as advisor or lender / borrower to such company (ies) or have other potential conflict of interest with respect to any recommendation and related information and opinions. The analyst for this report certifies that all of the views expressed in this report accurately reflect his or her personal views about the subject company or companies and its or their securities, and no part of his or her compensation was, is or will be, directly or indirectly related to specific recommendations or views expressed in this report. No part of this material may be duplicated in any form and/or redistributed without Keynote Capitals Ltd’s., prior written consent. Keynote Capitals Ltd. th 4 Floor, Balmer Lawrie Bldg., 5, J. N. Heredia Marg, Ballard Estate, Fort, Mumbai, India – 400001. Tel: 3026 6000 / 2269 4322 www.keynotecapitals.com