This document provides a summary of key functions in Oracle SQL across five categories: grouping functions, numeric functions, string functions, date functions, and conversion functions. Examples are provided for each function to illustrate its usage and meaning. The full descriptions of all Oracle functions are available in another document.
As part of the GSP’s capacity development and improvement programme, FAO/GSP have organised a one week training in Izmir, Turkey. The main goal of the training was to increase the capacity of Turkey on digital soil mapping, new approaches on data collection, data processing and modelling of soil organic carbon. This 5 day training is titled ‘’Training on Digital Soil Organic Carbon Mapping’’ was held in IARTC - International Agricultural Research and Education Center in Menemen, Izmir on 20-25 August, 2017.
This document provides an introduction to the R programming language. It discusses that R was created in the 1990s and is based on the S language. R is an interpreted, high-level language that supports multiple programming paradigms. The document then covers getting started with R, choosing an integrated development environment, using R as a calculator, assigning variables, comments, getting help, basic data types, and various data structures in R including vectors, matrices, arrays, and lists.
R can be used to summarize and visualize data in various ways. Descriptive statistics like mean, median, range can summarize a single variable. Correlation and regression can show relationships between two variables. Frequency tables and cross tabs show counts and proportions of variables. Graphs like bar plots, histograms, boxplots and more can visualize one or more variables. Pie charts, scatter plots and heat maps are other options. R has functions for each of these techniques to explore and communicate patterns in data.
The document discusses functional programming in R. It begins by explaining the differences between object-oriented/imperative and functional programming metaphysics. Functional programming treats things as fixed values undergoing processes over time rather than objects with state and behavior. The document then covers elements of functional programming like pure functions, recursion, and immutability. It explains how R is a strongly functional language and highlights features like vectorized functions and higher-order functions. It provides an example of a functional programming style bootstrap function to sample linear models.
This document provides an overview of descriptive statistics and data visualization techniques using Python. It first describes summarizing a dataset using measures of central tendency, variation, skewness, and kurtosis. These include calculating the mean, median, mode, standard deviation, variance, and coefficient of variation. It then demonstrates bivariate analysis through scatter plots, correlation coefficients, and regression lines. Finally, it shows various data visualization graphs that can be created like bar charts, stacked and percentage bar charts, line and pie charts, box plots, histograms, stem-and-leaf plots, and heat maps using libraries like Pandas, Matplotlib and Seaborn.
This document discusses principal component analysis (PCA), including the theory behind it and toolkits for implementing it. The theory section explains how PCA transforms correlated variables into uncorrelated principal components to perform dimensionality reduction. It describes minimizing squared error to find the principal components, which are the eigenvectors of the covariance matrix. The document lists toolkits for PCA in languages like C, Java, Perl and MATLAB and provides code examples.
This document summarizes arrays and structures in C including:
1) Arrays are sets of index-value pairs that use consecutive memory locations. Structures group related data and can reference themselves.
2) C implements 1D arrays using consecutive memory locations accessed via indexes. Structures allow defining custom data types.
3) Operations on ordered lists include retrieving, inserting, deleting elements. Polynomials are represented as ordered pairs of exponents and coefficients. Addition involves comparing exponents and combining coefficients.
This document discusses various data types and structures in R. It begins by defining data types as categories of values like numeric and character. Data structures are described as how data is stored, such as vectors, factors, matrices, data frames, and lists. Examples are provided for each structure showing how to create them and access their elements. The document concludes by demonstrating how to work with built-in datasets in R, including viewing, summarizing, and accessing their columns and rows.
This document discusses various methods for importing, exporting, and summarizing data in Python using the Pandas library. It covers reading and writing CSV, TXT, and XLSX files with Pandas, checking the structure and dimensions of data frames, handling missing values, and modifying data through functions like rename(). The key methods described are read_csv(), read_table(), read_excel(), to_csv(), info(), isnull(), sum(), head(), tail(), and describe().
This document provides an overview of various data structures in R including vectors, lists, factors, matrices, and data frames. It discusses how to create, subset, and coerce between these structures. It also covers handling missing data and common data type conversions. The document recommends several books and online resources for learning more about R programming and statistics.
The document is a cheat sheet for data wrangling with pandas, providing syntax and methods for creating and manipulating DataFrames, reshaping and subsetting data, summarizing data, combining datasets, filtering and joining data, grouping data, handling missing values, and plotting data. Key methods described include pd.melt() to gather columns into rows, pd.pivot() to spread rows into columns, pd.concat() to append DataFrames, df.sort_values() to order rows by column values, and df.groupby() to group data.
The document outlines various statistical and data analysis techniques that can be performed in R including importing data, data visualization, correlation and regression, and provides code examples for functions to conduct t-tests, ANOVA, PCA, clustering, time series analysis, and producing publication-quality output. It also reviews basic R syntax and functions for computing summary statistics, transforming data, and performing vector and matrix operations.
Given what a beautiful and mature functional programming language R is, there is a surprising, though understandable, lack of visibility of functional programming techniques in R. This is a talk given to the Mumbai R meetup group in October/November, 2014, meant to introduce the audience to Functional Programming in R.
This document discusses two methods for finding the maximum and minimum values in an array: the naive method and divide and conquer approach. The naive method compares all elements to find the max and min in 2n-2 comparisons. The divide and conquer approach recursively divides the array in half, finds the max and min of each half, and returns the overall max and min, reducing the number of comparisons. Pseudocode is provided for the MAXMIN algorithm that implements this divide and conquer solution.
This document discusses state-space representation of linear time-invariant (LTI) systems. It defines system state, state equations, and output equations. The key points are:
1) State equations describe the dynamics of a system using first-order differential equations relating state variables. Output equations relate outputs to state variables and inputs.
2) For LTI systems, the state equations can be written in matrix form as dx/dt = Ax + Bu, and output equations as y = Cx + Du.
3) Block diagrams can be constructed from the state-space model, with integrators for each state variable and blocks representing the A, B, C, and D matrices.
This document discusses arrays in C programming. It defines an array as a group of consecutive memory locations that all have the same name and type. Arrays allow storing multiple values of the same type together. Elements in an array are accessed via an index, with the first element having an index of 0. The document covers declaring and initializing arrays, passing arrays to functions, and modifying arrays. It provides an example program that demonstrates printing the values in an array and modifying an array by passing it to a function.
The document discusses pointers and arrays in C programming. It explains that an array stores multiple elements of the same type in contiguous memory locations, while a pointer variable stores the address of another variable. The summary demonstrates how to declare and initialize arrays and pointers, access array elements using pointers, pass arrays to functions by reference using pointers, and how pointers and arrays are related but not synonymous concepts.
Arrays allow storing and accessing multiple data elements using numeric indices. Arrays can be one-dimensional or multidimensional. One-dimensional arrays are linear arrays while multidimensional arrays include jagged arrays where each sub-array can have a different length. Arrays are declared using keywords like Dim and can be reinitialized using ReDim which resizes the array. Control structures like If/Then, Do/Loop, and For/Next are used to control program flow.
R can be used to analyze data and perform statistical analysis. Functions like help(), ? and help.start() provide information about other functions. Objects created in R sessions are stored by name and can be removed with rm(). Vectors like x=c(1,2,3,4,5) can be created and their length checked with length(x). Subsets of vectors can be selected using logical or integer indexes inside square brackets. Matrices are multi-dimensional generalizations of vectors that can be manipulated using operators like * and %. Data can be read into R from external files using functions like read.table() and read.delim(). Common statistical distributions like normal, uniform and exponential are available as functions in R for
The document discusses improving readability and performance in DataWeave 2.0. It explains that DataWeave is an expression-based language which can lead to nested function calls that are difficult to read. It presents using declarations and do statements in DataWeave 2.0 to write code in a more imperative style with improved readability and performance by avoiding unnecessary calculations. A real-world example of calculating account balances is provided to demonstrate transforming nested expressions into a more readable style using declarations and do statements.
The document evaluates different classifier models for predicting Titanic survivor data: generalized linear models (GLM), decision trees, and random forests. It prepares training and test datasets and uses the ROCR package to calculate performance metrics like AUC for each model. GLM achieved the highest AUC of 0.84, outperforming the decision tree AUC of 0.78 and random forest AUC of 0.82. While random forests typically outperform individual trees, in this case GLM performed best due to its superior lift over other models.
The document discusses data structures and lists in Python. It begins by defining data structures as a way to organize and store data for efficient access and modification. It then covers the different types of data structures, including primitive structures like integers and strings, and non-primitive structures like lists, tuples, and dictionaries. A large portion of the document focuses on lists in Python, describing how to perform common list manipulations like adding and removing elements using various methods. These methods include append(), insert(), remove(), pop(), and clear(). The document also discusses accessing list elements and other list operations such as sorting, counting, and reversing.
The document discusses Python lists, tuples, and dictionaries. It provides examples of how to create, access, modify, and loop through each of these data types. Lists are ordered and changeable collections that allow duplicate elements. Tuples are ordered and unchangeable collections that allow duplicate elements. Dictionaries are unordered collections of key-value pairs that do not allow duplicate keys. The document demonstrates various methods and operations available for each data type, such as appending and removing elements from lists, accessing elements by index in lists and tuples, and adding or modifying elements in dictionaries.
R can be used to analyze data and perform statistical analysis. Key functions include help() and ? to get information on functions, and objects() to view stored objects. Vectors can be created with c() and manipulated using arithmetic operators. Matrices are two-dimensional arrays that can be operated on using *, /, and t(). Larger datasets are typically read from external files using read.table() or read.delim(). Common distributions can be explored using functions like dnorm(), pnorm(), and rnorm(). Statistical analysis includes commands like cov() and cor() to measure covariance and correlation between variables.
This document provides a summary of functions for input and output, data creation and manipulation, indexing, and getting help in R. Key functions covered include read.table() and read.csv() for reading data, c(), seq(), and rep() for data creation, [ and [[ for indexing vectors, lists and data frames, and help(), ? and apropos() for getting help documentation in R.
The document discusses traditional foods in Ecuador's four natural regions: the mountain region, coast region, Amazon region, and highlands region. It notes the variety of Ecuadorian cuisine stems from these diverse regions and helps preserve cultural identity through dishes made with local ingredients. Examples of traditional foods highlighted include roasted worms with yucca from the mountain region and banana turnovers from the coast region. The conclusion recommends valuing Ecuador's food as an important part of its culture.
1. The document provides instructions and goals for a unit on planets and the Earth, including pre-testing, using information and media, and achieving a test score of 90-95%.
2. It includes a pre-test with questions about active and passive sentences, the solar system, parts of speech, seasons, and a conversation about planets.
3. The main content covers word studies on vocabulary like "complete" and "exist", a video, information on seasons and the Earth's orbit, changing sentences between active and passive voice, and a post-test to assess learning.
1) The document provides instructions and goals for a test on a unit about Earth and its neighbors.
2) It includes questions to test knowledge of key terms like active and passive sentences, parts of speech, seasons on Earth, and properties of planets and stars.
3) The test concludes with a short conversation to assess understanding of whether planets radiate or reflect light and an interest in stars.
The document discusses different processes that water undergoes: boiling, melting, freezing, evaporation, and condensation. It explains that boiling turns water into gas, melting turns ice into liquid, and freezing turns liquid water into ice. Evaporation turns water into vapor at any temperature, and condensation is part of the water cycle where water changes states between vapor, liquid, and solid as it moves from the earth's surface to the sky and back through evaporation and condensation.
Fish live in water and have scales, tails, and fins to help them move and protect themselves in water. Examples of fish include goldfish, sharks, stingrays, seahorses, clownfish, piranhas, angelfish, glass cats, and red mosaic guppies. Their tails help them move through water while their fins aid in staying upright and changing direction.
Living things need air, food, water, and the ability to reproduce to ensure their survival. They come in different shapes, sizes, and colors. Examples of living things include trees, chinchillas, and bacteria. Bacteria reproduce through a simple process of DNA replication and cell splitting, which allows each new cell to have a complete set of DNA. Living things reproduce to ensure the continuity of their species.
The document discusses human reproduction. It explains that sperm will fuse with an egg, causing the egg to multiply and change into a baby. This allows the species to continue living by reproducing new individuals when sperm fuse with eggs.
Cells are the basic units that make up living things, with some organisms like bacteria made of just one cell. Animal cells contain a cell membrane that controls what enters and exits, cytoplasm that holds other parts, and a nucleus that controls the cell's activities and passes genetic information. Plant cells have a cell wall that protects and shapes the cell and chloroplasts that contain chlorophyll to absorb light for photosynthesis.
Heredity is the passing on of characteristics from parents to offspring. Traits like dimples, hairline shape, eye color, and hair color are passed down from human parents to children. While some animal offspring resemble their parents, others do not at birth but develop to look more like their parents as they grow. Heredity is the study of traits passed from one generation to the next.
Plants need air, water, and food to survive and are able to make their own food through photosynthesis. Some plants like rice provide food for humans. Plants are categorized as either flowering plants like sunflowers, balsams, and cherry trees, which produce flowers, or non-flowering plants such as mushrooms, ferns, and mosses, which do not bear flowers.
Flowers have male and female reproductive parts. The male parts include the anther and filament, while the female parts are the stigma, style, and ovary. Pollination is the transfer of pollen grains from the anther to the stigma, aided by animals, wind, or other mechanisms. Each pollen grain contains two male sex cells that travel through the pollen tube to fertilize the female sex cell in the ovule. After fertilization, the ovule develops into a seed and the ovary into a fruit. Seeds are then dispersed by wind, water, animals or splitting open to germinate when they have sufficient water, air and warmth away from the parent plant.
Don't bother watching folks! Just needed to upload this inorder to be able to post it in my blog. School assignment thing, example of a basic slideshow etc etc :)
Flowering plants reproduce through seeds and produce colorful flowers at certain times of the year. Examples include rice, orchids, and mimosa trees. Most flowering plants reproduce from seeds. In contrast, non-flowering plants like ferns and mosses reproduce through spores rather than seeds. The document provides examples of flowering and non-flowering plants and explains their different reproductive mechanisms.
This is the presentation given to the Geeks on a Plane 500 Startups Group (GOAP) in Mexico City on Saturday May 12, 2012 by Paul Ahlstrom. This is a summary of the internal market research that led Alta to create a two investment funds in Mexico (Alta Growth Capital and Alta Ventures Mexico) (Excuse the formatting issues... We call this our kitchen sink version and although it is fairly complete, it was never meant for external publication..) Enjoy - It will be posted here for a limited time
The document provides information about MySQL including:
1. MySQL is an open source relational database management system based on SQL that is used to add, remove, and modify information in databases.
2. It describes basic MySQL commands like CREATE TABLE, DROP TABLE, SELECT, INSERT, UPDATE, and provides syntax examples.
3. It also covers advanced commands, functions in MySQL like aggregate functions, numeric functions and string functions as well as stored procedures.
The document discusses various SQL statements and concepts. It introduces the different types of SQL statements - DQL, DML, DDL, TCL, DCL and describes common statements like SELECT, INSERT, UPDATE, DELETE. It also covers SQL concepts like data types, NULL values, joins, aggregation, sorting, filtering using WHERE clause and logical operators. Single-row functions for character, number and date manipulations are explained along with examples.
SQL stands for Structured Query Language
SQL lets you access and manipulate databases
SQL became a standard of the American National Standards Institute (ANSI) in 1986, and of the International Organization for Standardization (ISO) in 1987
Oracle has two types of functions: single row functions that return a value for each row processed, and group functions that return aggregate values after processing multiple rows. There are four types of single row functions: numeric functions for numbers, character functions for text, date functions for dates, and conversion functions to change data types. Functions are used to manipulate data and are often combined in expressions.
SQL functions allow users to perform operations on data within SQL statements. There are several common types of SQL functions, including scalar functions that return a single result from one value, aggregate functions that return a single result from a set of values, and string, date/time, and mathematical functions. Examples provided include COUNT(), SUM(), NOW(), and CONCAT(). SQL functions make querying and manipulating data in relational databases more powerful and flexible.
1) The document provides information on various SQL functions for string manipulation, date functions, aggregate functions, and selecting rows from tables based on conditions.
2) String functions include concatenation, conversion between ASCII and character values, indexing and pattern matching. Date functions include adding/subtracting dates and retrieving date parts. Aggregate functions include average, count, max, min and sum.
3) Row selection can be done using comparison, range, list, string and logical operators to specify conditions in the WHERE clause. Distinct, TOP and PERCENT clauses can also be used for result set filtering.
This document provides an introduction and overview of MySQL. It discusses MySQL's use of SQL for defining, modifying, and querying databases. It describes SQL statements for creating databases and tables, inserting, updating, and deleting rows of data, and performing basic queries with SELECT statements. It also covers concepts like aggregate functions, GROUP BY clauses, and handling null values in queries.
Unit 3 - Function & Grouping,Joins and Set Operations in ORACLEDrkhanchanaR
The document discusses various built-in functions in Oracle including single row functions, group functions, character functions, numeric functions, and date functions. It provides examples of functions such as UPPER, LOWER, ROUND, TRUNC, SYS_DATE, and conversion functions like TO_CHAR and TO_DATE. Character functions manipulate character data, numeric functions perform calculations and return numeric values, and date functions allow date arithmetic and formatting of dates.
SQL (Structured Query Language) is a standard language for accessing and manipulating databases. It allows users to execute queries against a database, retrieve data from a database, insert records into a database, update records in a database, and delete records from a database. Common SQL statements include SELECT to retrieve data, INSERT to add data, UPDATE to modify data, DELETE to remove data, and CREATE/ALTER to manage tables and databases.
SQL functions allow users to perform calculations on data, modify individual data items, manipulate output for groups of rows, and format dates and numbers for display. Functions are divided into several groups including single row functions, aggregate functions, analytic functions, object reference functions, and user-defined functions. Single row functions can execute the same operation for every row retrieved by a query.
Introduction to Oracle Functions--(SQL)--Abhishek Sharmaअभिषेक शर्मा
Functions make query results easier to understand and manipulate data values. There are two categories of functions: single row/scalar functions that return one value per row, and group/aggregate functions that operate on sets of values to return a single result. The GROUP BY clause groups rows based on columns and is used with aggregate functions to return summary results for each group.
This document provides an overview of SQL functions in six categories: string, date, mathematical, aggregate, general, and converting data types. It describes common string, date, and mathematical functions and how to use them. Aggregate functions like COUNT, SUM, MIN, and MAX are also briefly covered. The ISNULL function is introduced as a way to handle null values gracefully.
Oracle Advanced SQL and Analytic FunctionsZohar Elkayam
Even though DBAs and developers are writing SQL queries every day, it seems that advanced SQL techniques such as multidimension aggregation and analytic functions still remain relatively unknown. In this session, we will explore some of the common real-world usages for analytic function and understand how to take advantage of this great and useful tool. We will deep dive into ranking based on values and groups, understand aggregation of multiple dimensions without a group by, see how to do inter-row calculations, and much more.
This is the presentation slides which was presented in Kscope 17 on June 28, 2017.
This document discusses SQL functions and operators. It provides examples of numeric, date, string and text functions. Numeric functions include ABS, CEIL, FLOOR, TRUNC, ROUND and more. Date functions include SYSDATE, ADD_MONTHS, MONTHS_BETWEEN. String functions include UPPER, LOWER, LENGTH, SUBSTR. Operators covered are arithmetic (+,-, etc.), comparison (=, <, etc.), and logical (OR, AND, NOT). Examples are given of how to use each function and operator in SQL queries and updates.
SQL is a language used to interface with relational databases. It allows users to create, modify and delete database structures and data. Key features include using commands like SELECT, INSERT, UPDATE and DELETE. SQL follows specific syntax rules and uses delimiters like semicolons. It supports various data types and operators to perform queries and manipulations. Common SQL statements are used for data definition (DDL), data manipulation (DML), and data control (DCL).
MySQL is an open-source relational database management system based on SQL. It allows users to create, modify, and access database tables using standard SQL commands. Basic MySQL commands include CREATE TABLE, DROP TABLE, SELECT, INSERT, UPDATE, and DELETE.
Are you an Oracle developer or a DBA?
Do you know the difference between aggregate and analytic functions?
Without complex sub-queries or self-joins, do you know how to:
Calculate running/cumulative totals and moving/centered averages?
List products with revenues above or below their peers or product groups?
Compute the ratio of one category’s sales to the total sales?
Select the Top-N or Top N % of the customers/products?
Classify advertisers into quartiles/n-tiles based on the revenue potential?
Compare period-over-period (year-over-year, month-over-month) growth and rank advancement?
Convert rows into columns (pivot), columns into rows (unpivot) or aggregate strings?
Perform what-if analysis and hypothetical ranking?
Analytic functions are more performant because tables need to be scanned only once. They make you more productive because there is no need to write procedural code. No wonder Tom Kyte, a well-respected Oracle guru, says analytic functions are the best thing to happen after the sliced bread.
In the first half, I will cover the basics of the various analytic functions:
Ranking: RANK, DENSE_RANK, ROW_NUMBER, NTILE, CUME_DIST, PERCENTILE_RANK
Windowing: SUM, AVG, MAX, MIN, FIRST_VALUE, LAST_VALUE
Reporting: RATIO_TO_REPORT
Others: FIRST/LAST, LEAD/LAG, hypothetical ranking,
In the second half, I will show how powerful these functions are with a few examples.
If there is time, I will cover enhanced aggregation (ROLLUP, CUBE, GROUPING SET extensions to GROUP BY clause)
This class would be useful for both developers and DBAs alike, especially for those working in Analytic, Business Intelligence, and Datawarehouse environments.
Are you already an expert in analytic functions? Then come and help me refine the content.
For more info, read
http://download.oracle.com/docs/cd/E11882_01/server.112/e16579/analysis.htm
http://download.oracle.com/docs/cd/E11882_01/server.112/e16579/aggreg.htm
rollup, cross-tabulation across different dimensions using ROLLUP, CUBE and GROUPING SETS extension to GROUP BY clause
, most active time-periods (i.e. days when the most number of tickets are open in BZ, hours with the most take-off and landings, months with the highest sales, 5-minute periods with the maximum number of calls made, etc)
data densification?
their rank last year, this year, rank growth, running/cumulative total (Year-To-Date/Month-To-Date summation), moving averages, Year-Over-Year comparison, sales projection, average/min/max time between one sale and the next sale, products with above and below average sales.
overall average, sum, departmental average, sum, ranking, job wise ranking in one SQL.
This document discusses summary queries in SQL. It explains that summary queries are used to retrieve aggregate or summary information rather than details of individual records. It describes SQL column functions such as SUM, AVG, MIN, MAX, COUNT that can be used to summarize data. It also discusses GROUP BY and HAVING clauses that allow grouping and filtering of aggregated data. Subqueries and the CASE statement for conditional logic in SQL queries are also briefly covered.
A workshop hosted by the South African Journal of Science aimed at postgraduate students and early career researchers with little or no experience in writing and publishing journal articles.
Reimagining Your Library Space: How to Increase the Vibes in Your Library No ...Diana Rendina
Librarians are leading the way in creating future-ready citizens – now we need to update our spaces to match. In this session, attendees will get inspiration for transforming their library spaces. You’ll learn how to survey students and patrons, create a focus group, and use design thinking to brainstorm ideas for your space. We’ll discuss budget friendly ways to change your space as well as how to find funding. No matter where you’re at, you’ll find ideas for reimagining your space in this session.
How to Manage Your Lost Opportunities in Odoo 17 CRMCeline George
Odoo 17 CRM allows us to track why we lose sales opportunities with "Lost Reasons." This helps analyze our sales process and identify areas for improvement. Here's how to configure lost reasons in Odoo 17 CRM
This slide is special for master students (MIBS & MIFB) in UUM. Also useful for readers who are interested in the topic of contemporary Islamic banking.
Leveraging Generative AI to Drive Nonprofit InnovationTechSoup
In this webinar, participants learned how to utilize Generative AI to streamline operations and elevate member engagement. Amazon Web Service experts provided a customer specific use cases and dived into low/no-code tools that are quick and easy to deploy through Amazon Web Service (AWS.)
Exploiting Artificial Intelligence for Empowering Researchers and Faculty, In...Dr. Vinod Kumar Kanvaria
Exploiting Artificial Intelligence for Empowering Researchers and Faculty,
International FDP on Fundamentals of Research in Social Sciences
at Integral University, Lucknow, 06.06.2024
By Dr. Vinod Kumar Kanvaria
This presentation includes basic of PCOS their pathology and treatment and also Ayurveda correlation of PCOS and Ayurvedic line of treatment mentioned in classics.
How to Fix the Import Error in the Odoo 17Celine George
An import error occurs when a program fails to import a module or library, disrupting its execution. In languages like Python, this issue arises when the specified module cannot be found or accessed, hindering the program's functionality. Resolving import errors is crucial for maintaining smooth software operation and uninterrupted development processes.
LAND USE LAND COVER AND NDVI OF MIRZAPUR DISTRICT, UPRAHUL
This Dissertation explores the particular circumstances of Mirzapur, a region located in the
core of India. Mirzapur, with its varied terrains and abundant biodiversity, offers an optimal
environment for investigating the changes in vegetation cover dynamics. Our study utilizes
advanced technologies such as GIS (Geographic Information Systems) and Remote sensing to
analyze the transformations that have taken place over the course of a decade.
The complex relationship between human activities and the environment has been the focus
of extensive research and worry. As the global community grapples with swift urbanization,
population expansion, and economic progress, the effects on natural ecosystems are becoming
more evident. A crucial element of this impact is the alteration of vegetation cover, which plays a
significant role in maintaining the ecological equilibrium of our planet.Land serves as the foundation for all human activities and provides the necessary materials for
these activities. As the most crucial natural resource, its utilization by humans results in different
'Land uses,' which are determined by both human activities and the physical characteristics of the
land.
The utilization of land is impacted by human needs and environmental factors. In countries
like India, rapid population growth and the emphasis on extensive resource exploitation can lead
to significant land degradation, adversely affecting the region's land cover.
Therefore, human intervention has significantly influenced land use patterns over many
centuries, evolving its structure over time and space. In the present era, these changes have
accelerated due to factors such as agriculture and urbanization. Information regarding land use and
cover is essential for various planning and management tasks related to the Earth's surface,
providing crucial environmental data for scientific, resource management, policy purposes, and
diverse human activities.
Accurate understanding of land use and cover is imperative for the development planning
of any area. Consequently, a wide range of professionals, including earth system scientists, land
and water managers, and urban planners, are interested in obtaining data on land use and cover
changes, conversion trends, and other related patterns. The spatial dimensions of land use and
cover support policymakers and scientists in making well-informed decisions, as alterations in
these patterns indicate shifts in economic and social conditions. Monitoring such changes with the
help of Advanced technologies like Remote Sensing and Geographic Information Systems is
crucial for coordinated efforts across different administrative levels. Advanced technologies like
Remote Sensing and Geographic Information Systems
9
Changes in vegetation cover refer to variations in the distribution, composition, and overall
structure of plant communities across different temporal and spatial scales. These changes can
occur natural.
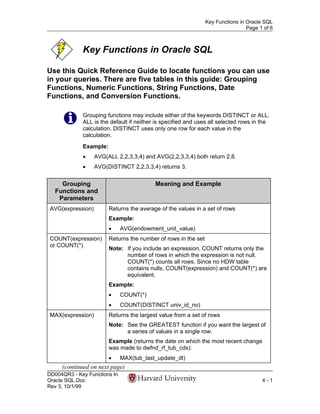
1. Key Functions in Oracle SQL
Page 1 of 6
Key Functions in Oracle SQL
Use this Quick Reference Guide to locate functions you can use
in your queries. There are five tables in this guide: Grouping
Functions, Numeric Functions, String Functions, Date
Functions, and Conversion Functions.
Grouping functions may include either of the keywords DISTINCT or ALL.
ALL is the default if neither is specified and uses all selected rows in the
calculation. DISTINCT uses only one row for each value in the
calculation.
Example:
• AVG(ALL 2,2,3,3,4) and AVG(2,2,3,3,4) both return 2.8.
• AVG(DISTINCT 2,2,3,3,4) returns 3.
Grouping Meaning and Example
Functions and
Parameters
AVG(expression) Returns the average of the values in a set of rows
Example:
• AVG(endowment_unit_value)
COUNT(expression) Returns the number of rows in the set
or COUNT(*)
Note: If you include an expression, COUNT returns only the
number of rows in which the expression is not null.
COUNT(*) counts all rows. Since no HDW table
contains nulls, COUNT(expression) and COUNT(*) are
equivalent.
Example:
• COUNT(*)
• COUNT(DISTINCT univ_id_no)
MAX(expression) Returns the largest value from a set of rows
Note: See the GREATEST function if you want the largest of
a series of values in a single row.
Example (returns the date on which the most recent change
was made to dwfnd_rf_tub_cds):
• MAX(tub_last_update_dt)
(continued on next page)
DD004QR3 - Key Functions In
Oracle SQL.Doc 4-1
Rev 3, 10/1/99
2. Key Functions in Oracle SQL
Page 2 of 6
Grouping Functions (continued)
Grouping Meaning and Example
Functions and
Parameters
MIN(expression) Returns the smallest value from a set of rows
Note: See the LEAST function if you want the smallest of a
series of values in a single row.
Example (returns the lowest rate used for fringe-benefit
assessments):
• MIN(fringe_assessment_rate)
SUM(expression) Adds the value for all rows in the query or for all rows with the
same values for columns listed in the GROUP BY clause
Example:
• SUM(pcard_transaction_distr_amt)
Numeric Meaning and Example
Functions and
Parameters
ABS(number) Removes the sign, if any, returning a positive value
Example (selects actual_amt values above 10,000 and below
–10,000):
• ABS(actual_amt) > 10000
GREATEST(value1, Returns the largest of the values in the list
value2, …)
Note: This function is used for multiple values in the same
row. See the MAX function if you want the largest
value from a group of rows.
Example:
• GREATEST(pcard_dt_modified, pcard_dt_reviewed)
LEAST(value1, Returns the smallest of the values in the list
value2, …)
Note: This function is used for multiple values in the same
row. See the MIN function if you want the smallest
value from a group of rows.
Example:
• LEAST(pcard_dt_modified, pcard_dt_reviewed,
pcard_swept_dt)
(continued on next page)
DD004QR3 - Key Functions
4-2 In Oracle SQL.Doc
Rev 3, 10/1/99
3. Key Functions in Oracle SQL
Page 3 of 6
Numeric Functions (continued)
Numeric Meaning and Example
Functions and
Parameters
ROUND(number, Rounds a value to the specified number of decimal places
decimal places)
Example:
• ROUND(123.456,2) returns 123.46
• ROUND(234567.00,-3) returns 235000
TRUNC(number, Cuts off a value at the specified number of decimal places
decimal places)
Example:
• TRUNC(123.456,2) returns 123.45
• TRUNC(234567.00,-3) returns 234000
String Functions Meaning and Example
and Parameters
string || string Concatenates string values
Note: The equivalent CONCAT function accepts only two
arguments and is more confusing in queries.
Example:
• vendor_city || ‘, ‘ || vendor_state || ‘ ‘ || vendor_postal_cd
INITCAP(string) Converts a string to initial capital letters
Note: This function will convert “a,” “an,” and “the” to “A,”
“An,” and “The.”
Example:
• INITCAP(vendor_name)
LENGTH(string) Returns the number of characters in a string
Example:
• LENGTH(full_name)
LOWER(string) Converts a string to all lowercase characters
Example:
• LOWER(view_name)
(continued on next page)
DD004QR3 - Key Functions In
Oracle SQL.Doc 4-3
Rev 3, 10/1/99
4. Key Functions in Oracle SQL
Page 4 of 6
String Functions (continued)
String Functions Meaning and Example
and Parameters
SUBSTR(string, Extracts a portion of a string
starting value,
Note: If the starting value is 0, it is treated as 1. If the
number of
starting-value is negative, Oracle counts backward
characters)
from the end of the string. If the starting value is
positive, Oracle counts forward from the beginning of
the string.
Example:
• SUBSTR(‘ABCDEF’,2,3) returns ‘BCD’
• SUBSTR(‘abcdef’,-4,3) returns ‘cde’
UPPER(string) Converts a string to all uppercase characters
Example:
• WHERE UPPER(lodging_location) LIKE ‘%CHICAGO%’
Date Functions Meaning and Example
and Parameters
ADD_MONTHS Adds the specified number of months to the date value
(date, number of (subtracts months if the number of months is negative)
months)
Note: If the result would be a date beyond the end of the
month, Oracle returns the last day of the resulting
month.
Example (selects expense reports not settled for more than
two months after trip end):
• WHERE report_gl_export_dt > ADD_MONTHS(report_
trip_end_or_expense_dt, 2)
LAST_DAY(date) Returns the last day of the month that contains the date
Example (returns ‘29-FEB-2000’):
• LAST_DAY(‘15-FEB-2000’)
(continued on next page)
DD004QR3 - Key Functions
4-4 In Oracle SQL.Doc
Rev 3, 10/1/99
5. Key Functions in Oracle SQL
Page 5 of 6
Date Functions (continued)
Date Functions Meaning and Example
and Parameters
MONTHS_ Returns the difference between two dates expressed as whole
BETWEEN(date1, and fractional months
date2)
Note: If date1 is earlier than date2, the result is negative.
The result also takes into account time differences
between the two values.
Example (returns 1.03225806):
• MONTHS_BETWEEN(‘02-FEB-2001’,’01-JAN-2001’)
NEXT_DAY(date, Returns the date of the first day of the specified name that is
day name) later than the date supplied
Example (returns ‘20-MAR-2001’):
• NEXT_DAY(‘14-MAR-2001’,’TUESDAY’)
ROUND (datetime, Returns the date-time rounded to the unit specified by the
format) format, or to the nearest day if no format is supplied
Note: For details on available formats, see the full
description of functions (below).
Example: (returns ‘01-JAN-2000’)
• ROUND(‘27-OCT-1999’, ‘YEAR’)
SYSDATE Returns the current date-time from the server where the
database is located
Example (returns rows posted the previous day):
• WHERE je_posted_dt = TRUNC(SYSDATE) – 1
TRUNC(datetime) Removes the time component from a date-time value
Note: This function has other truncating options. See the full
description of functions (below) for details.
Example:
• WHERE TRUNC(je_posted_dt) = ‘12-OCT-99’
DD004QR3 - Key Functions In
Oracle SQL.Doc 4-5
Rev 3, 10/1/99
6. Key Functions in Oracle SQL
Page 6 of 6
Conversion Meaning and Example
Functions and
Parameters
TO_CHAR(date, Converts a date to a string in the specified format
format)
Note: For details on available formats, see the full
description of functions (below).
Example:
• TO_CHAR(je_posted_dt, ‘Month DD, YYYY’)
TO_CHAR(number, Converts a number to a string in the specified format
format)
Example:
• TO_CHAR(fund_spec_invest_amt,’$9,999,999’)
TO_DATE(string, Converts a string to a date using the specified format
format)
Note: Oracle automatically converts dates in the standard
format of DD-MON-YYYY.
Example:
• TO_DATE(‘01-02-1999’, ‘DD-MM-YYYY’)
TO_NUMBER Converts a string to a number using the optional format if
(string, format) specified
Note: For details on available formats, see the full
description of functions (below).
Example:
• TO_NUMBER(‘100.00’,’9G999D99’)
• TO_NUMBER(TO_CHAR(je_posted_dt, ‘YYYY’))
This list includes only the most commonly used Oracle functions. To
download the full descriptions of all Oracle functions, navigate to the
Forms section of ABLE and choose Ad-Hoc Reporting Forms, then
Oracle Manuals.
DD004QR3 - Key Functions
4-6 In Oracle SQL.Doc
Rev 3, 10/1/99