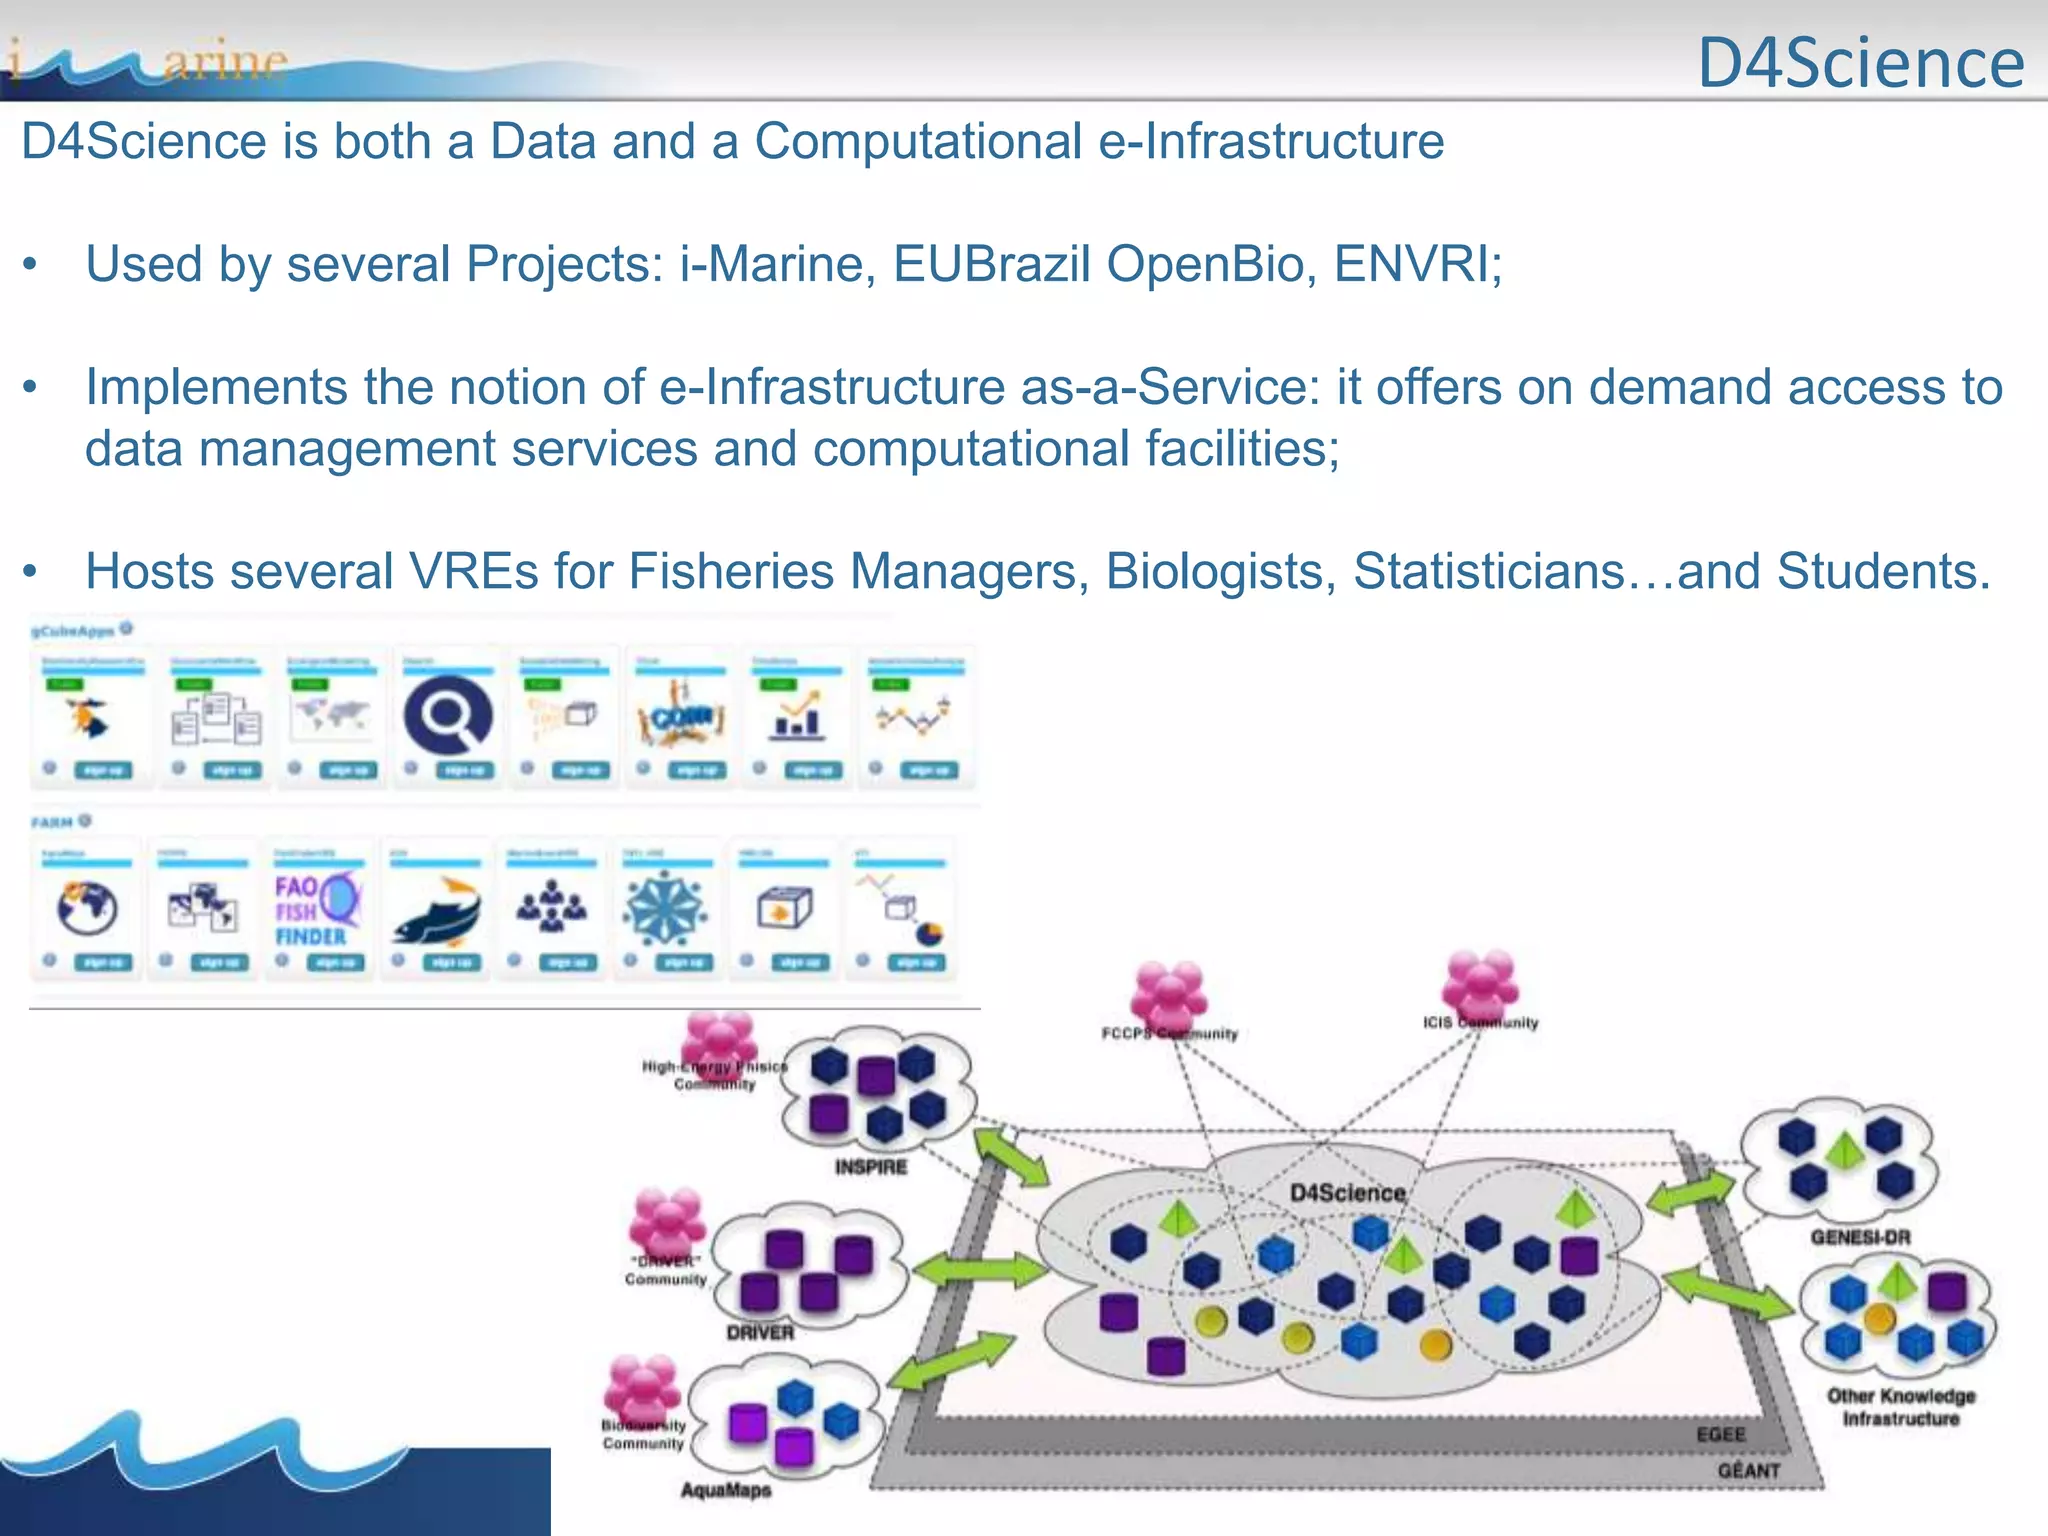
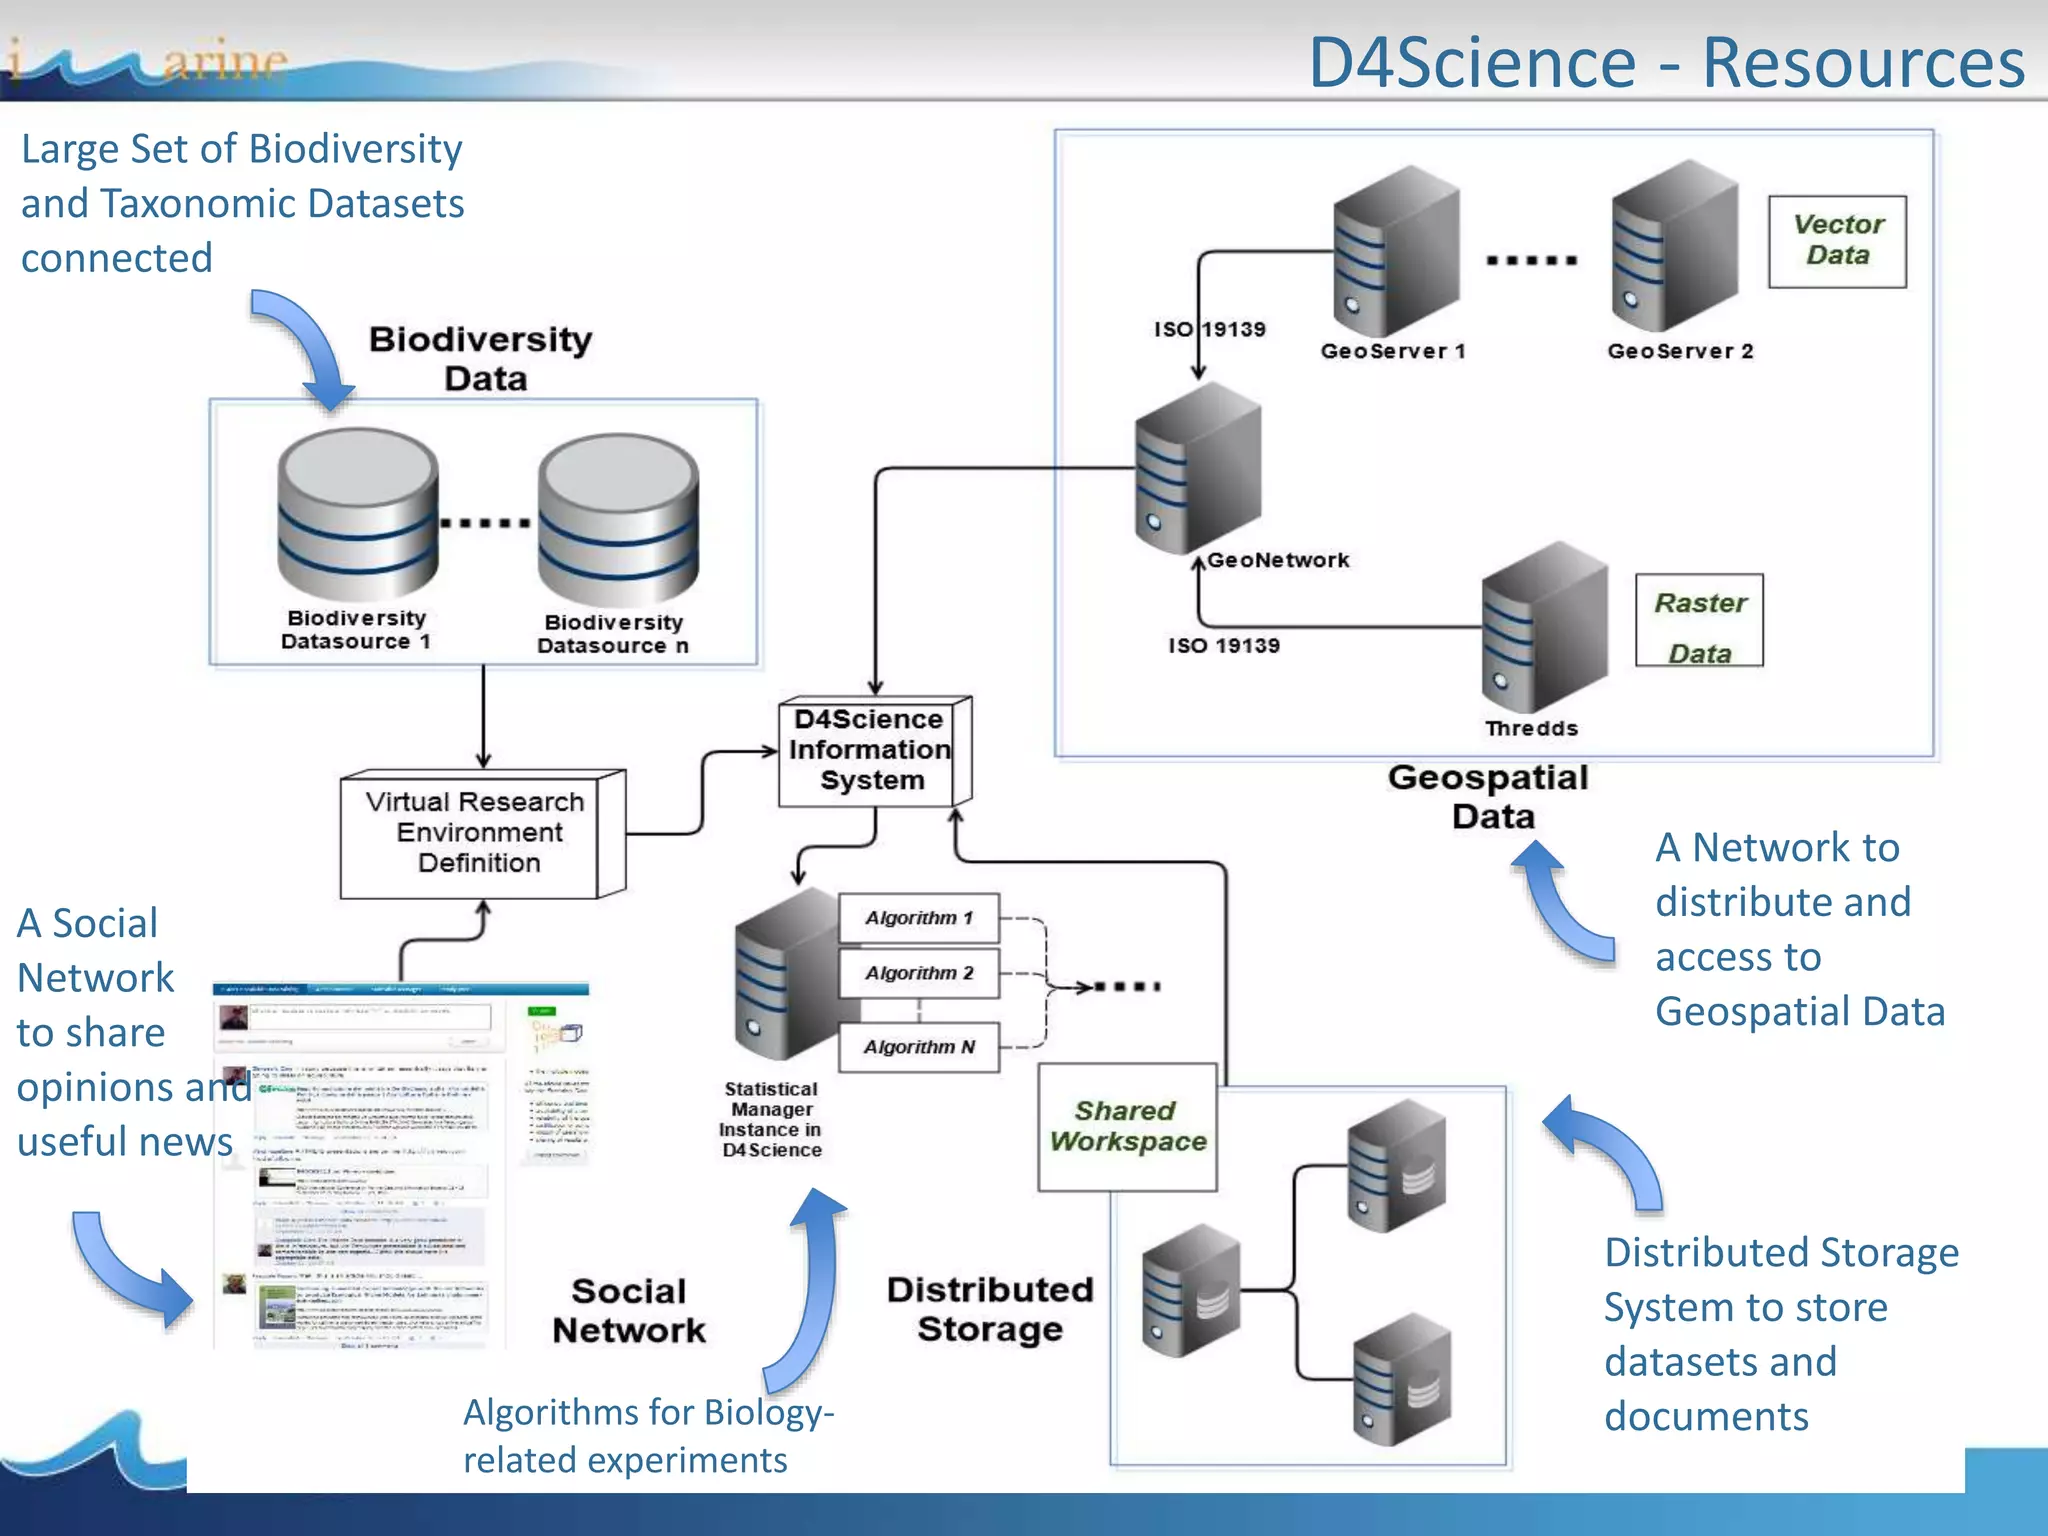
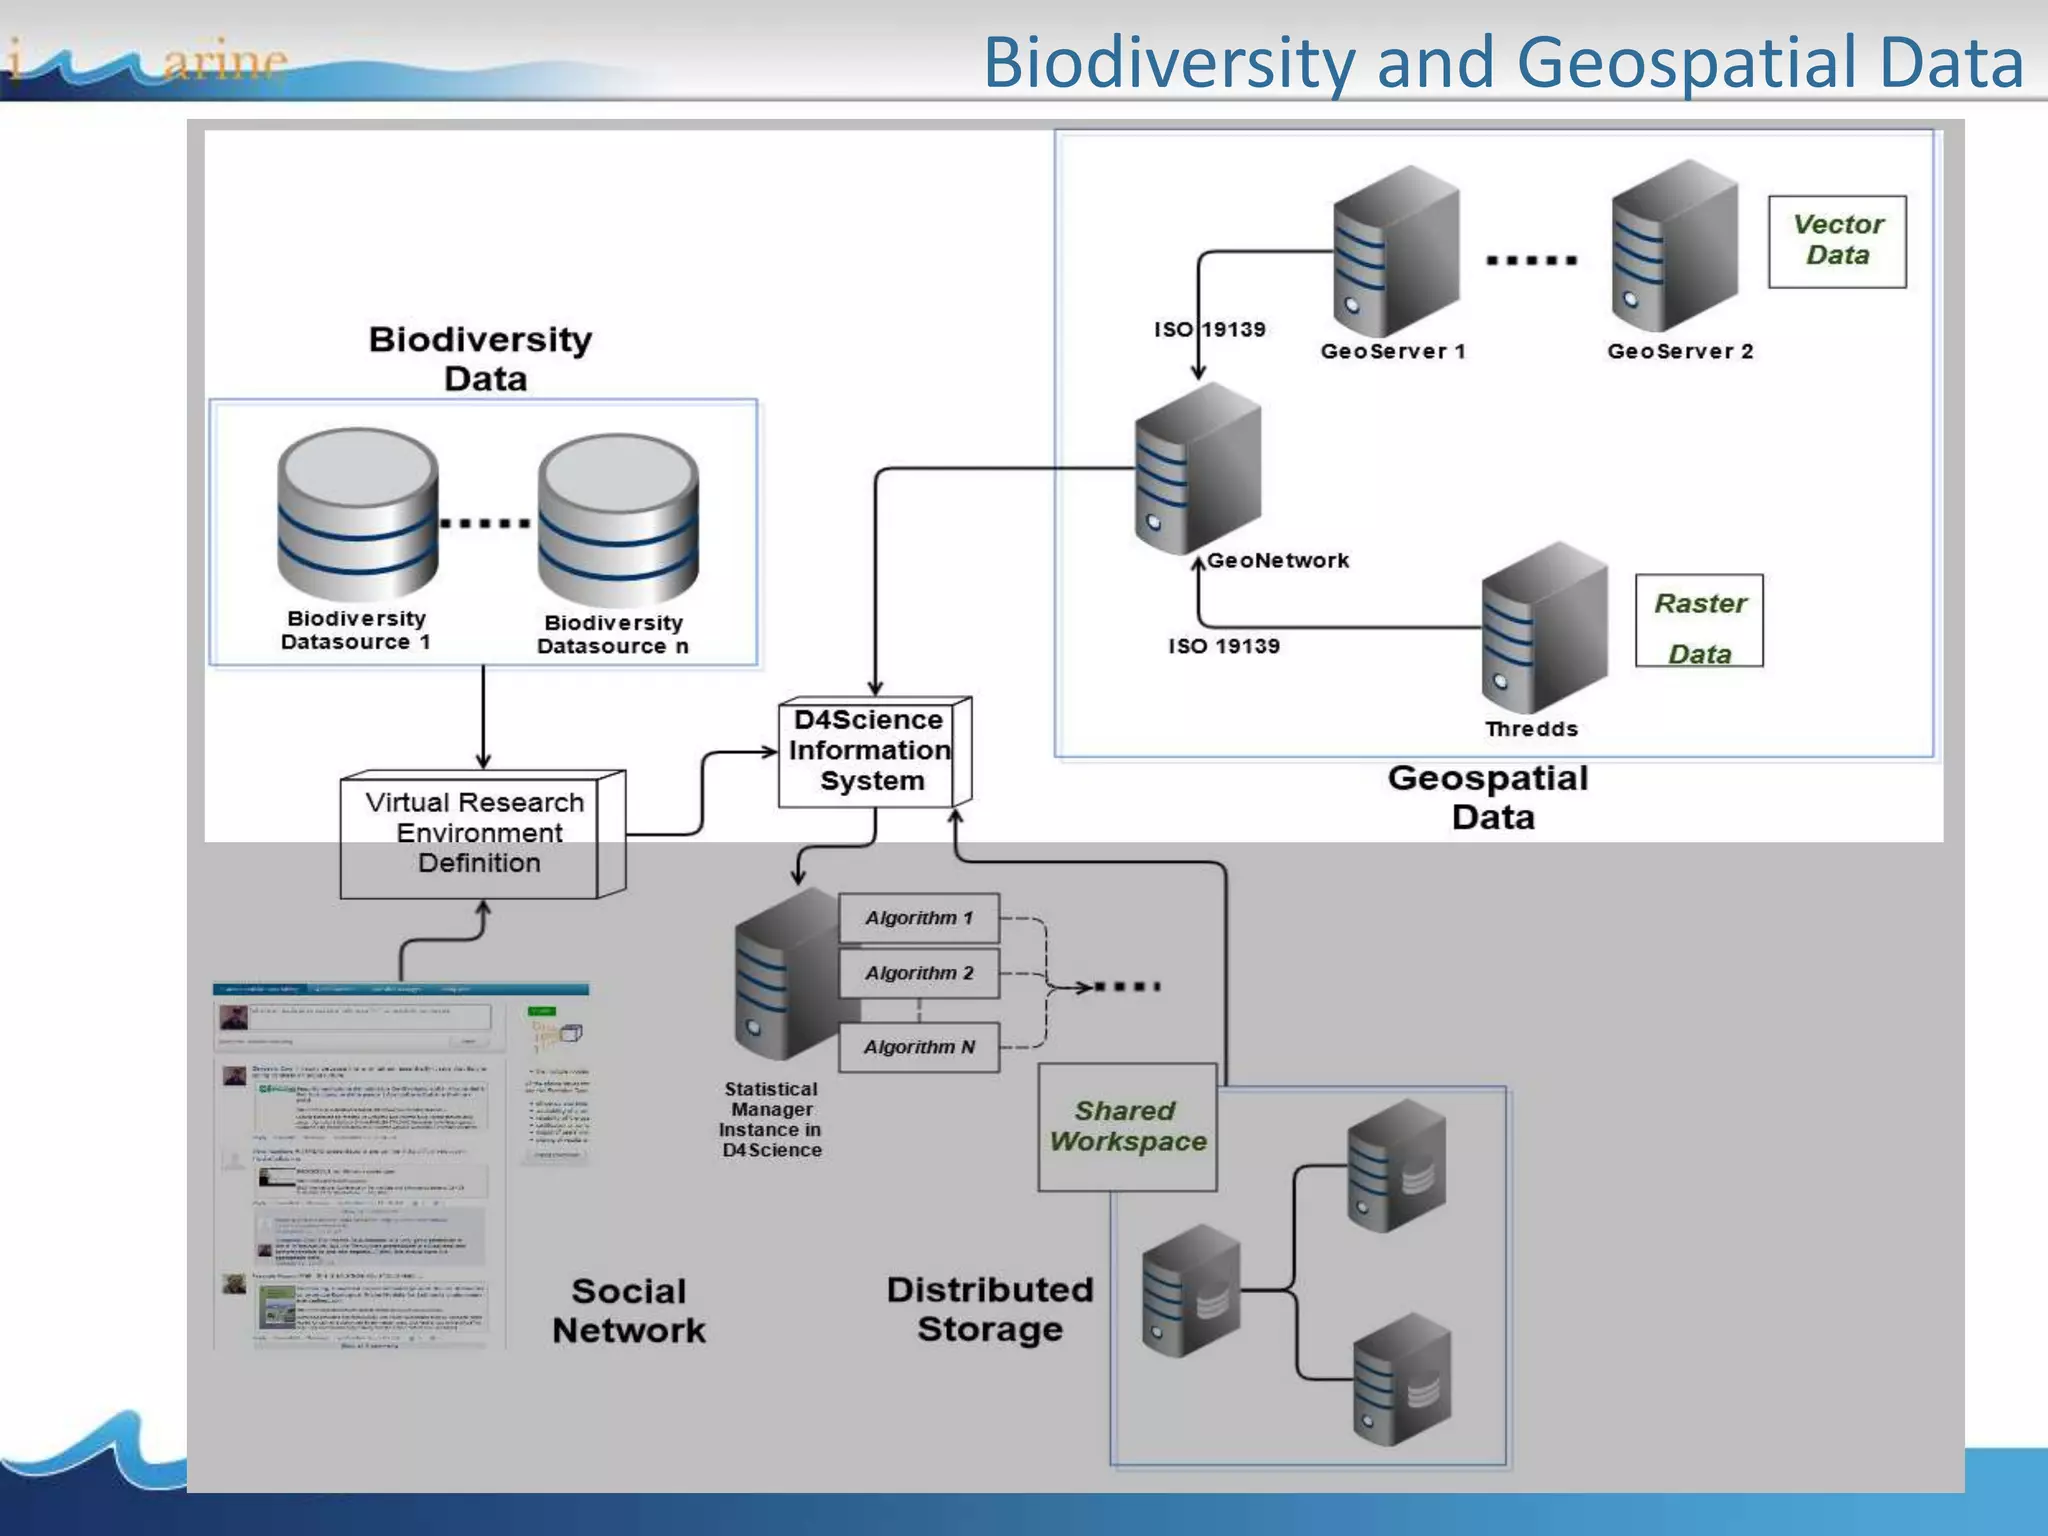
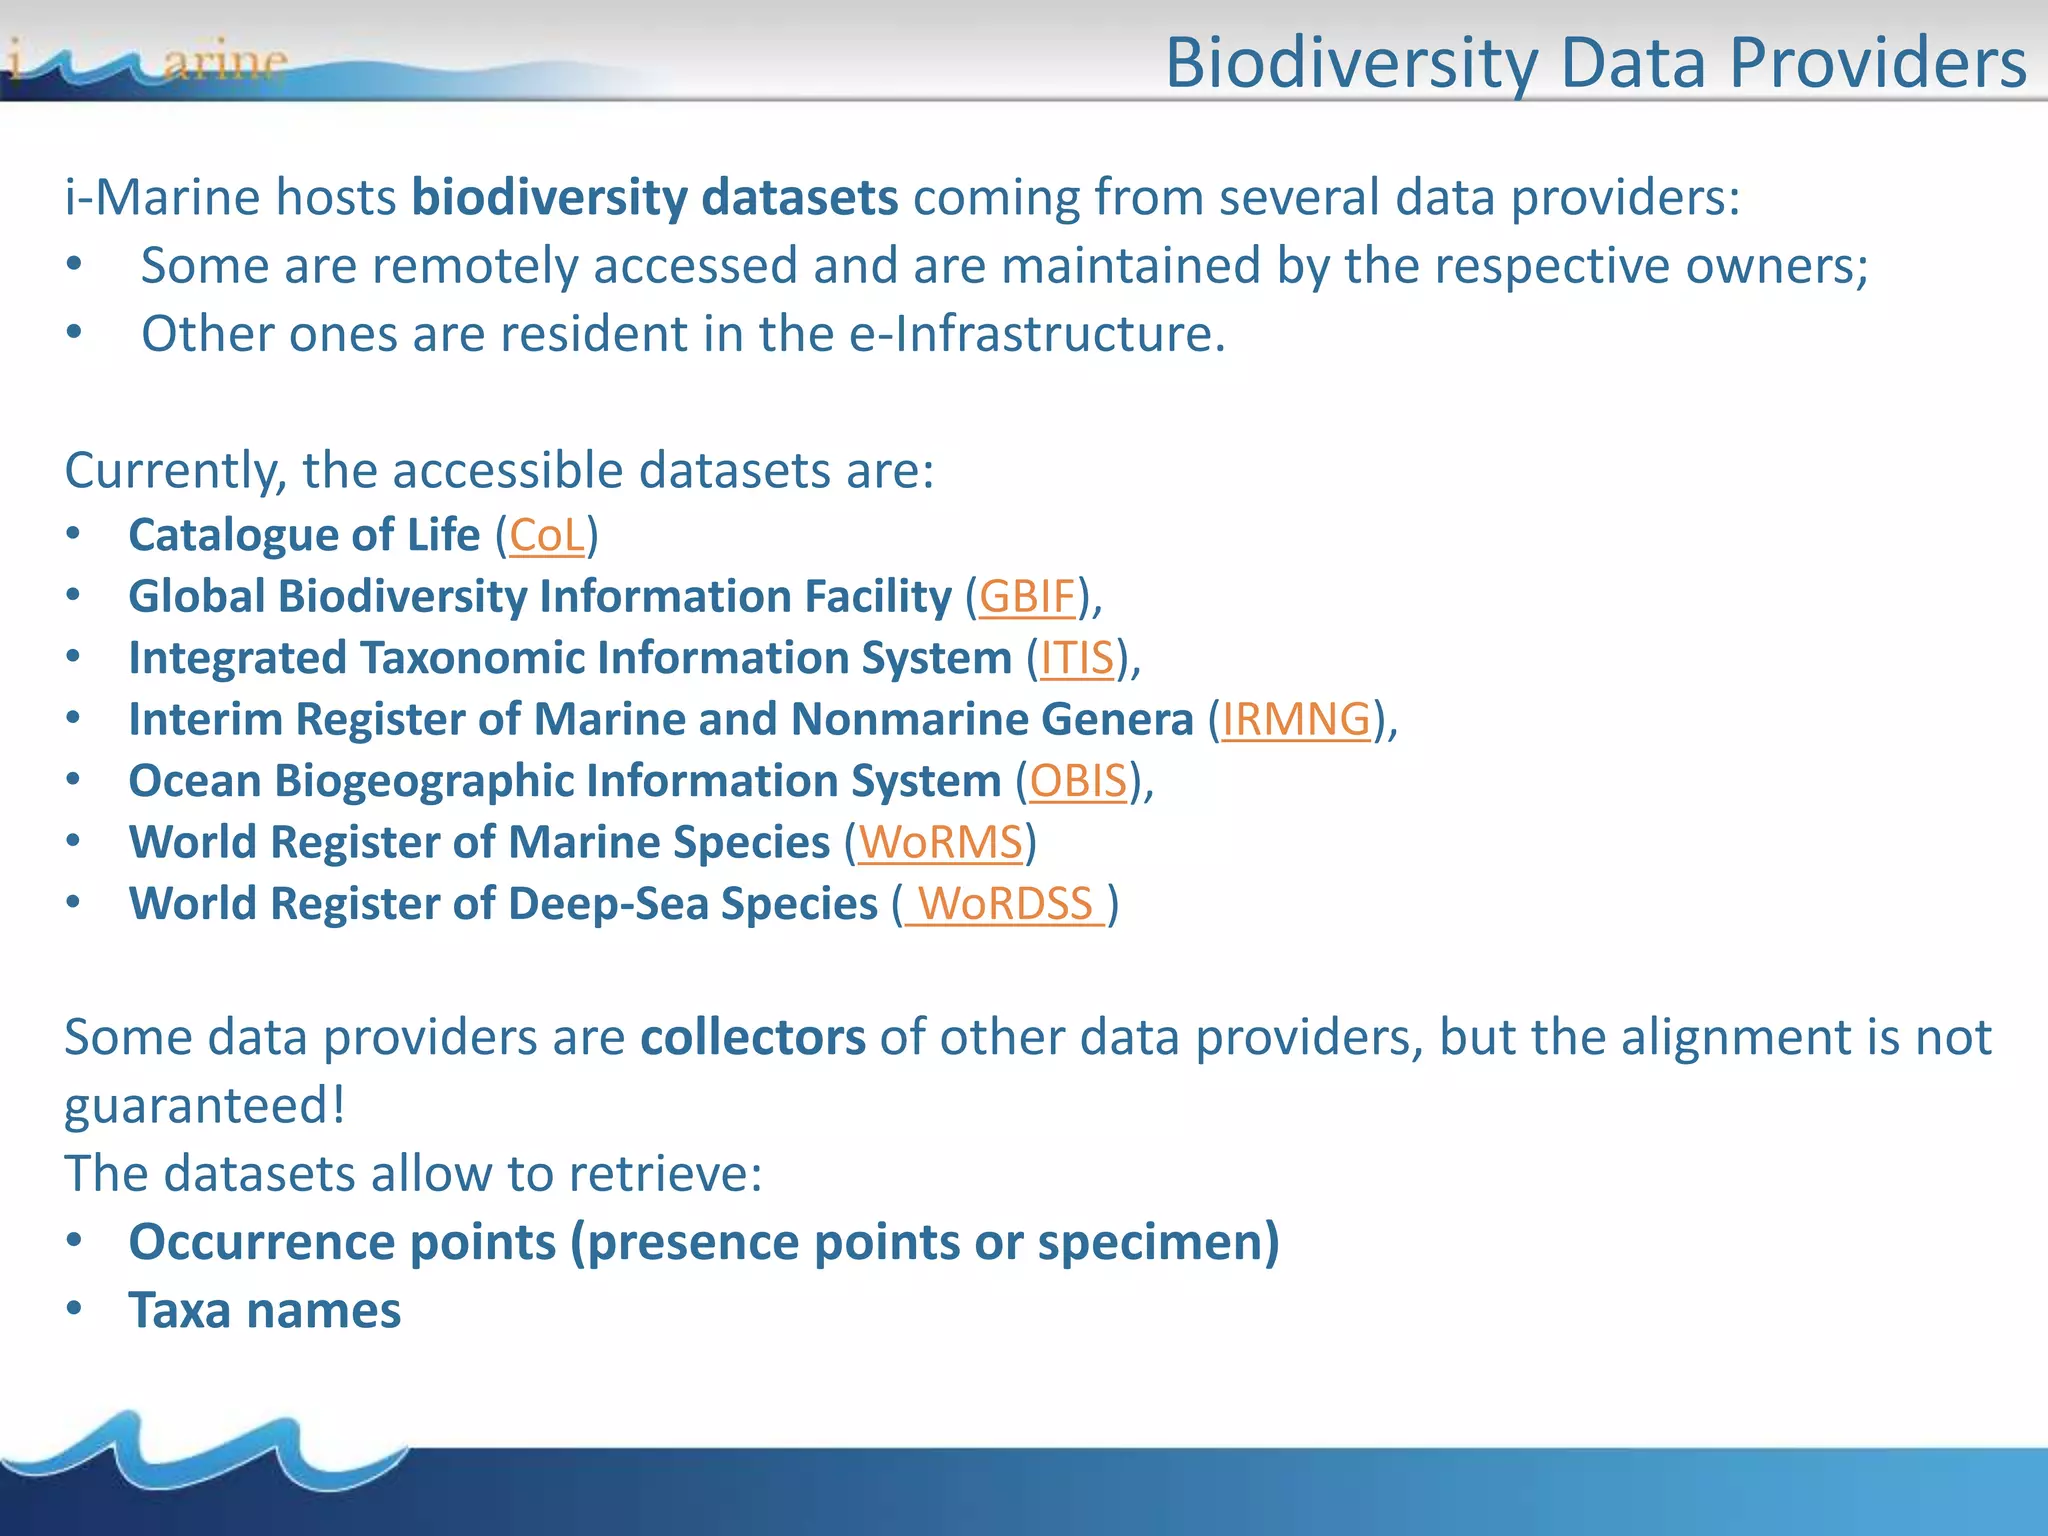
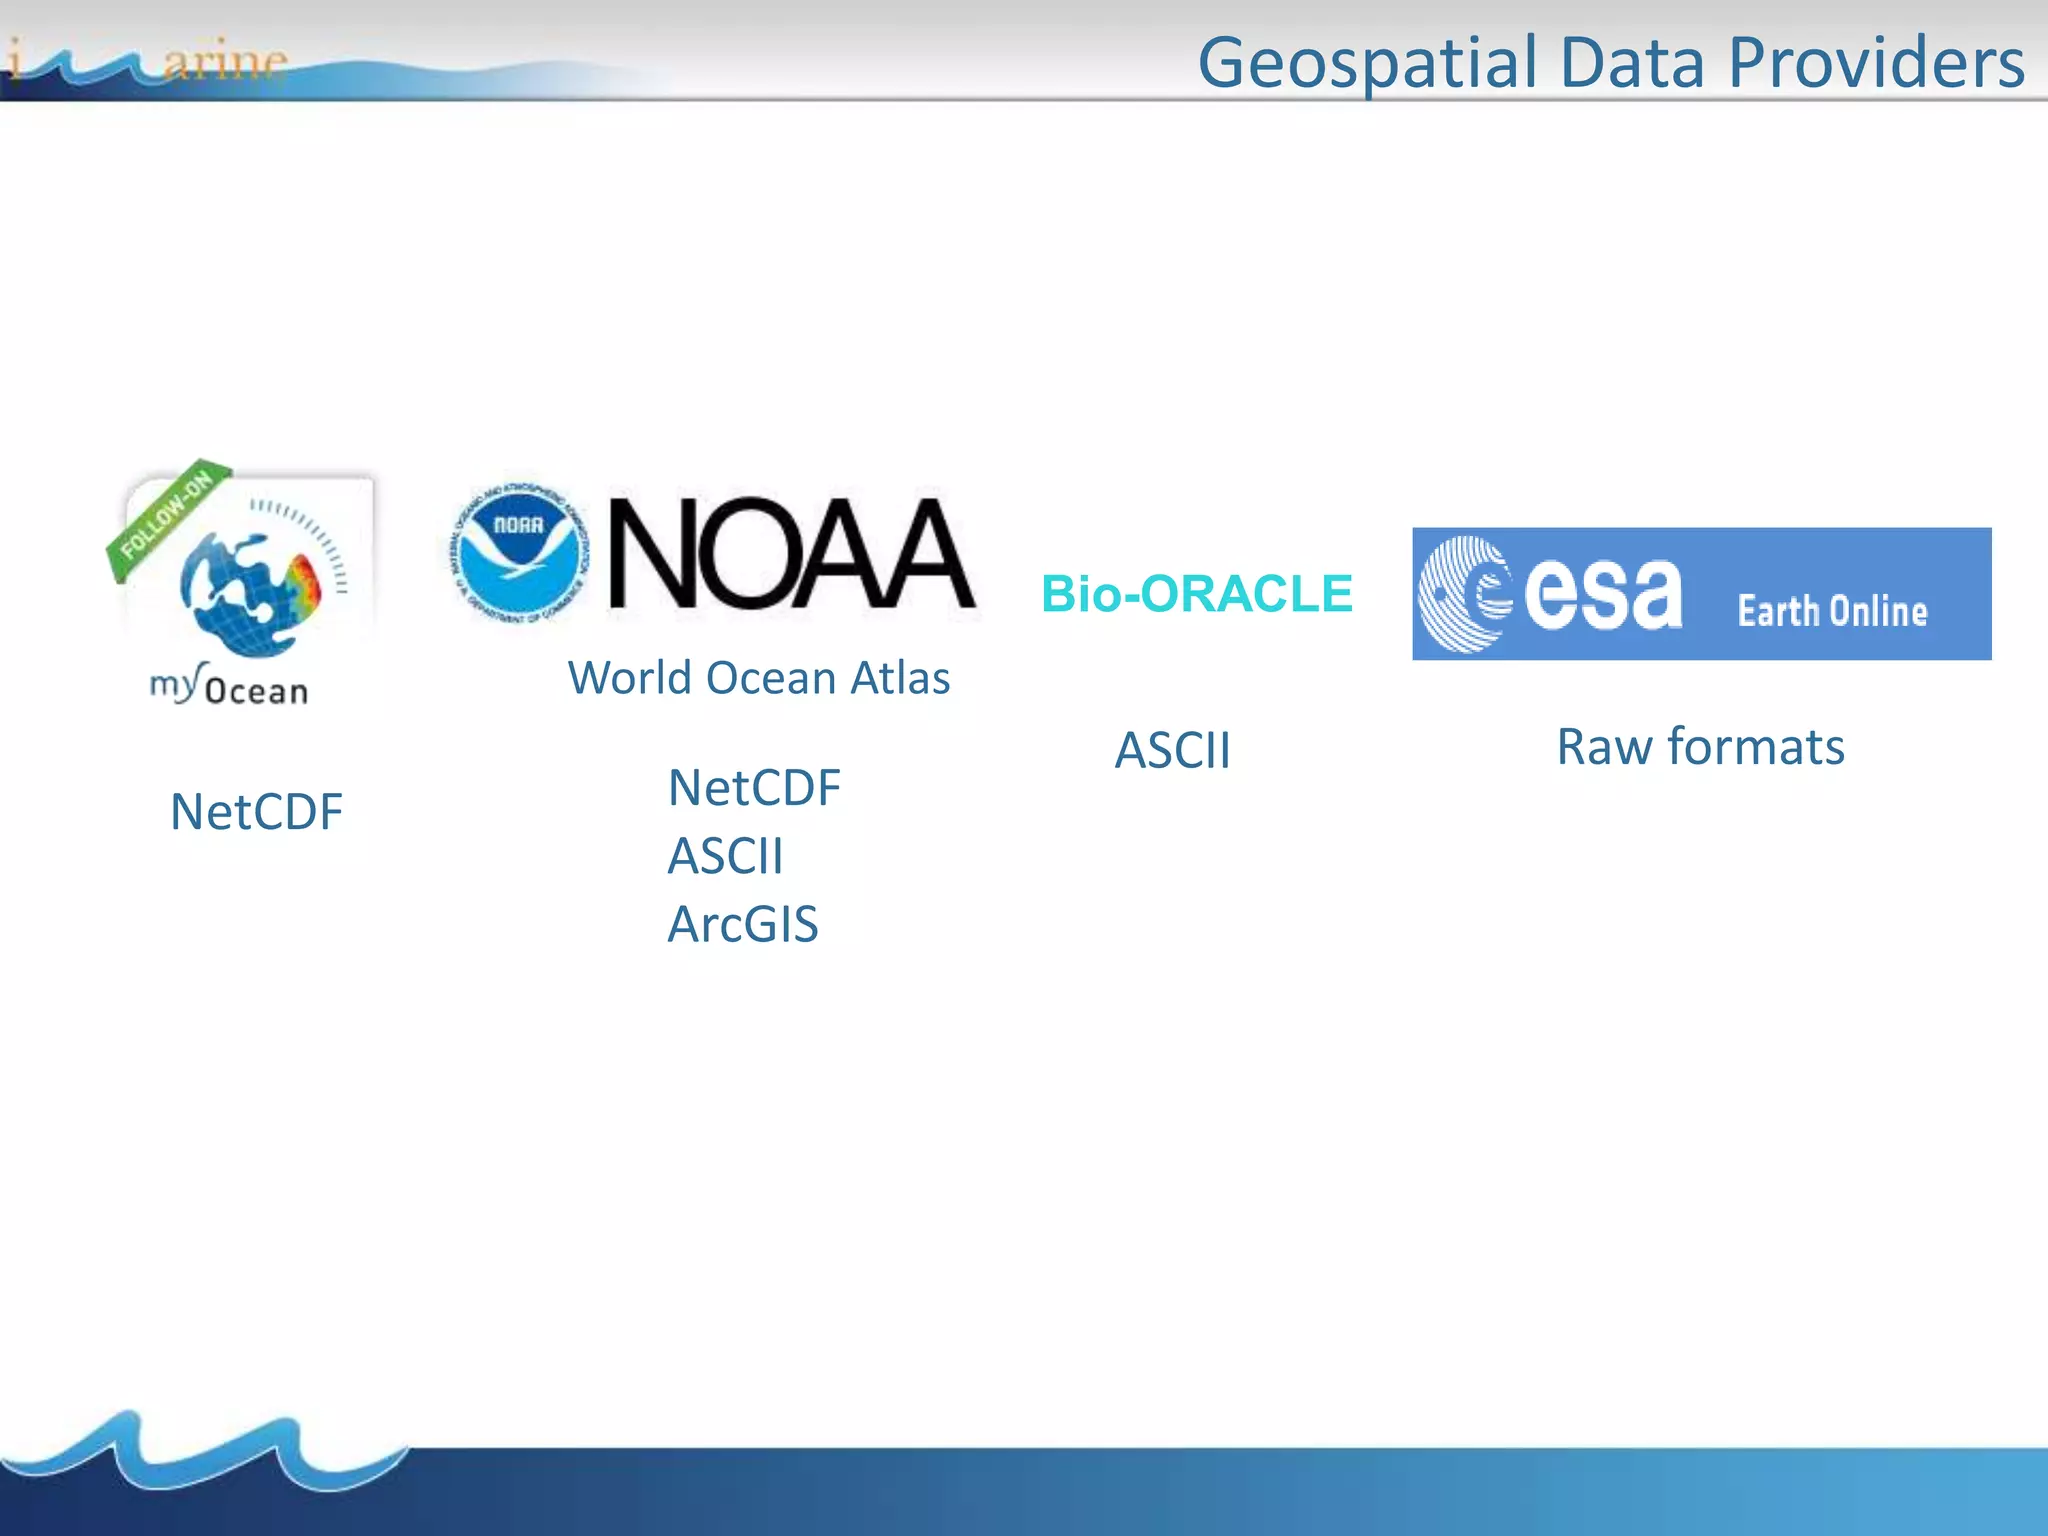
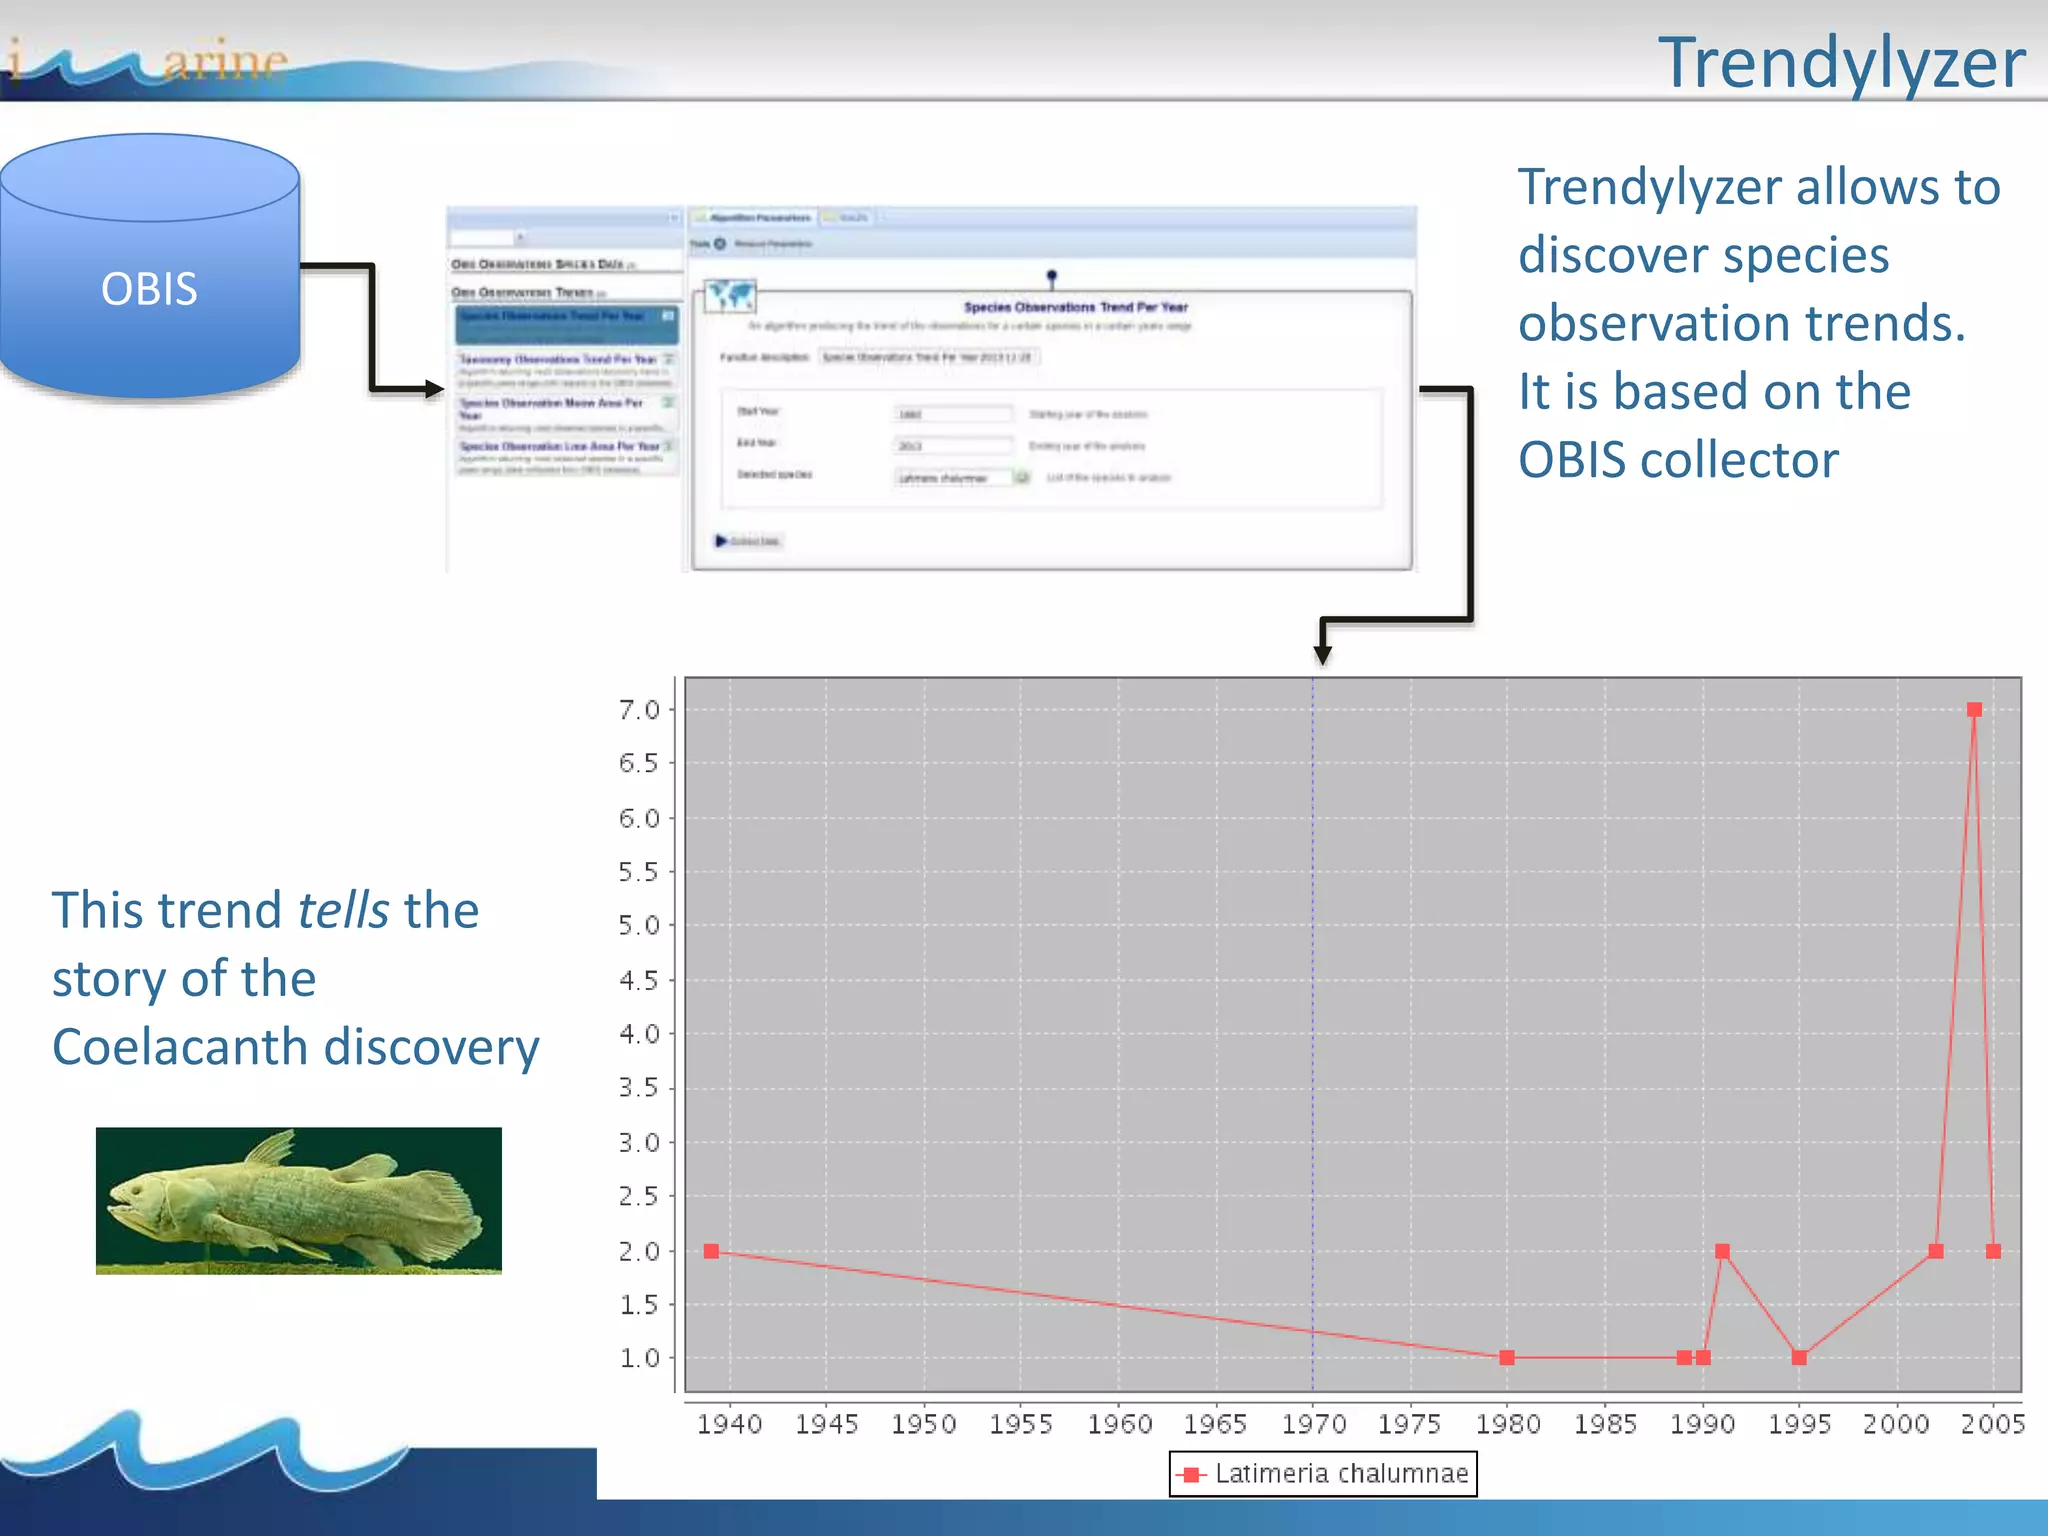
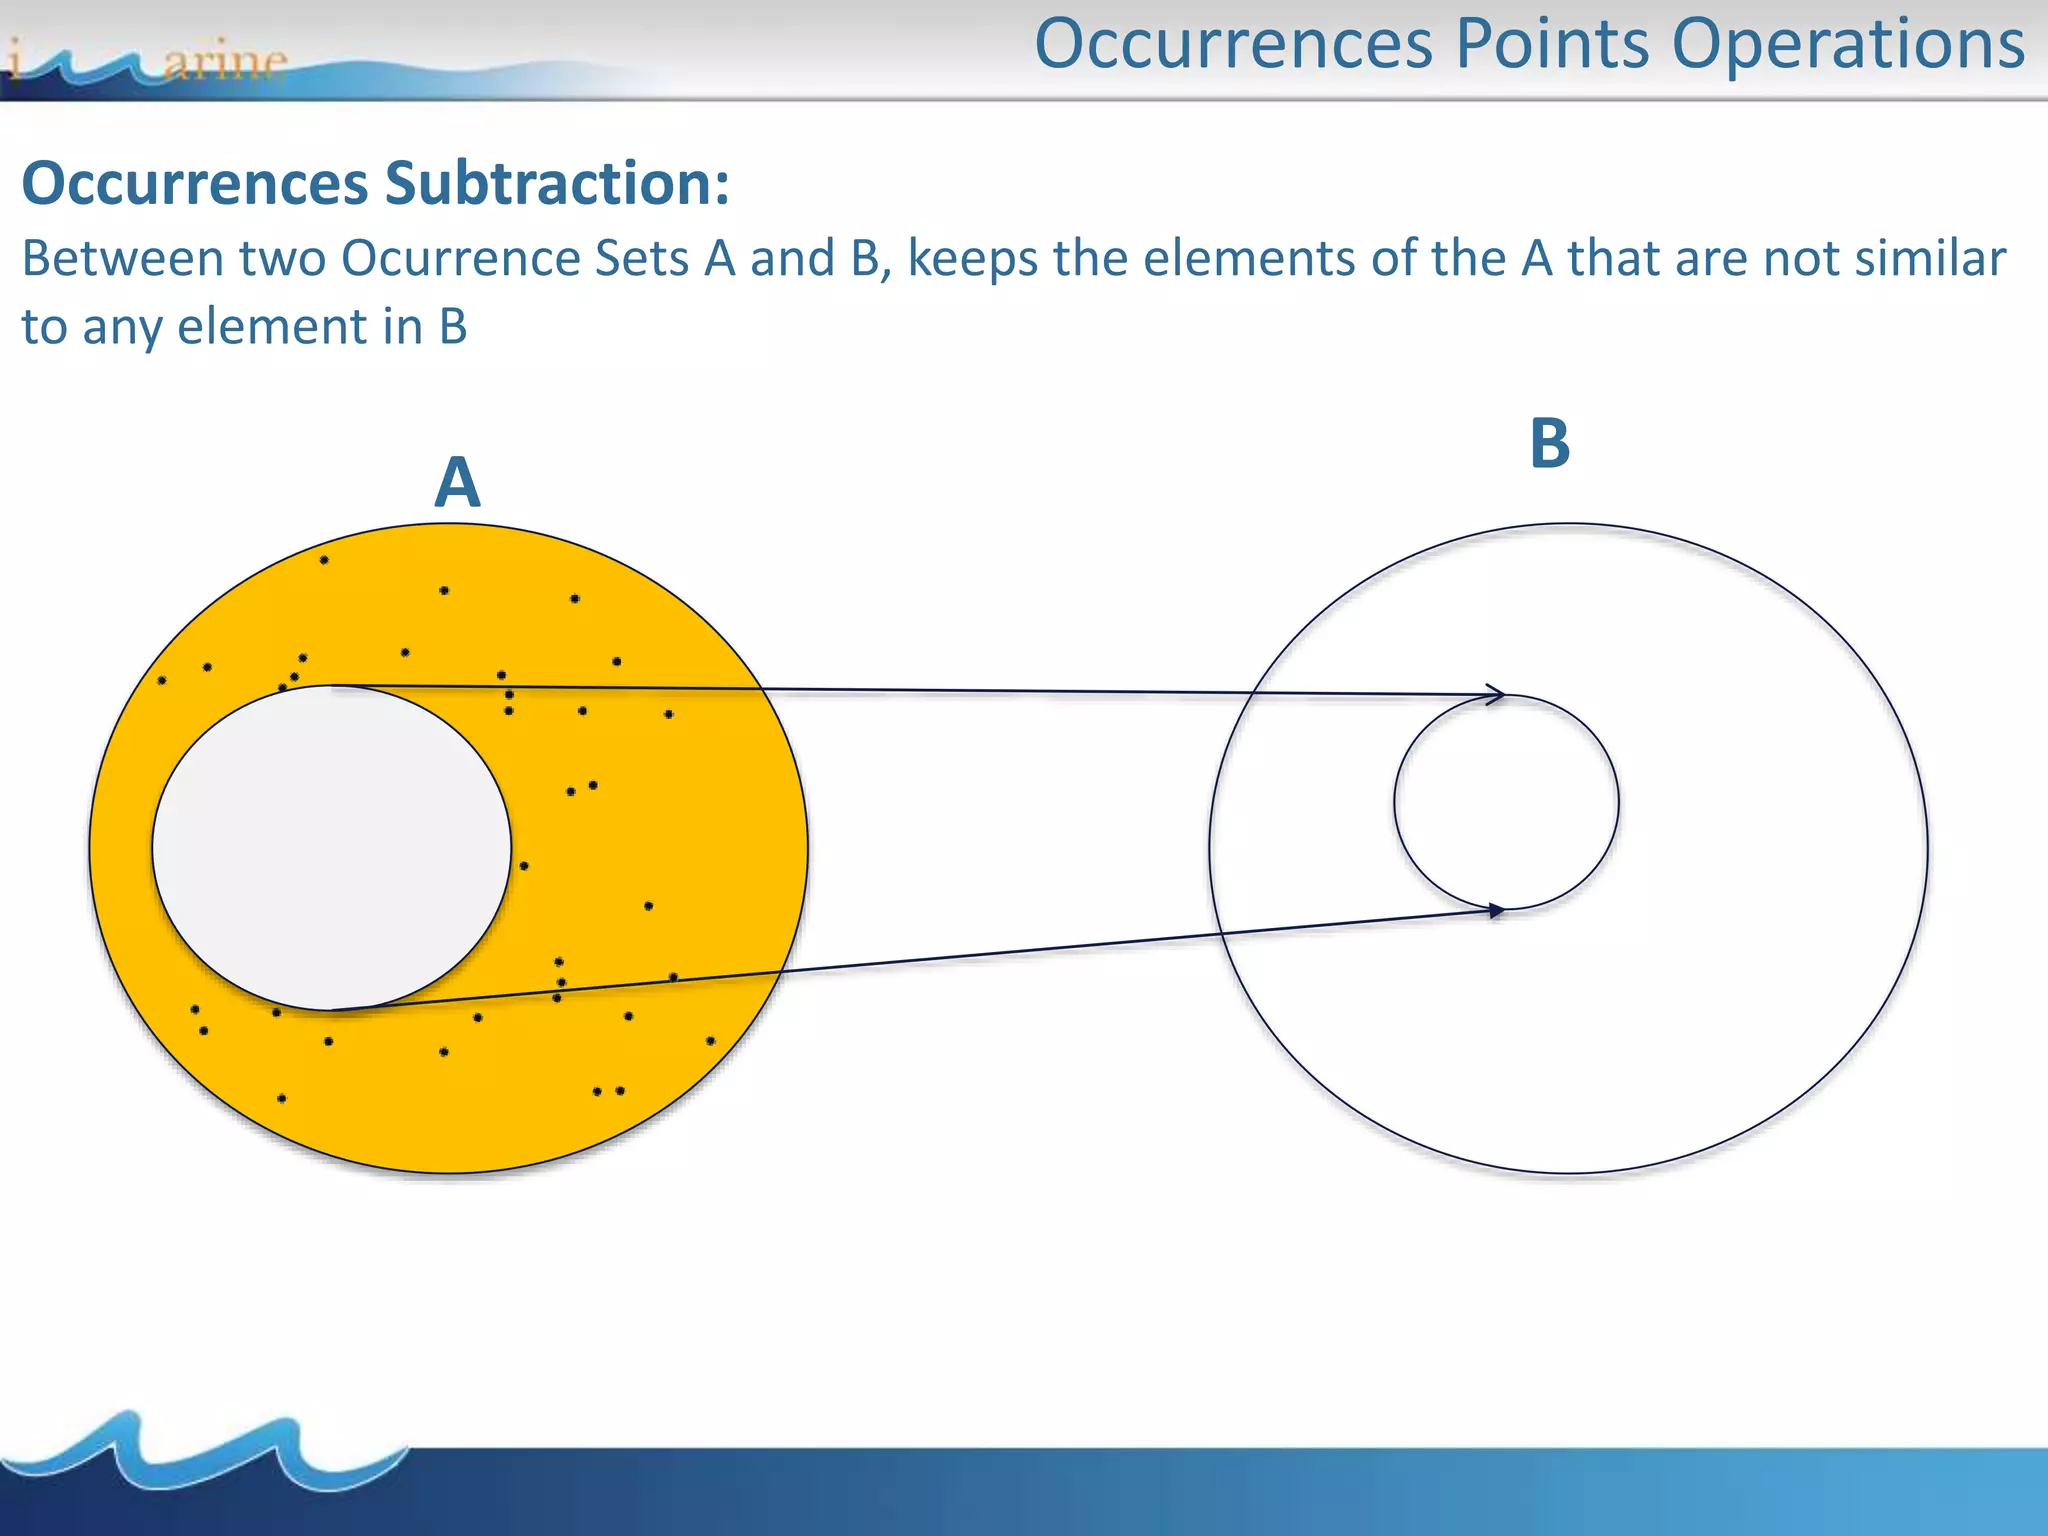
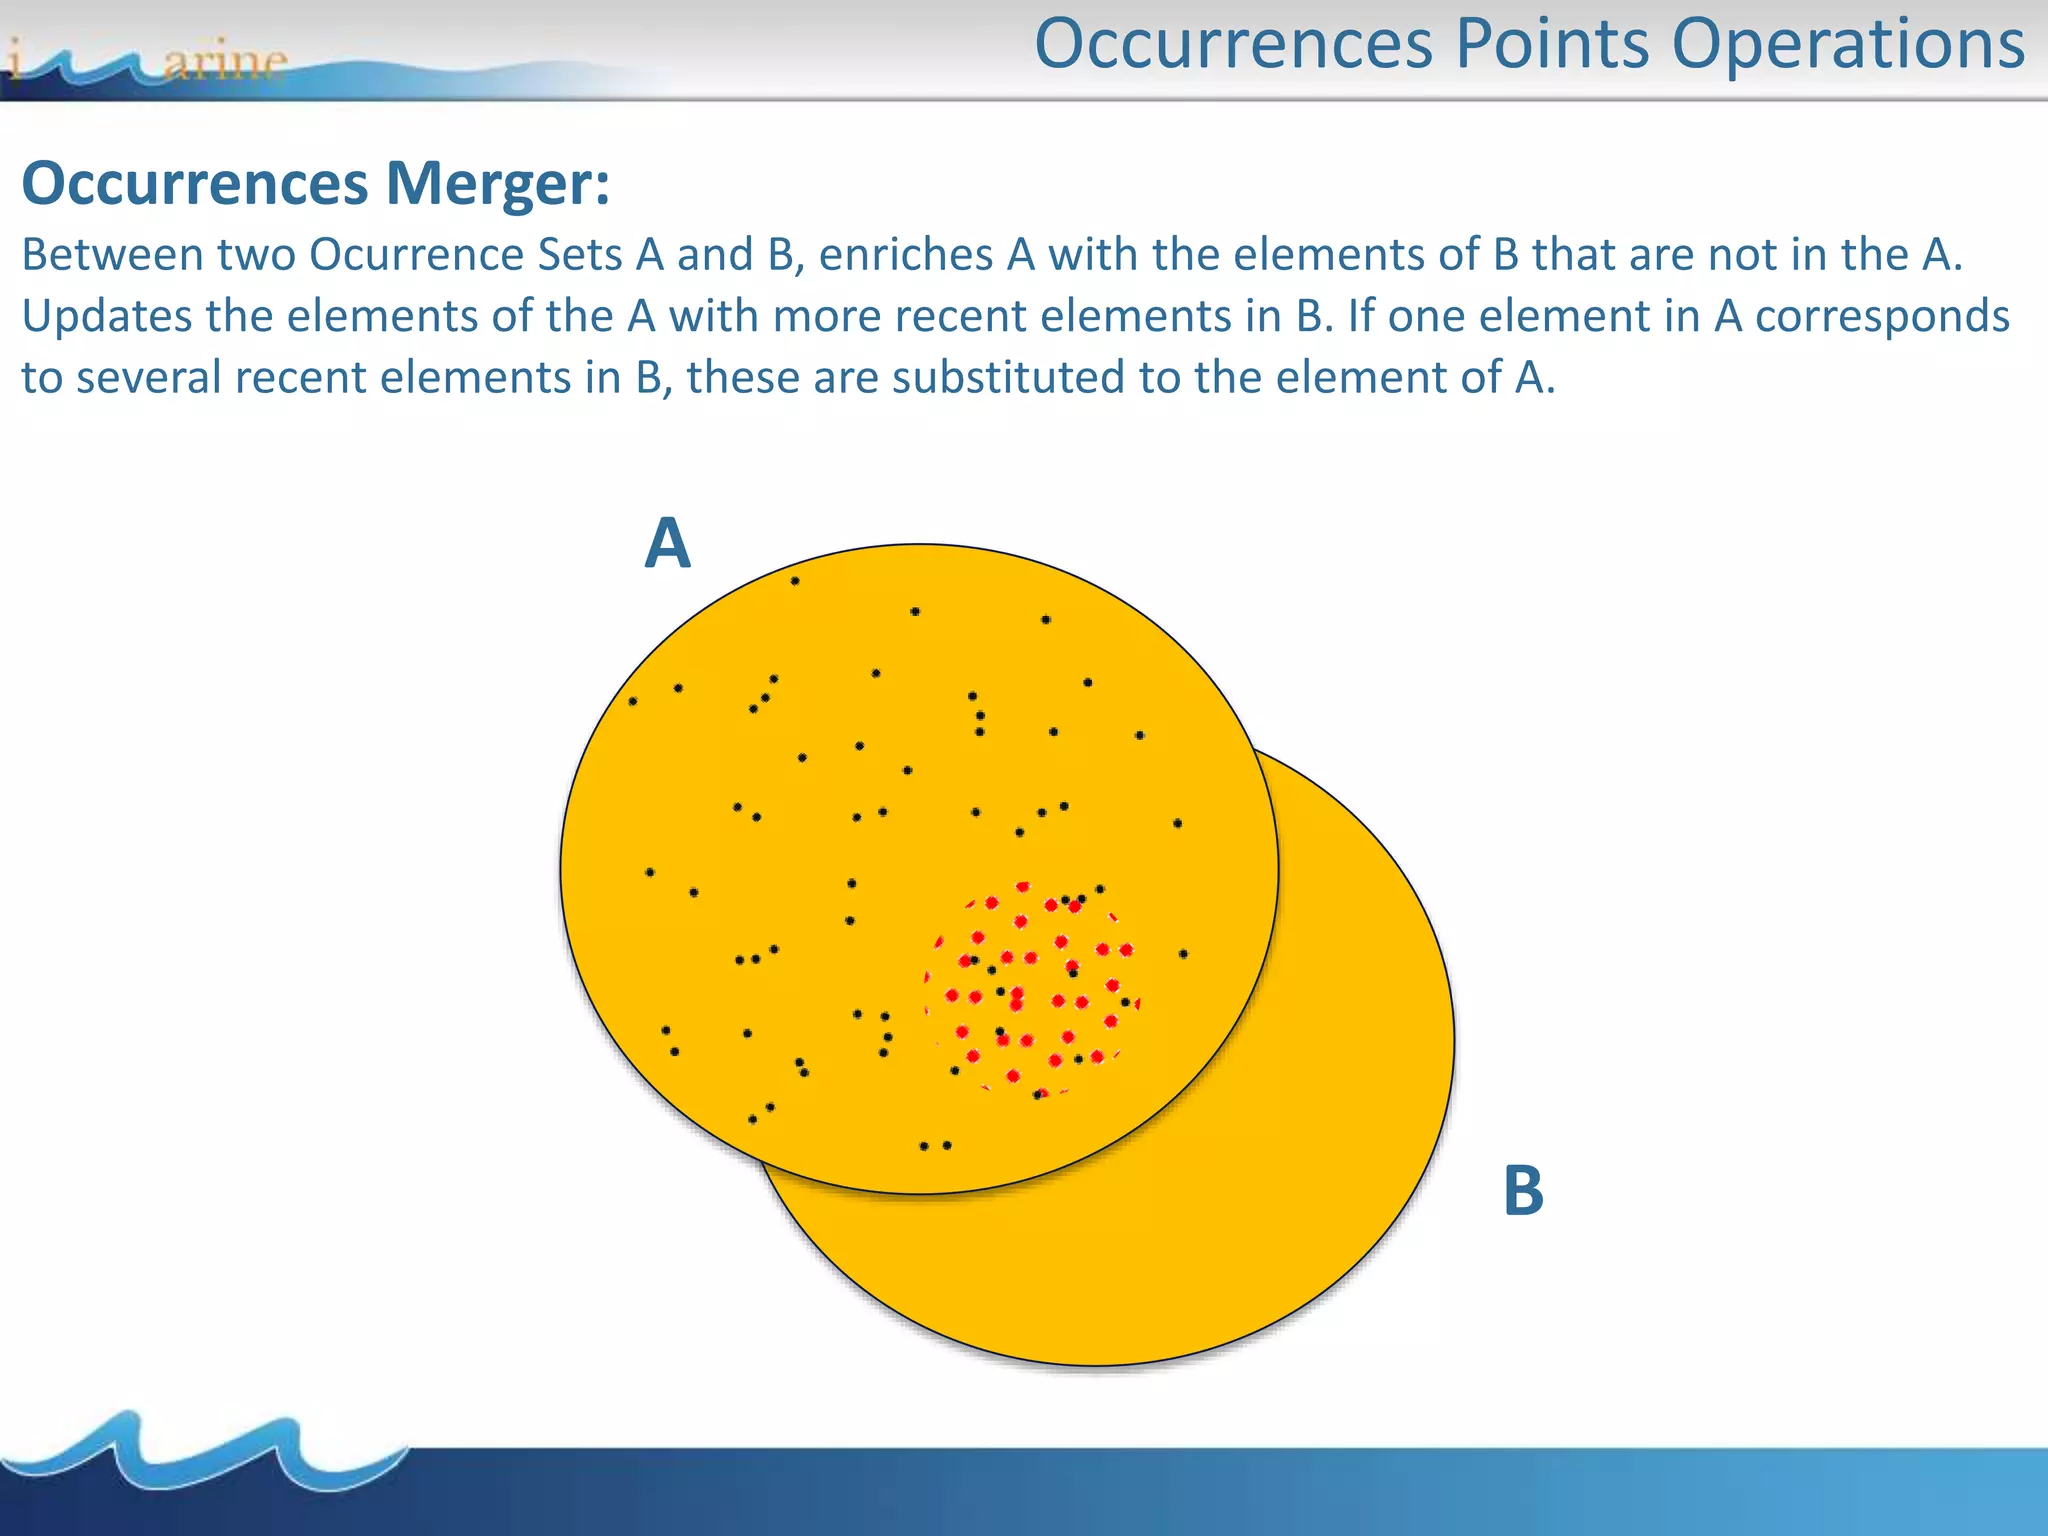
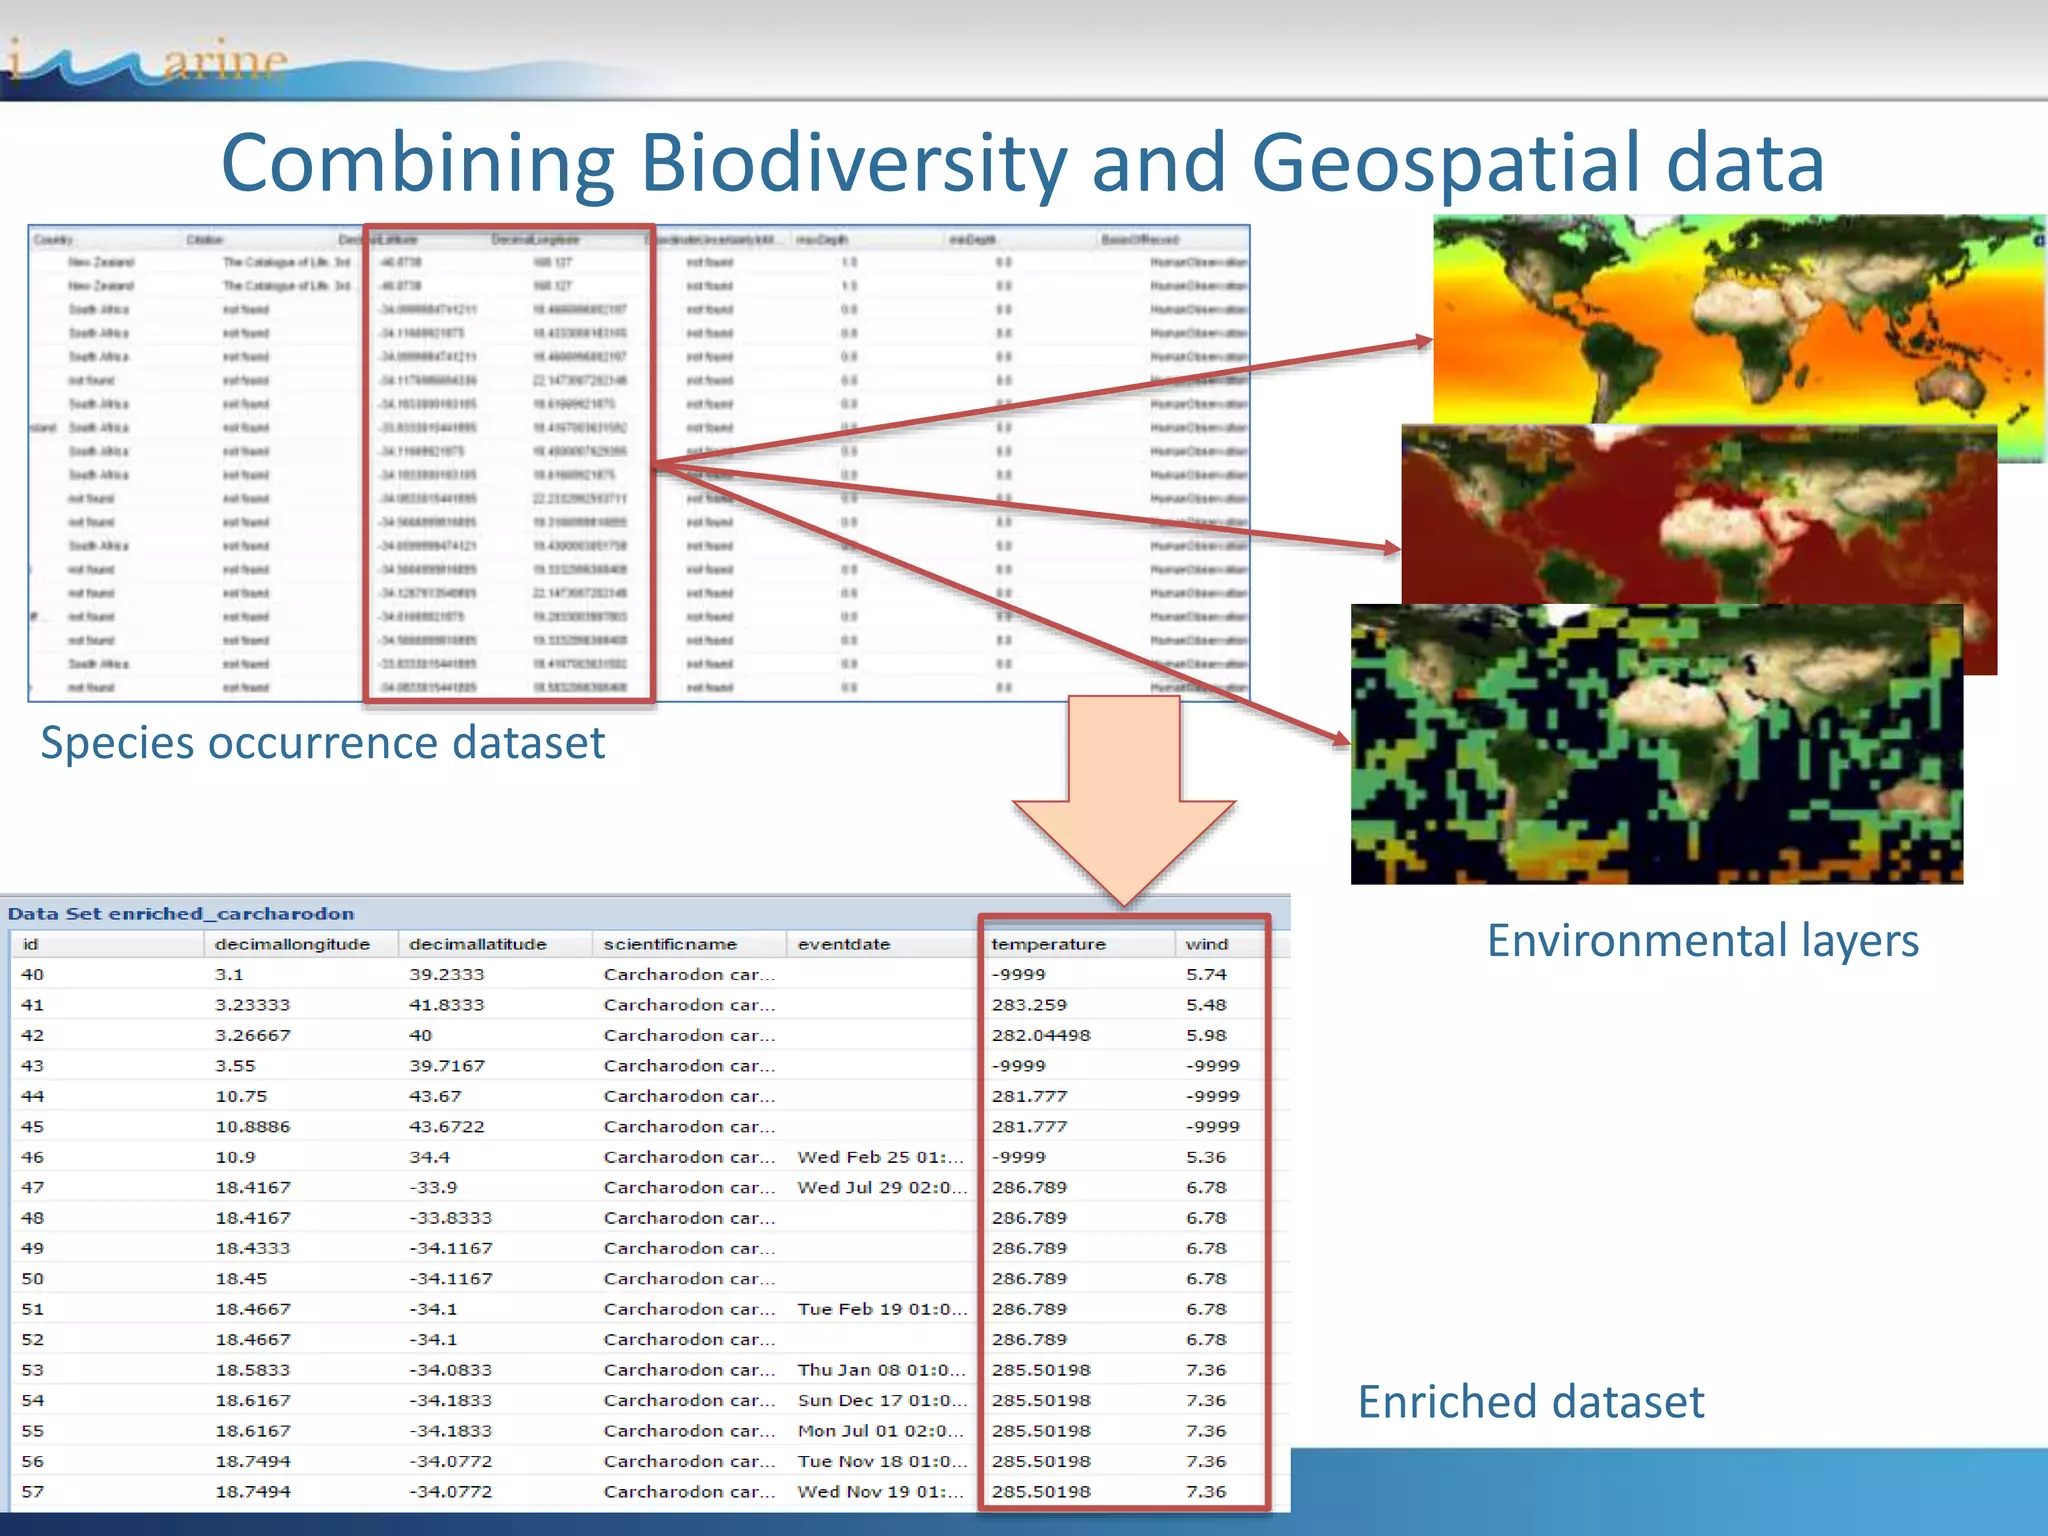
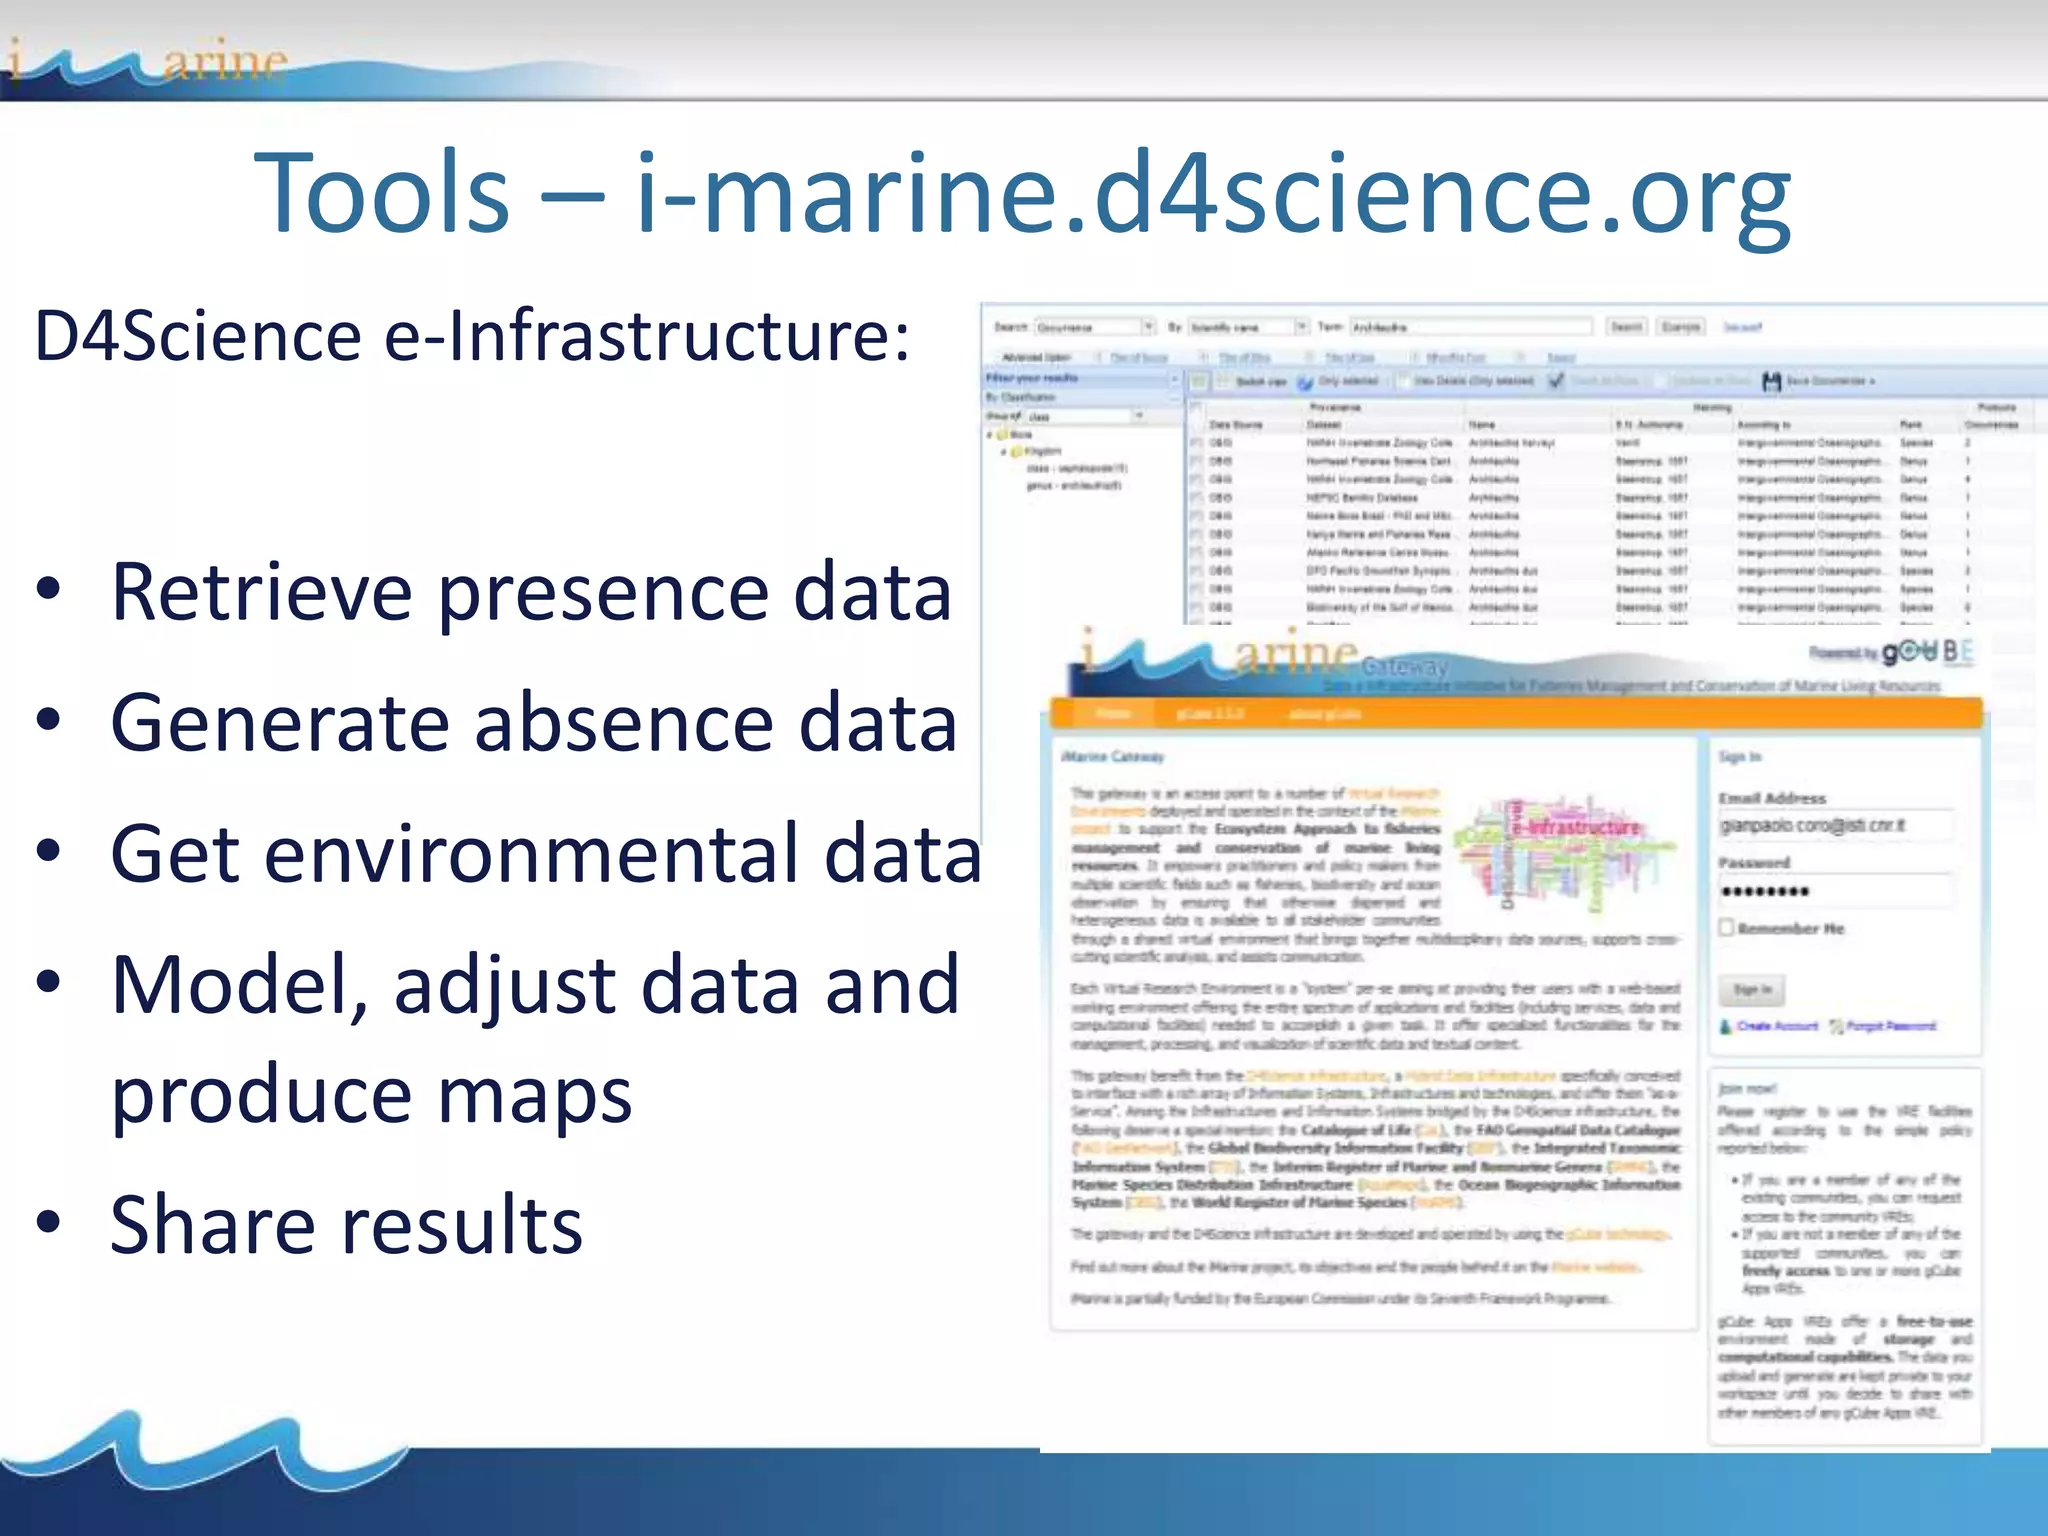
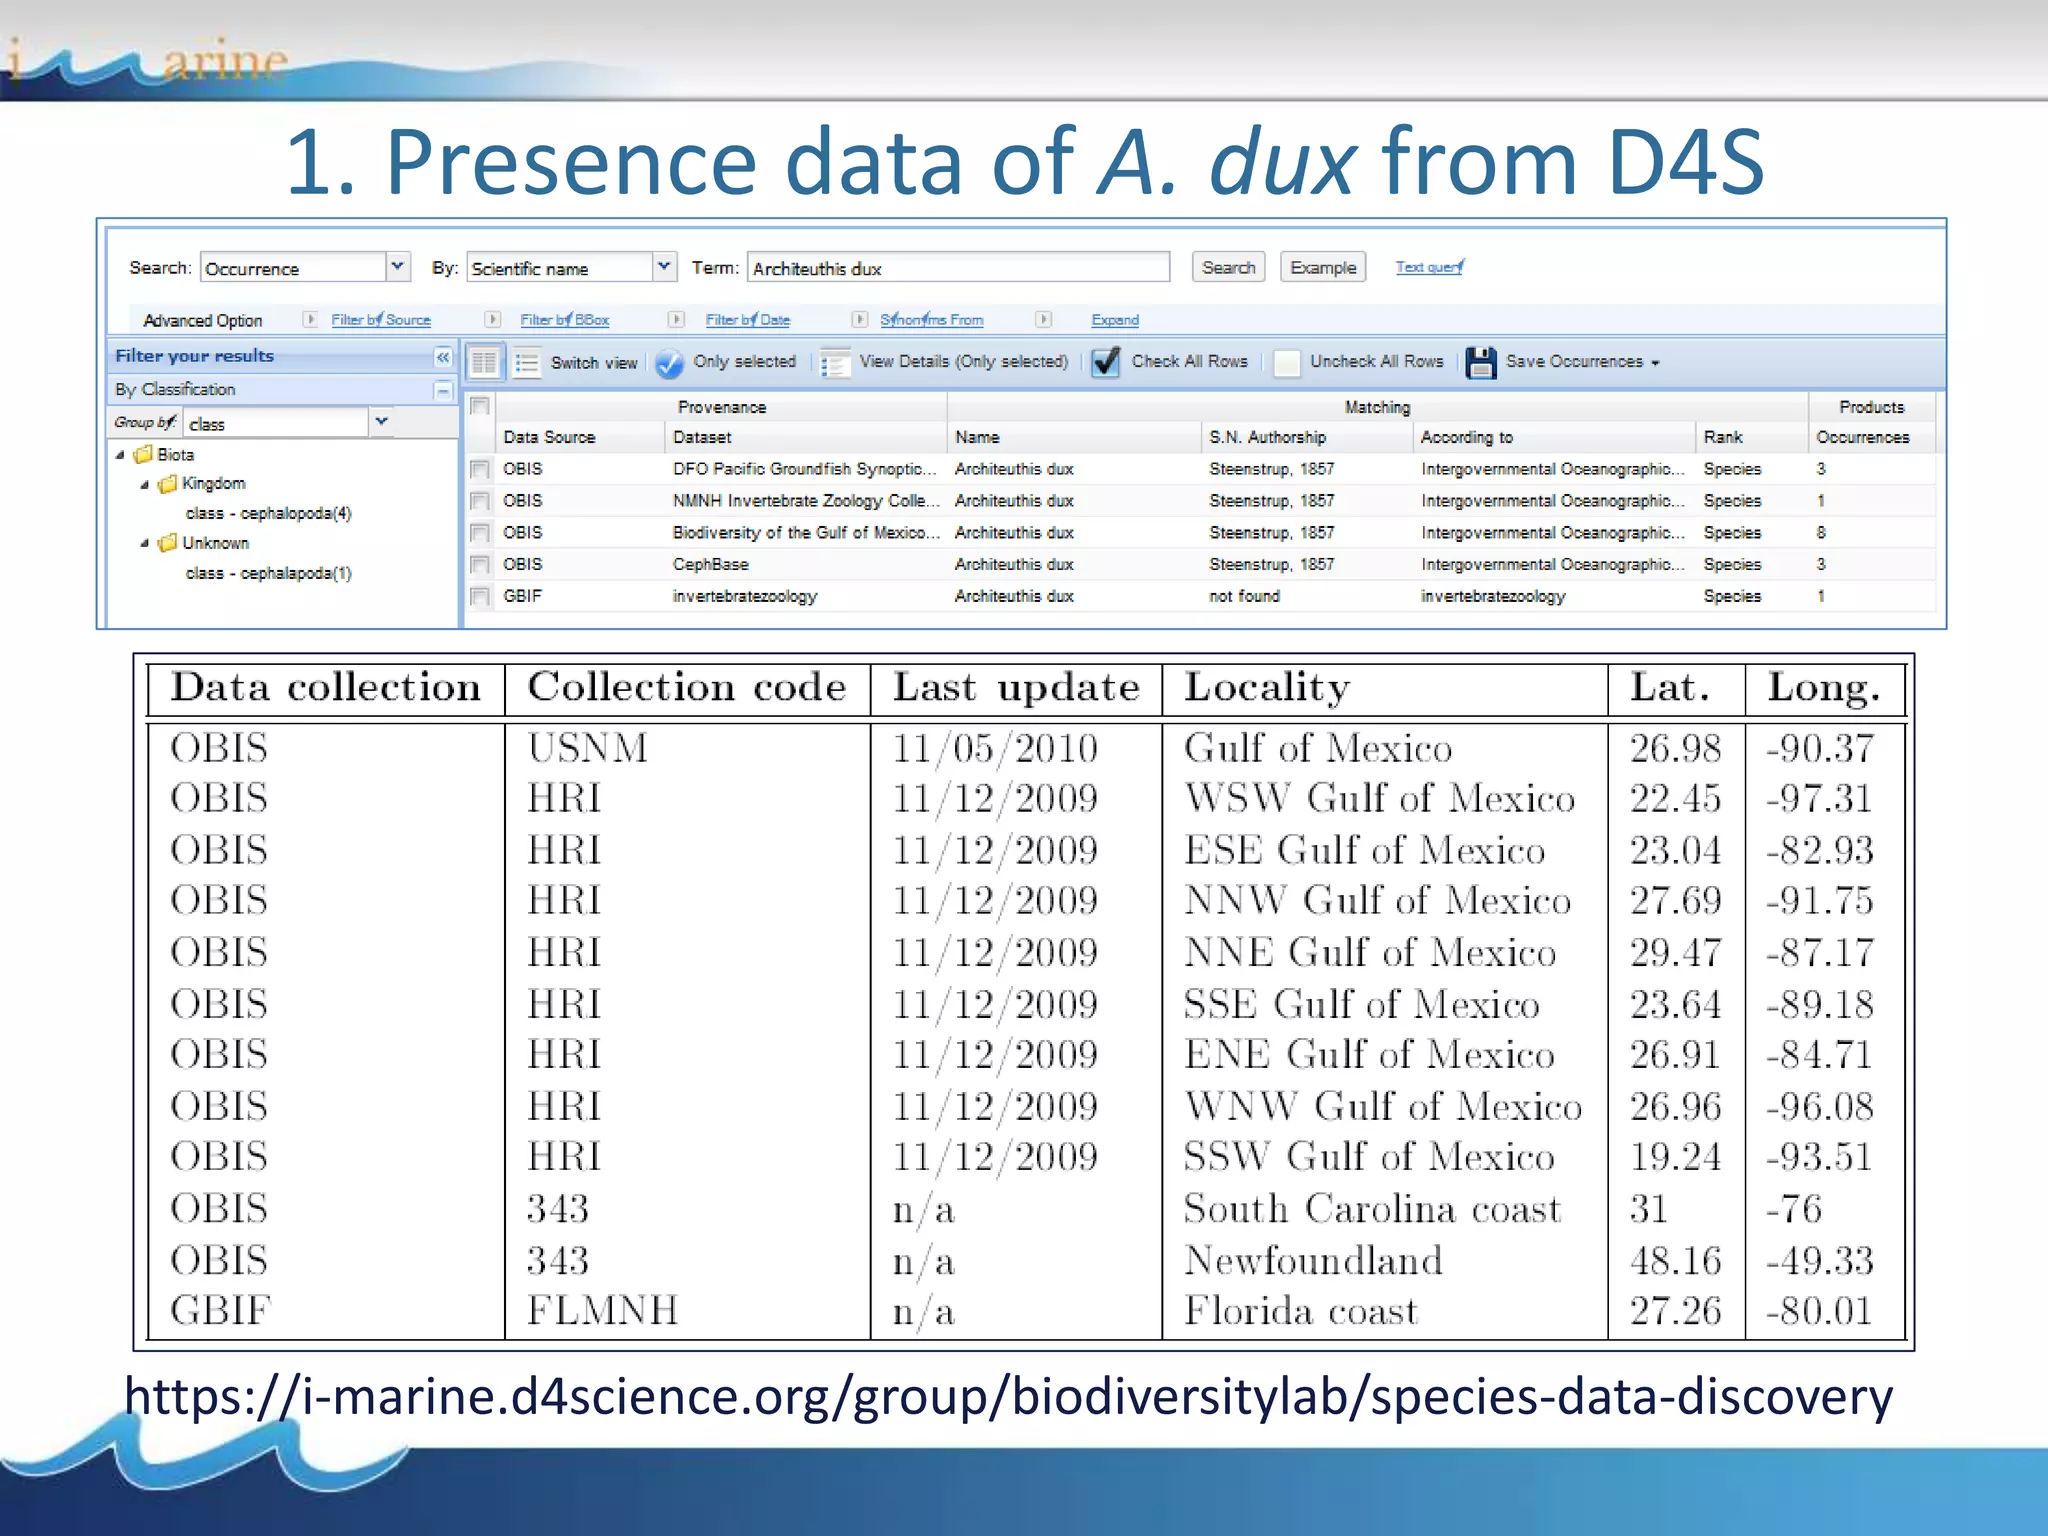
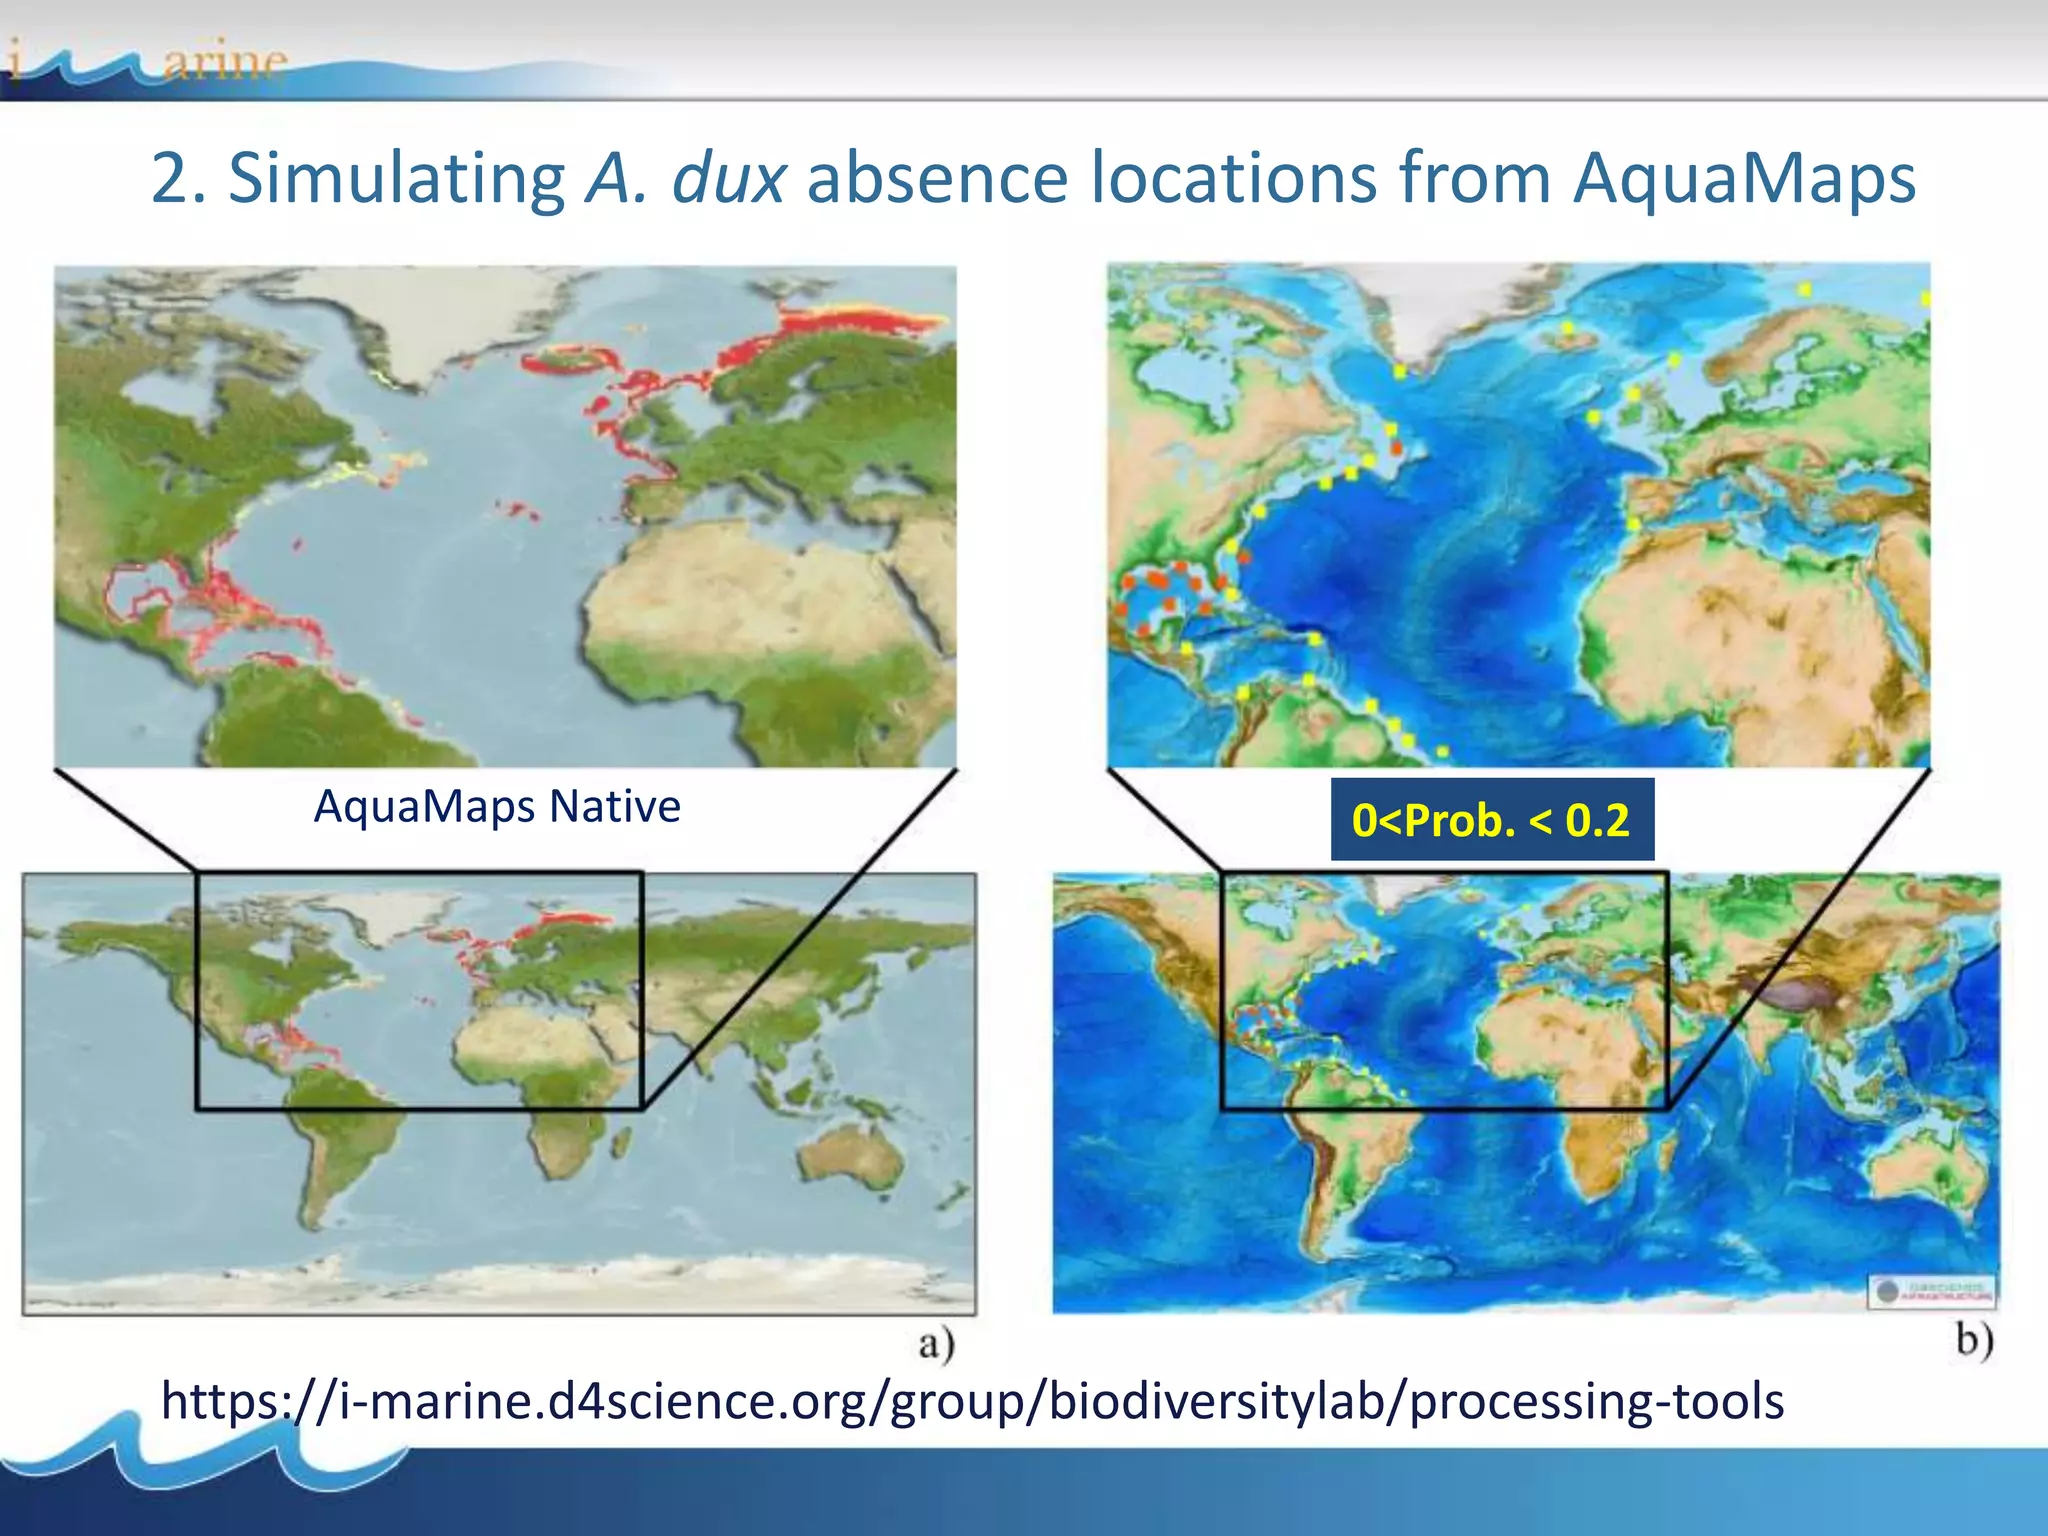
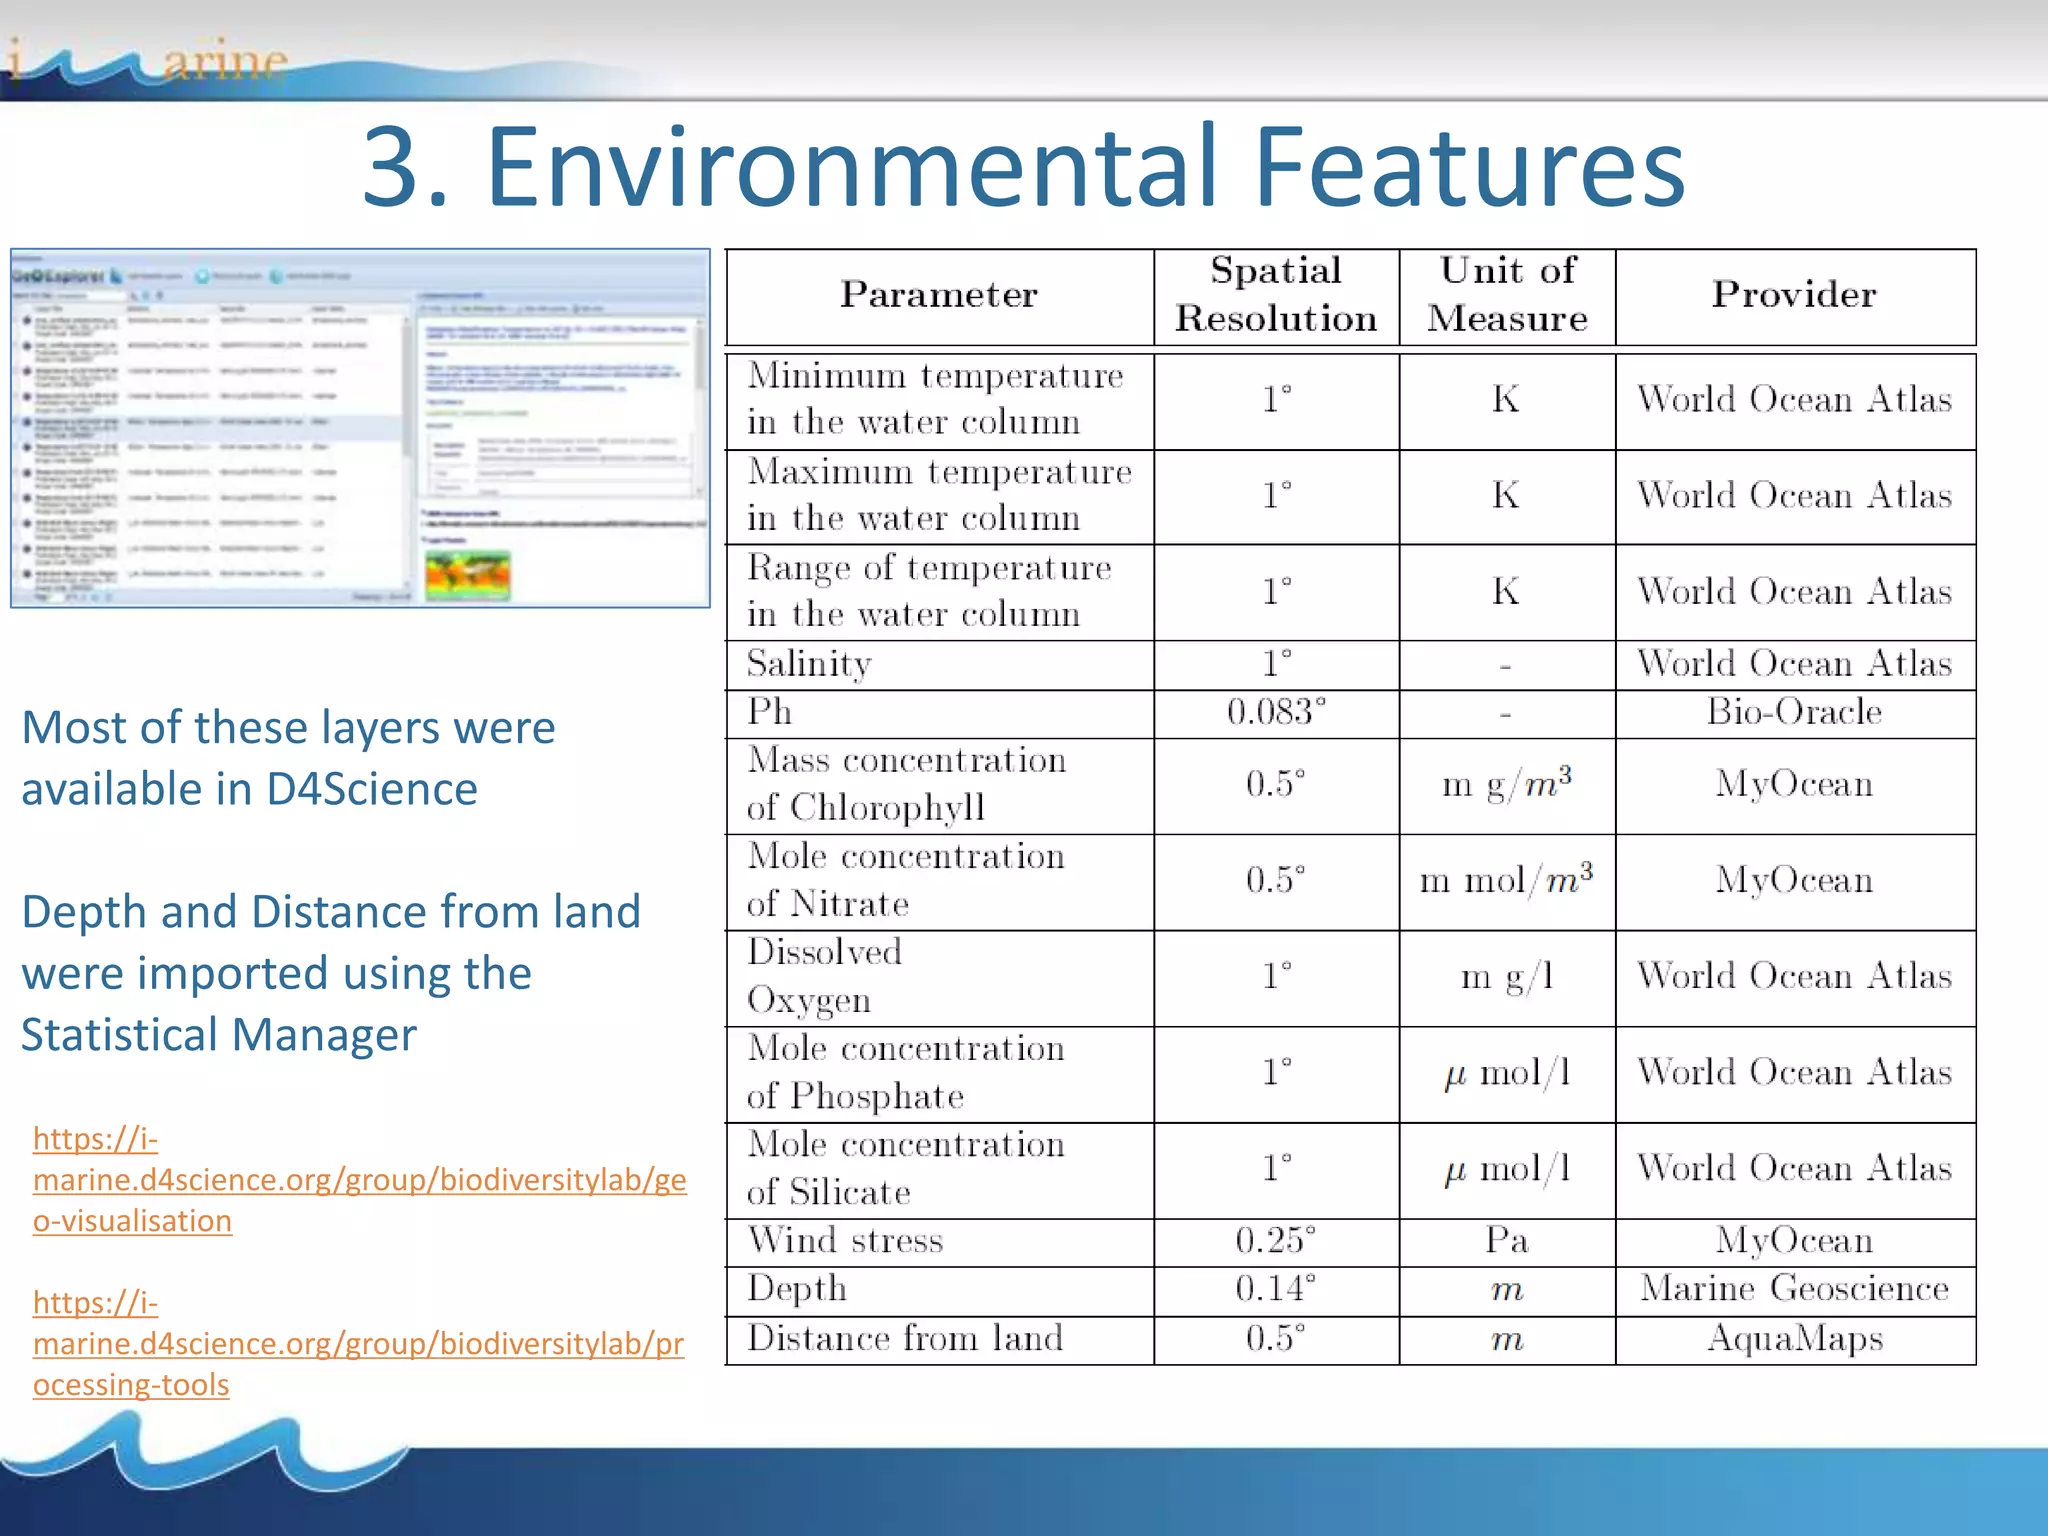
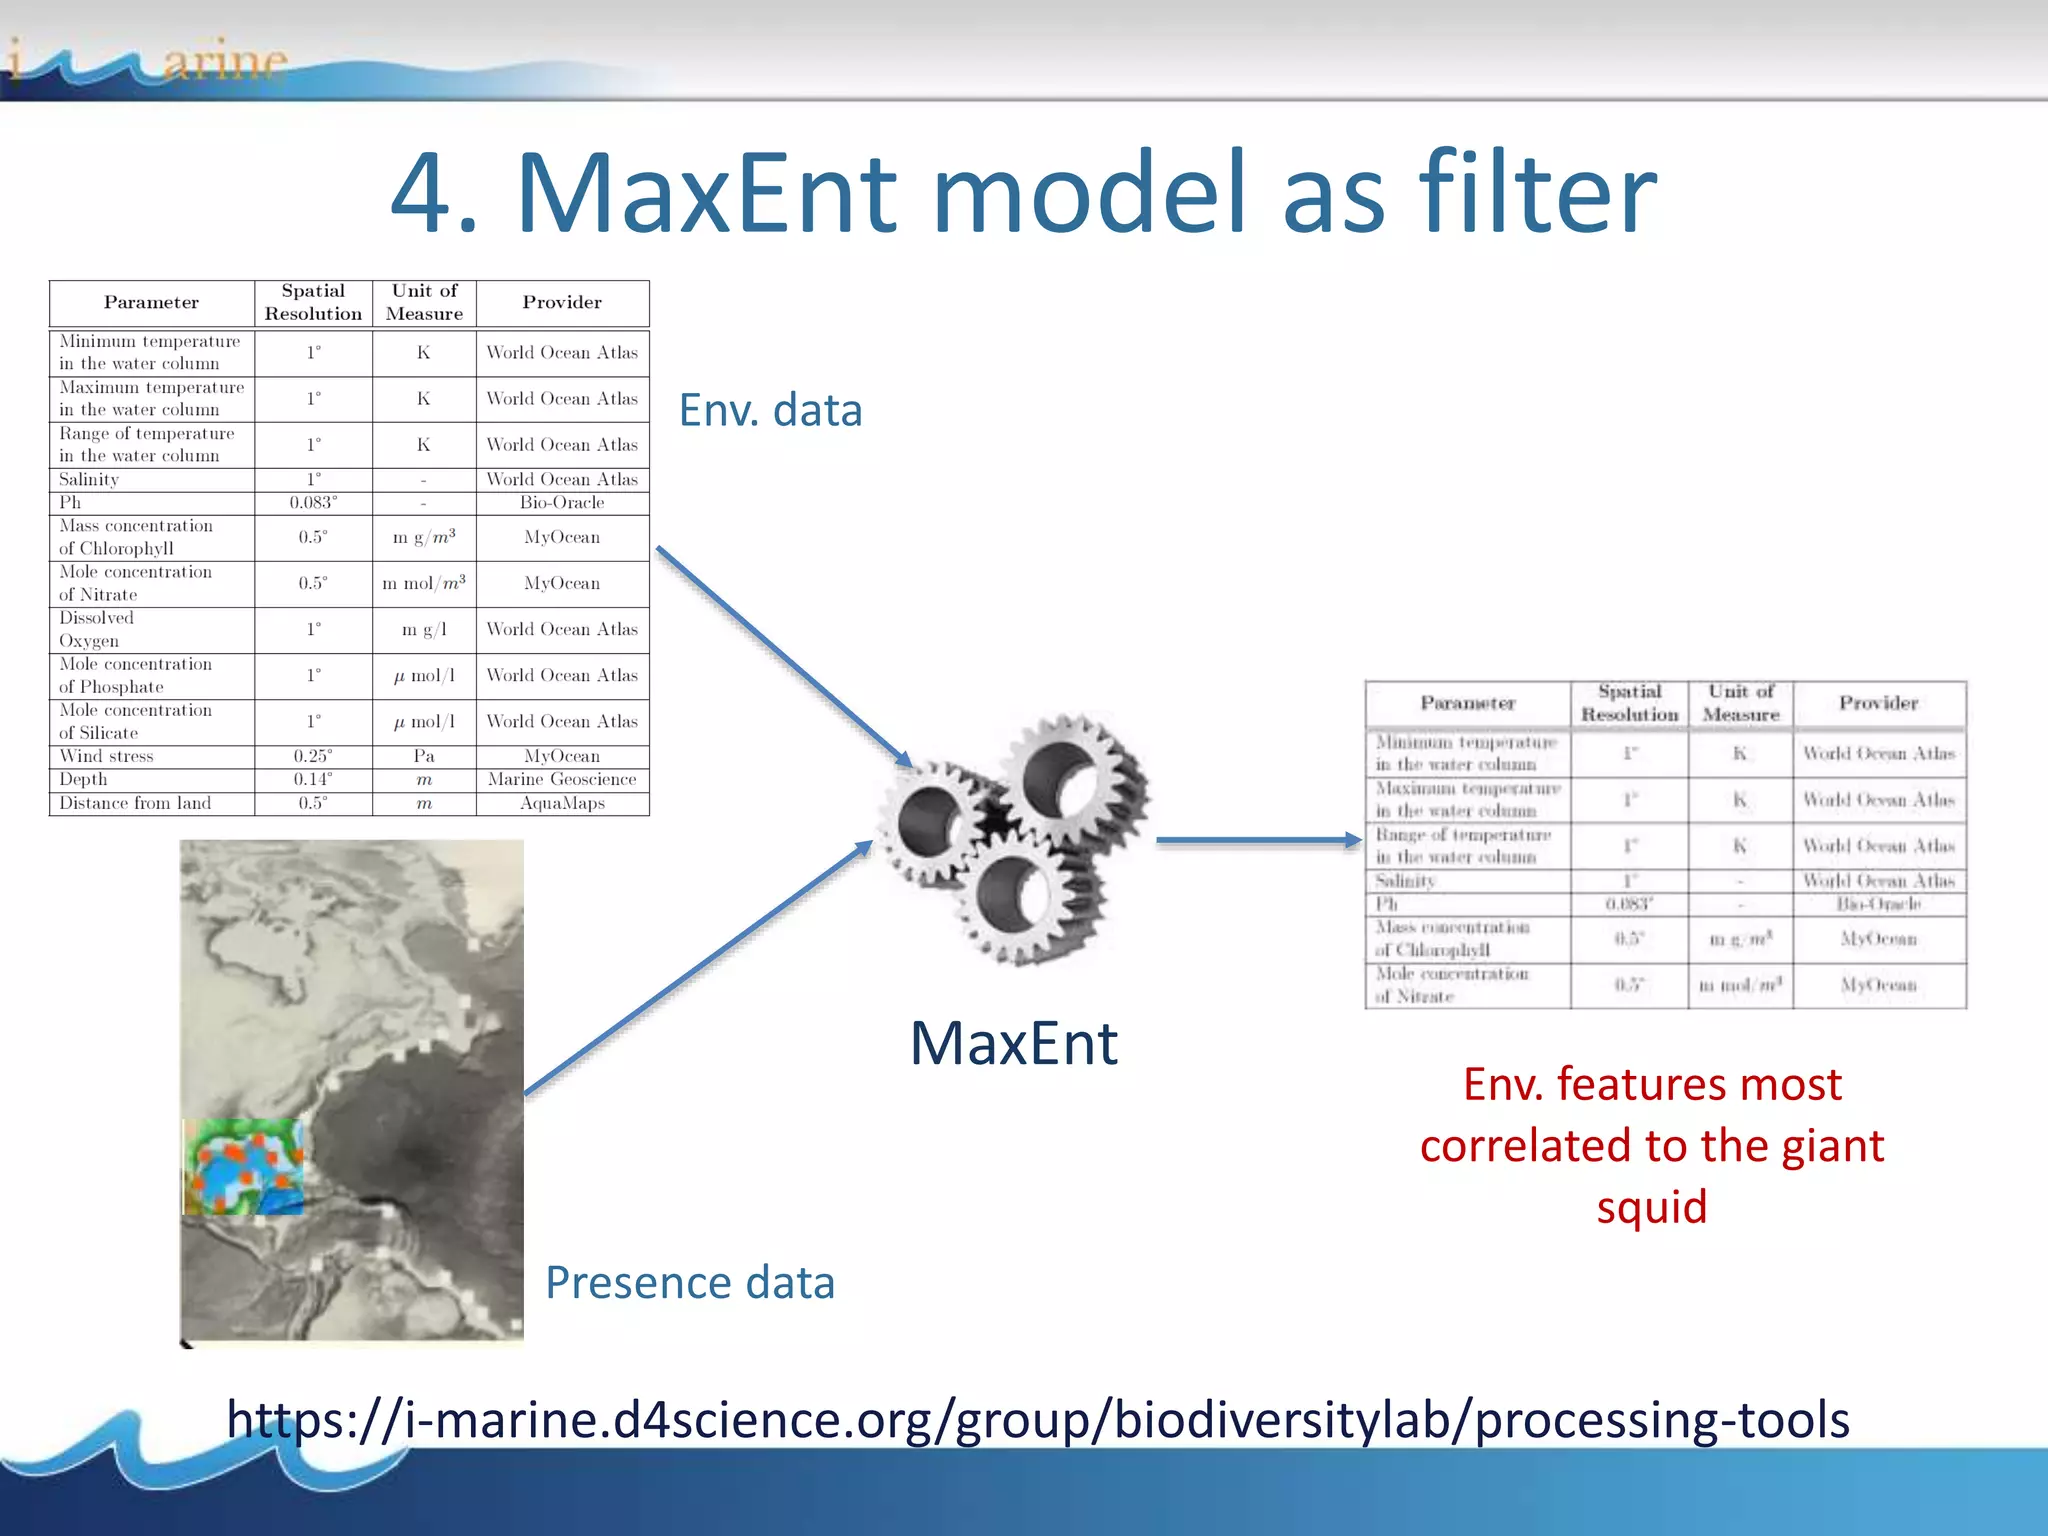
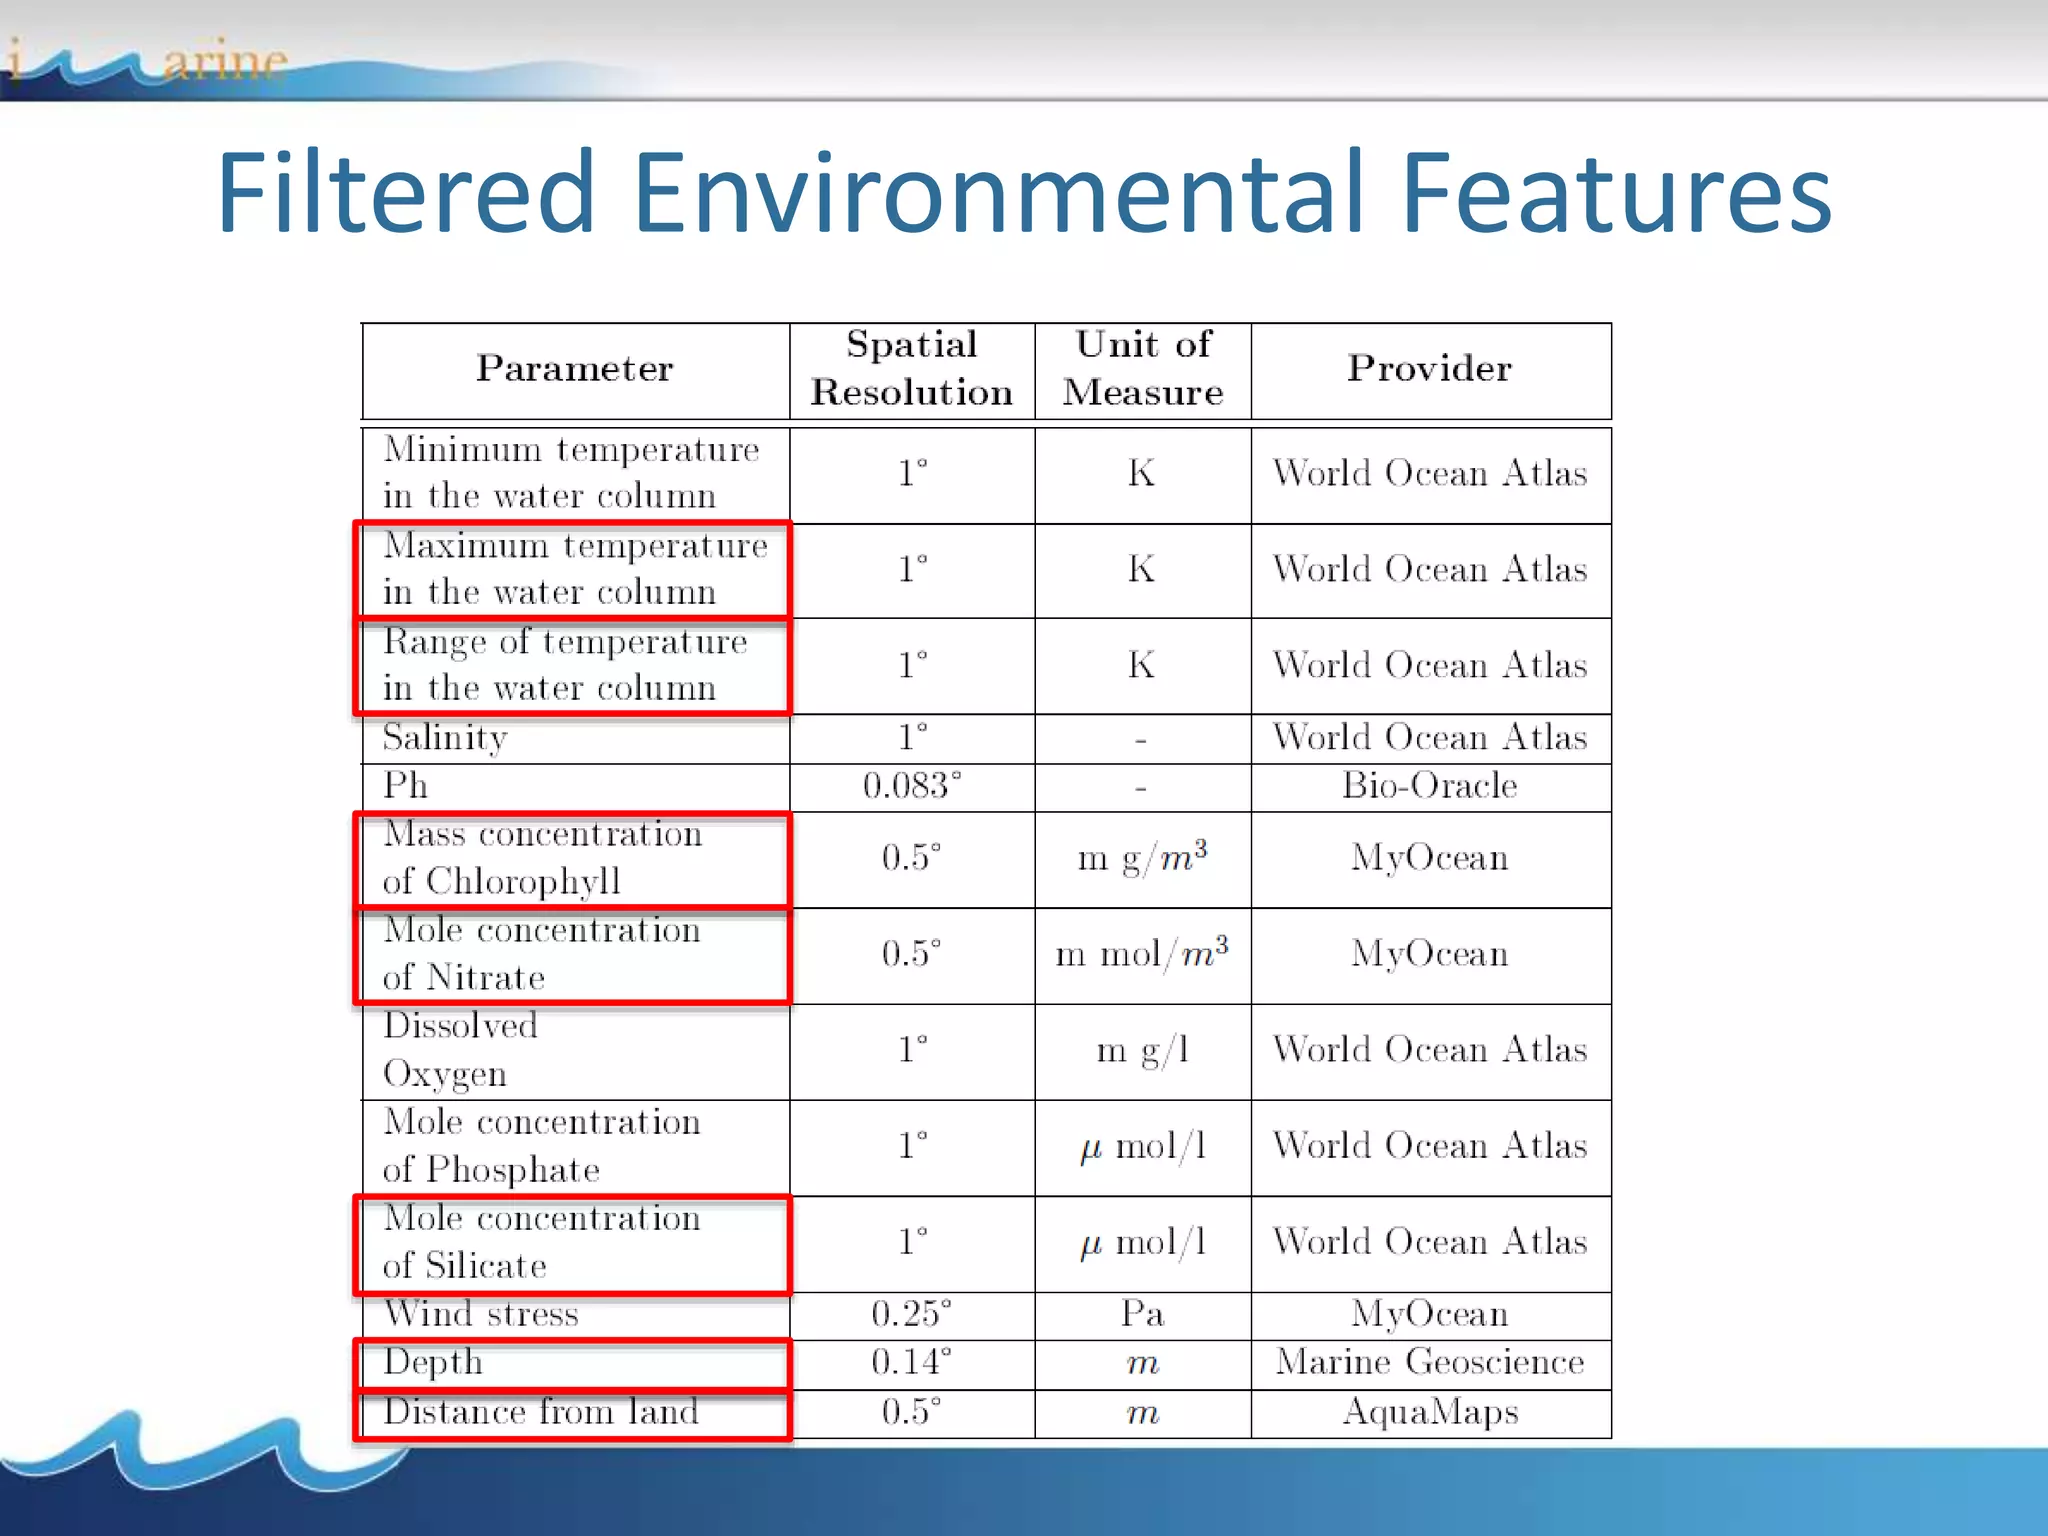
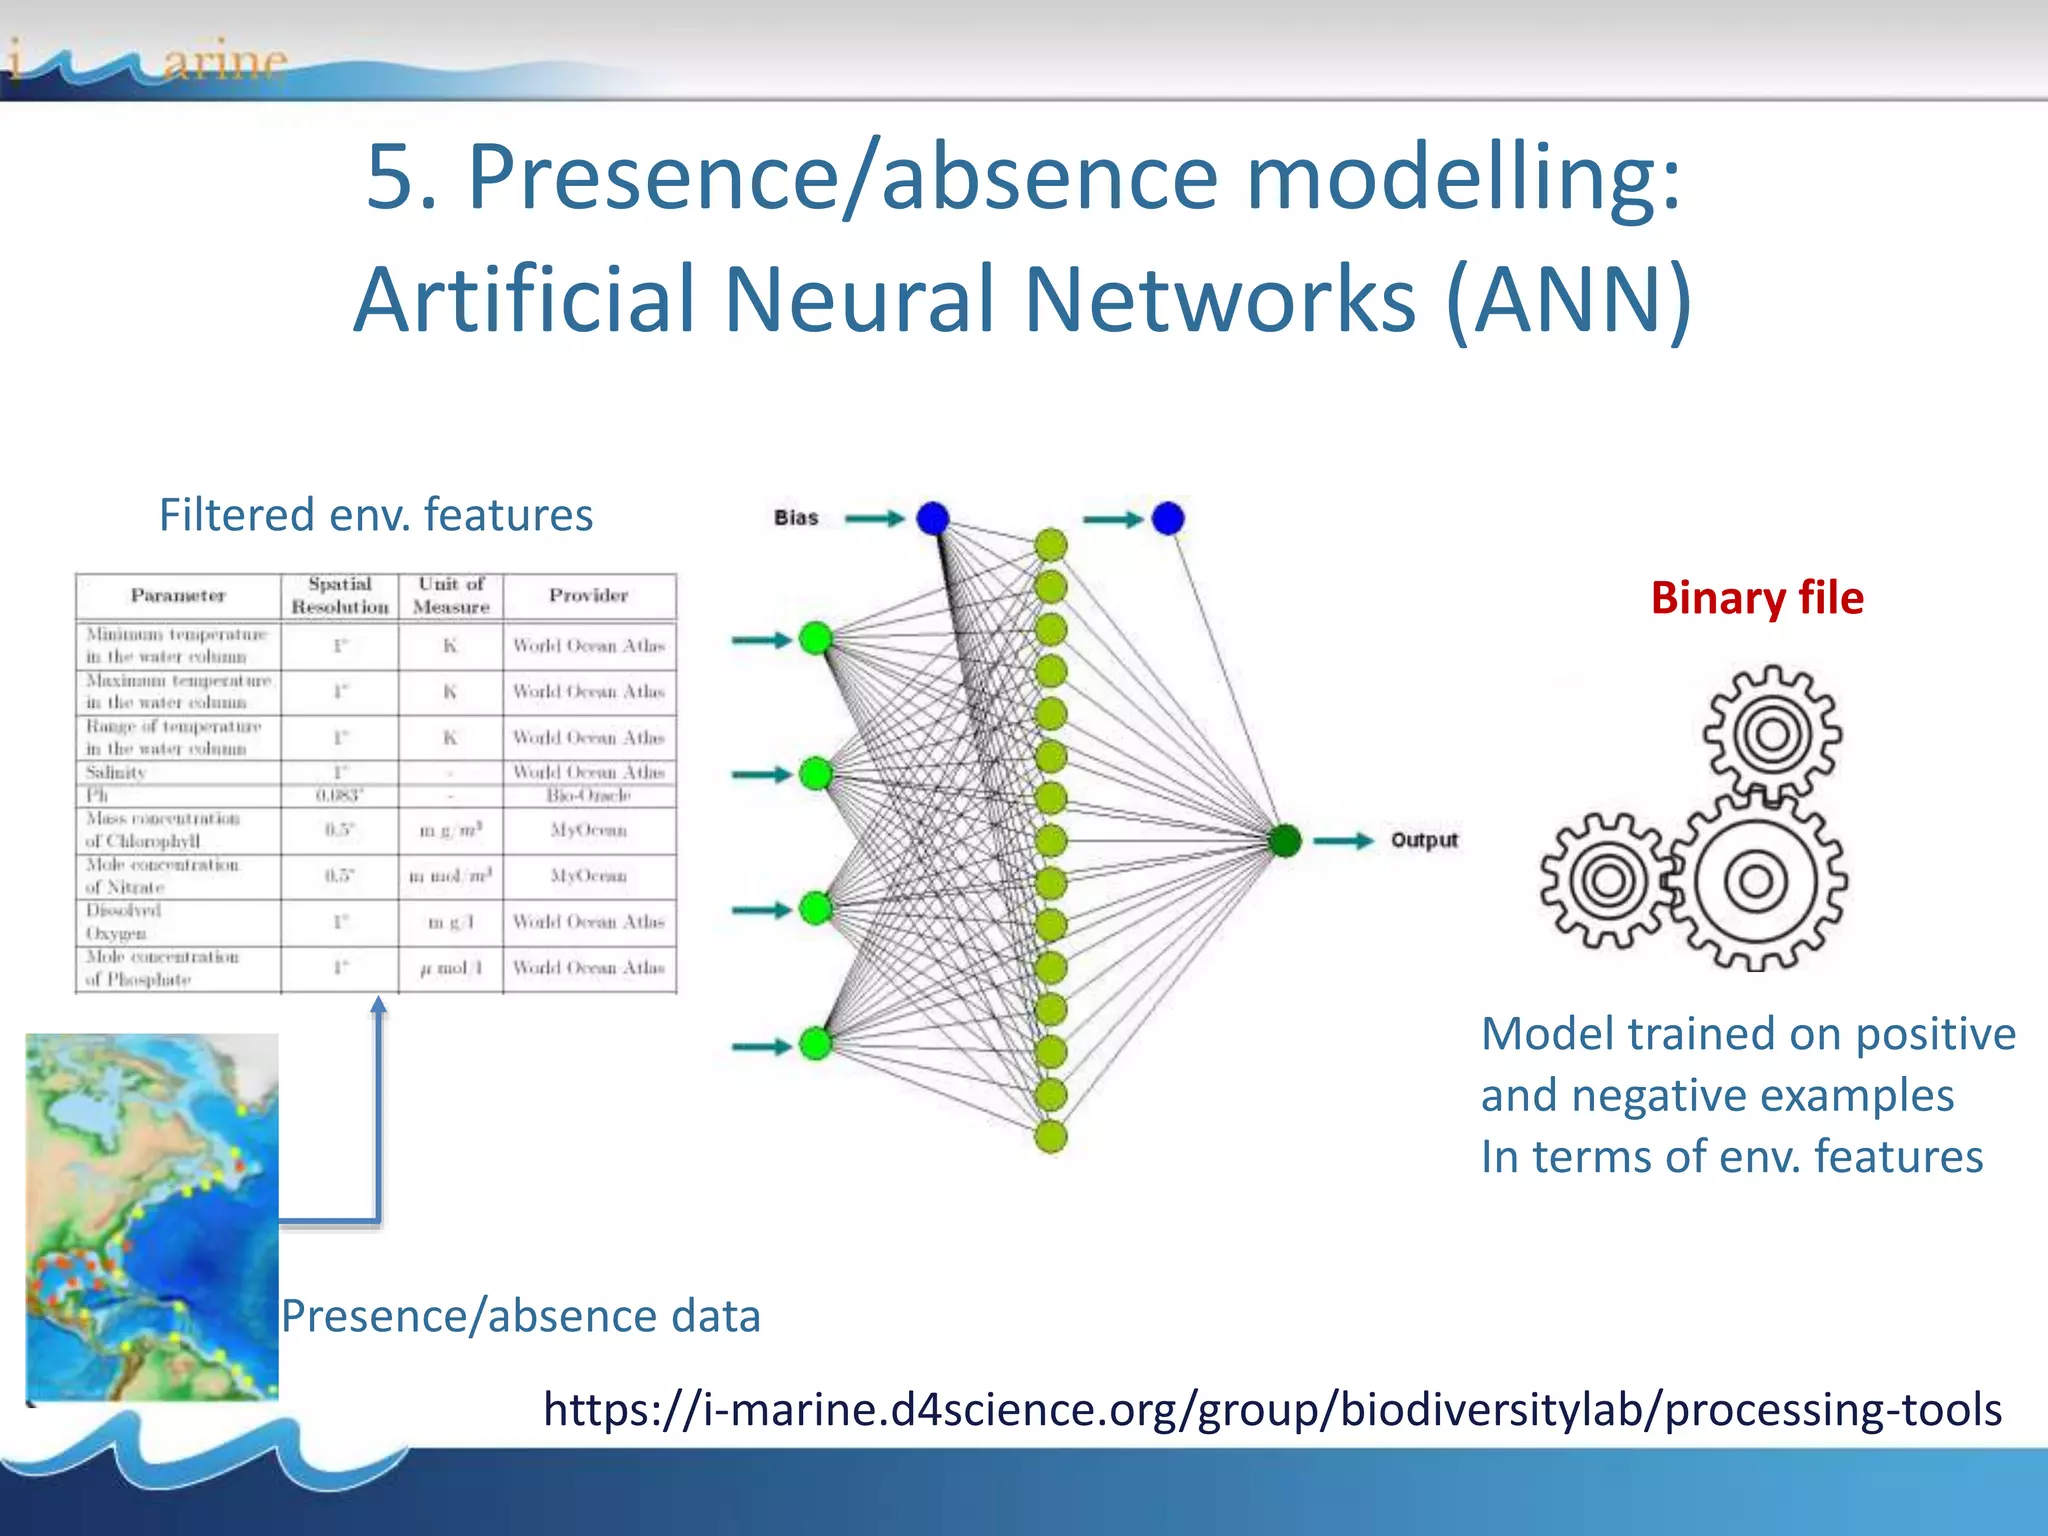
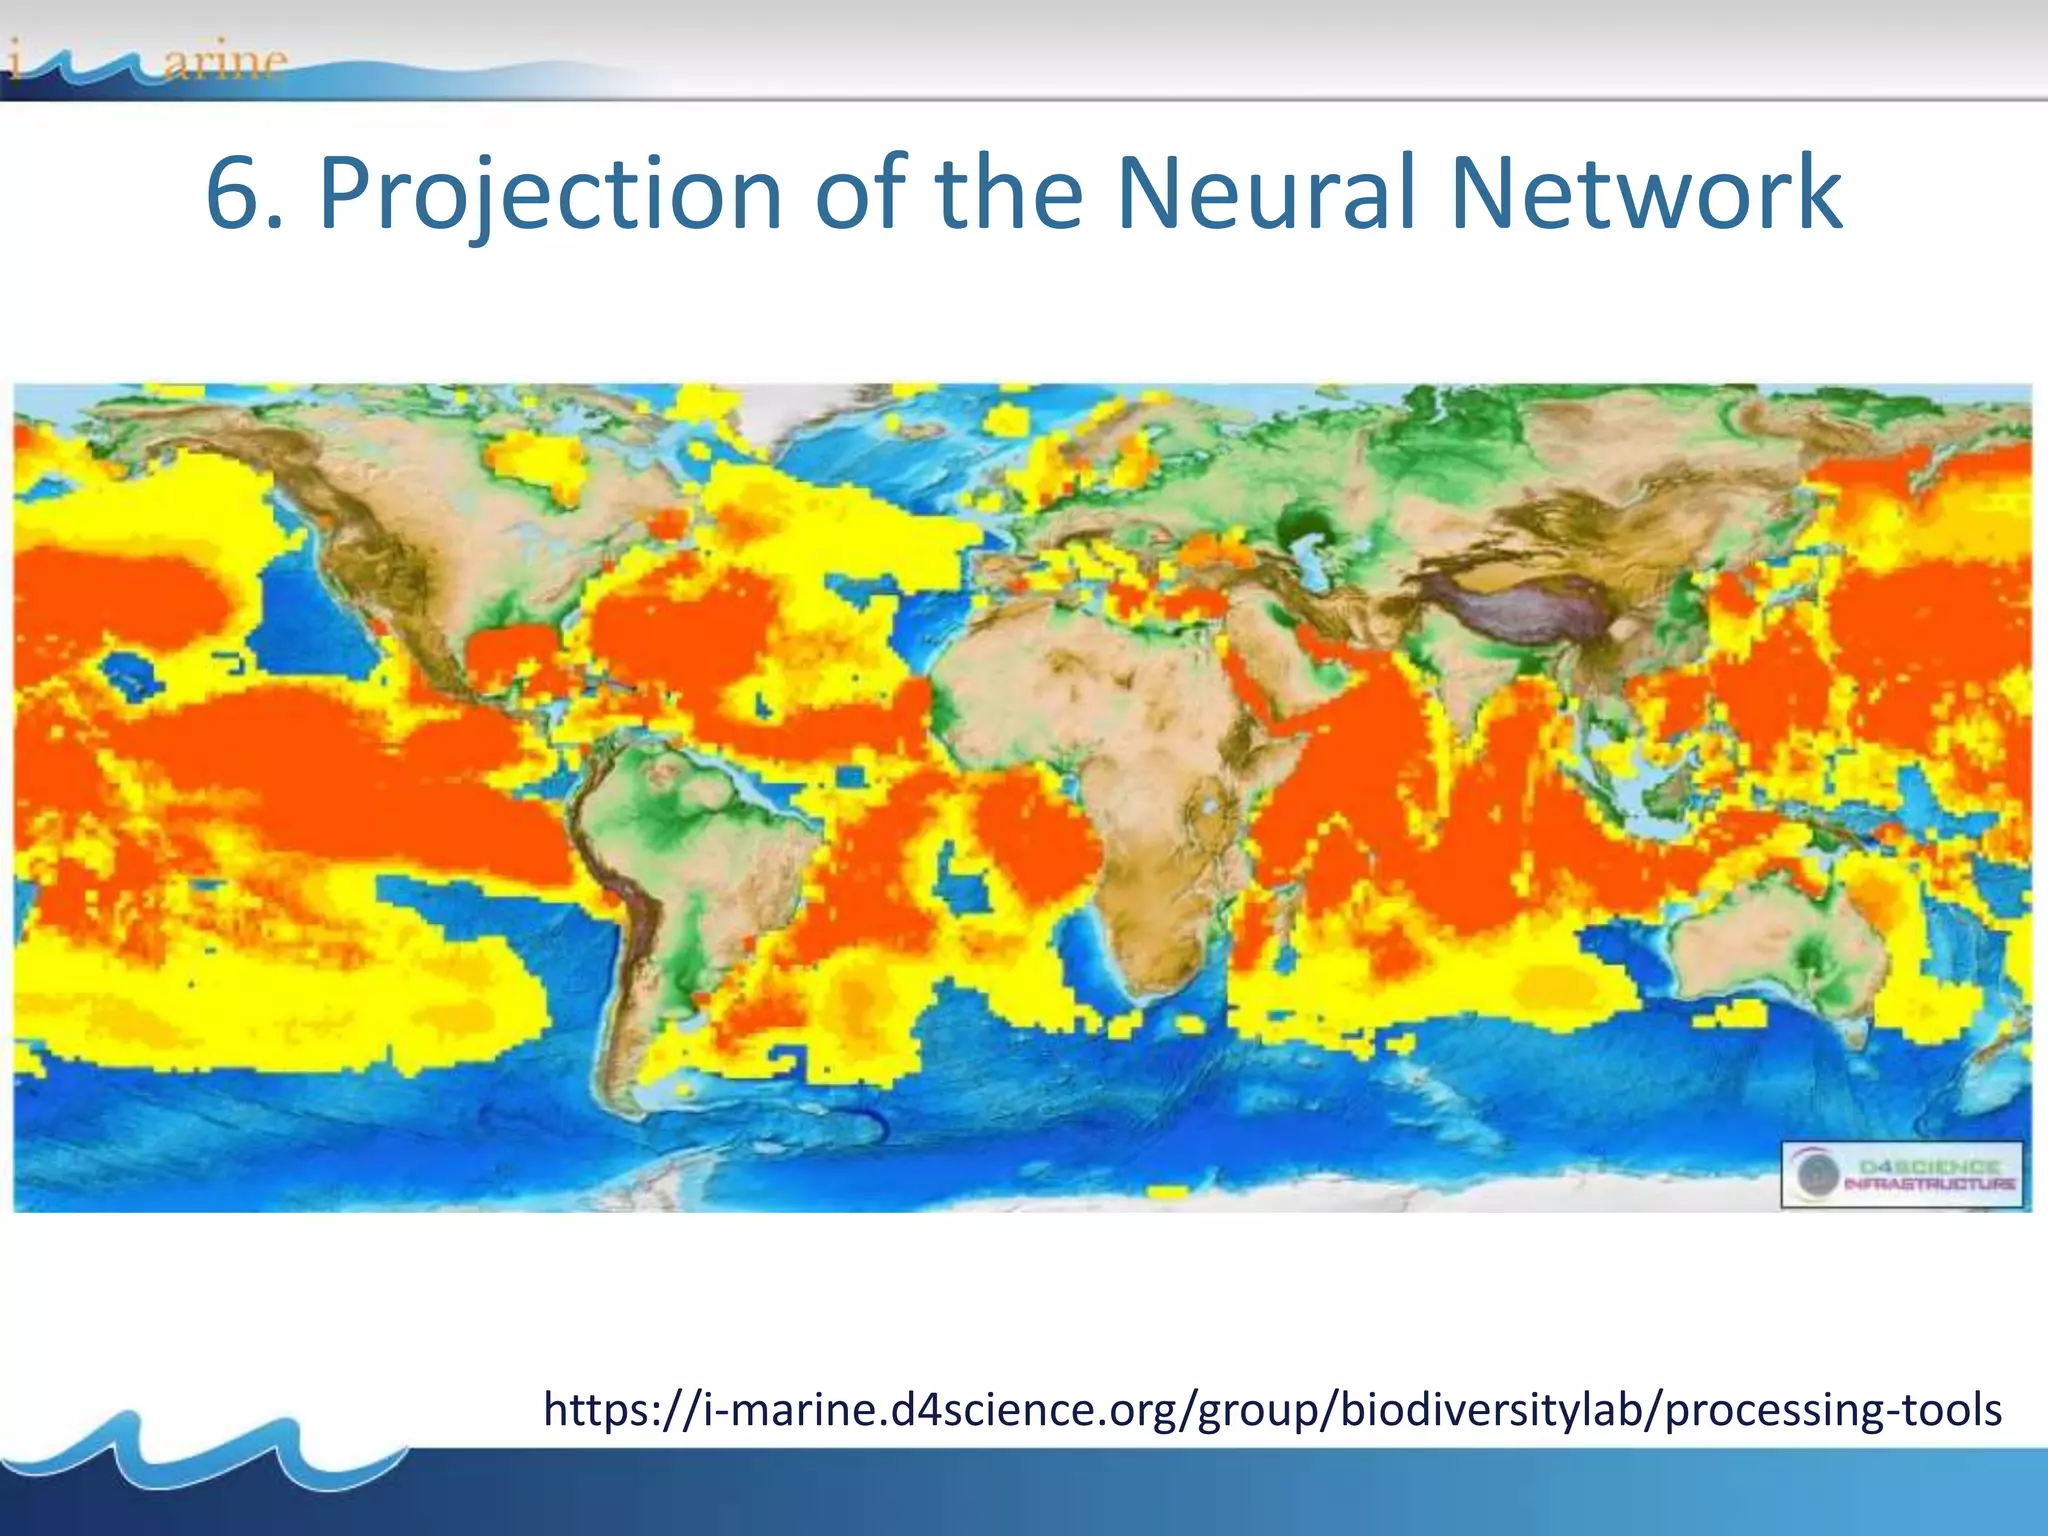
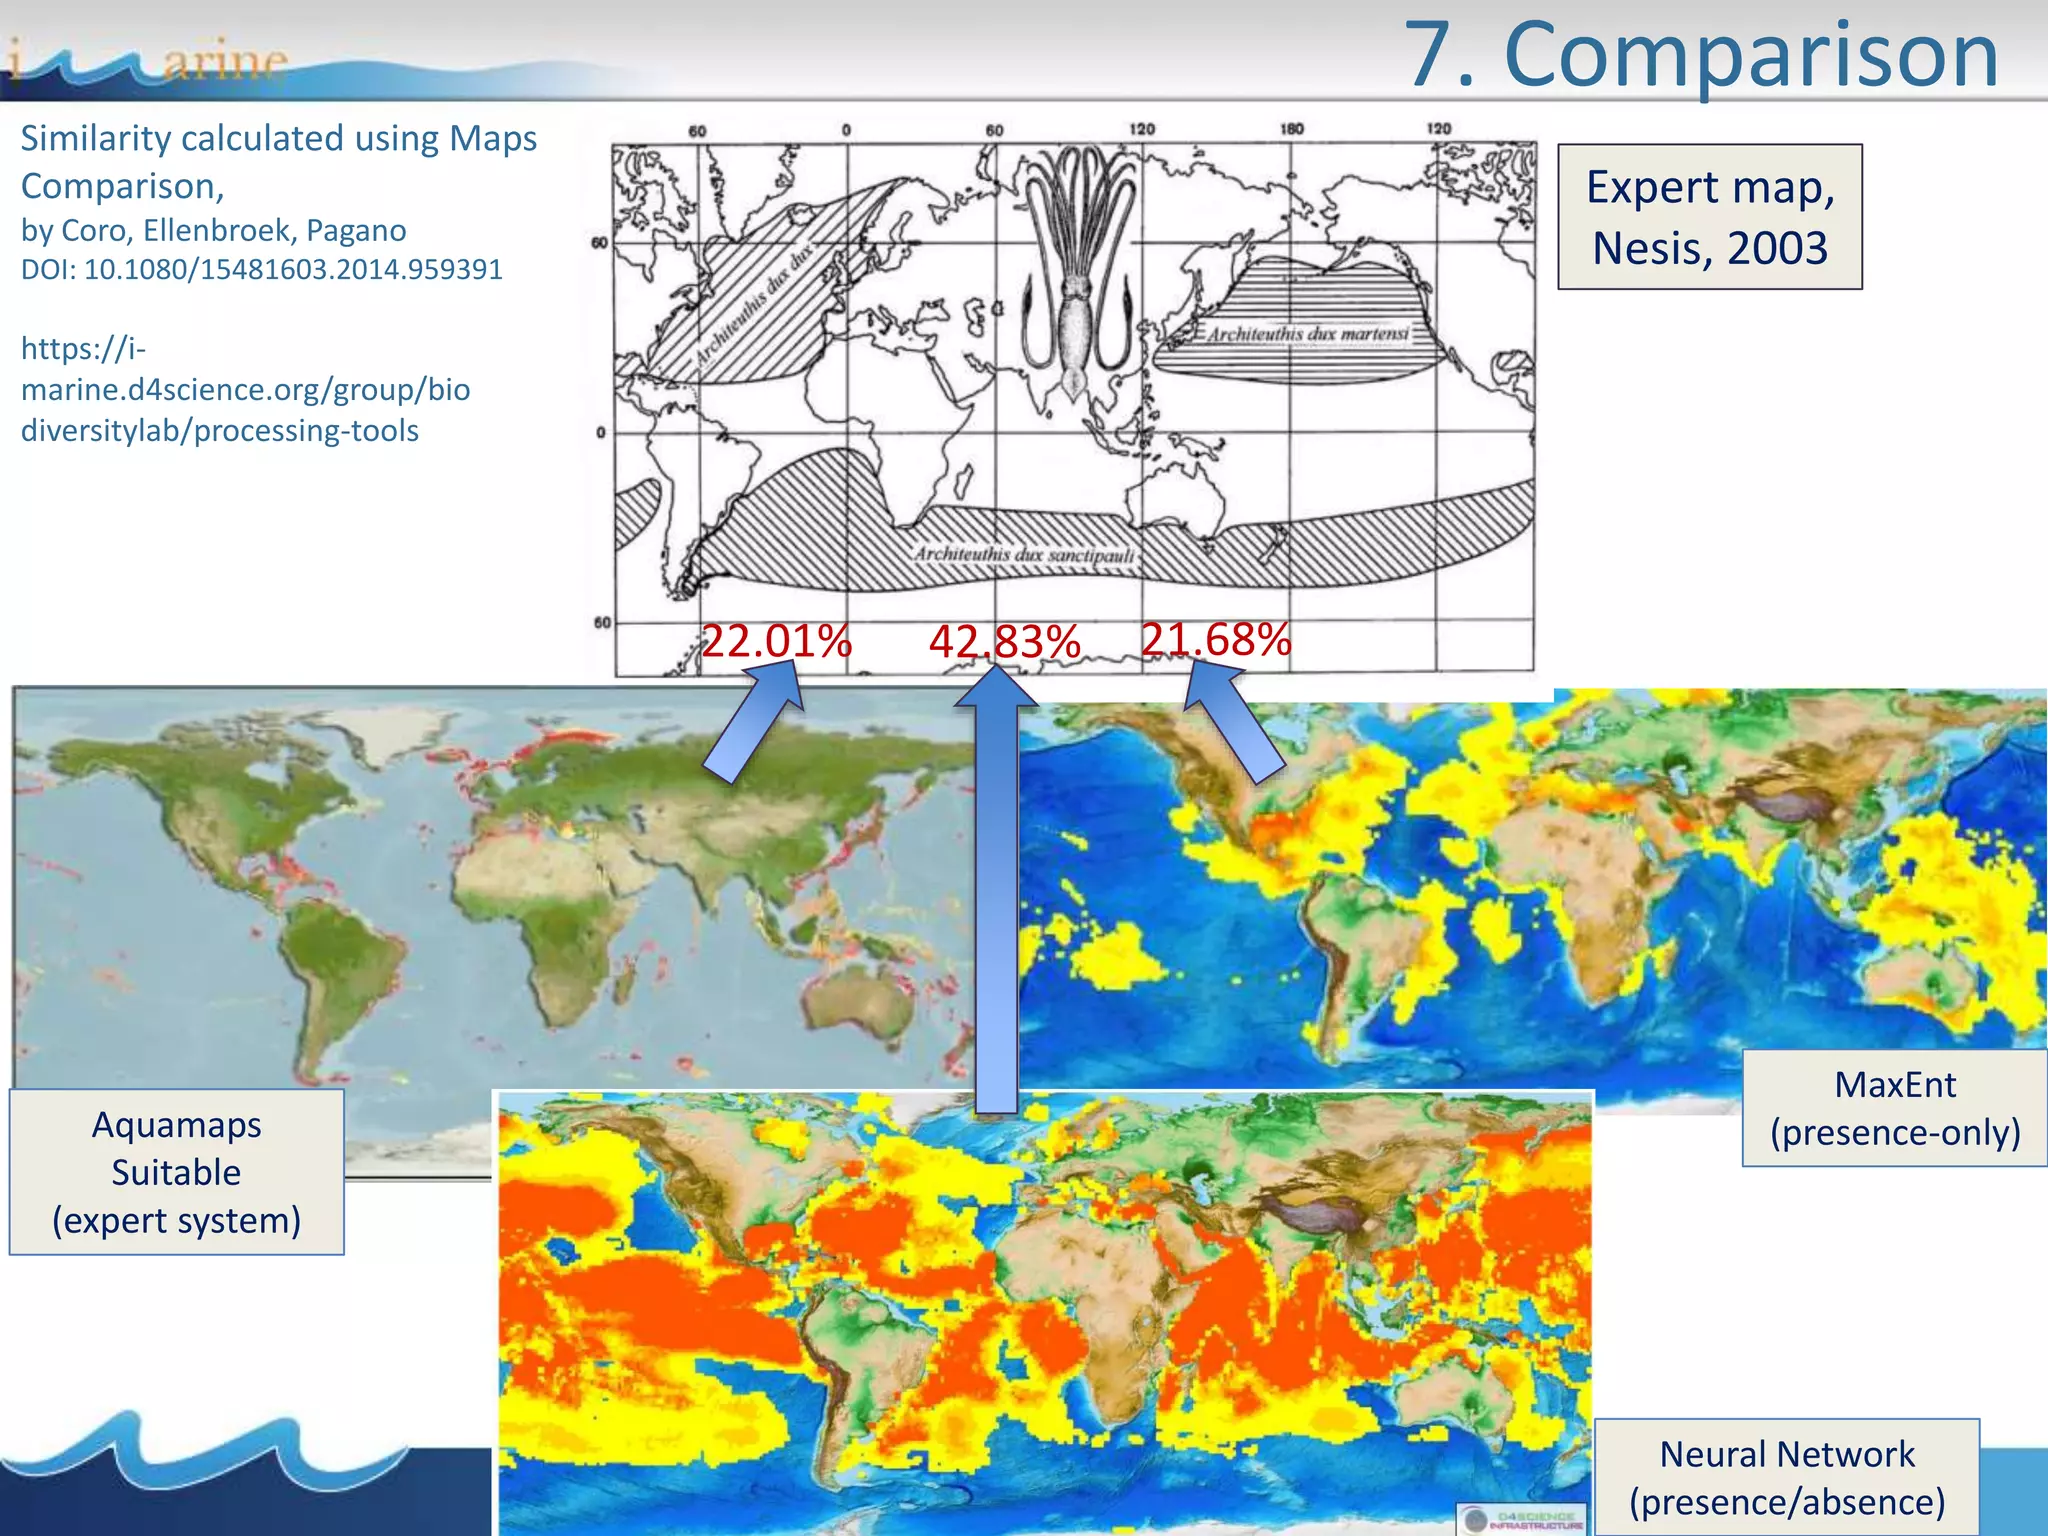
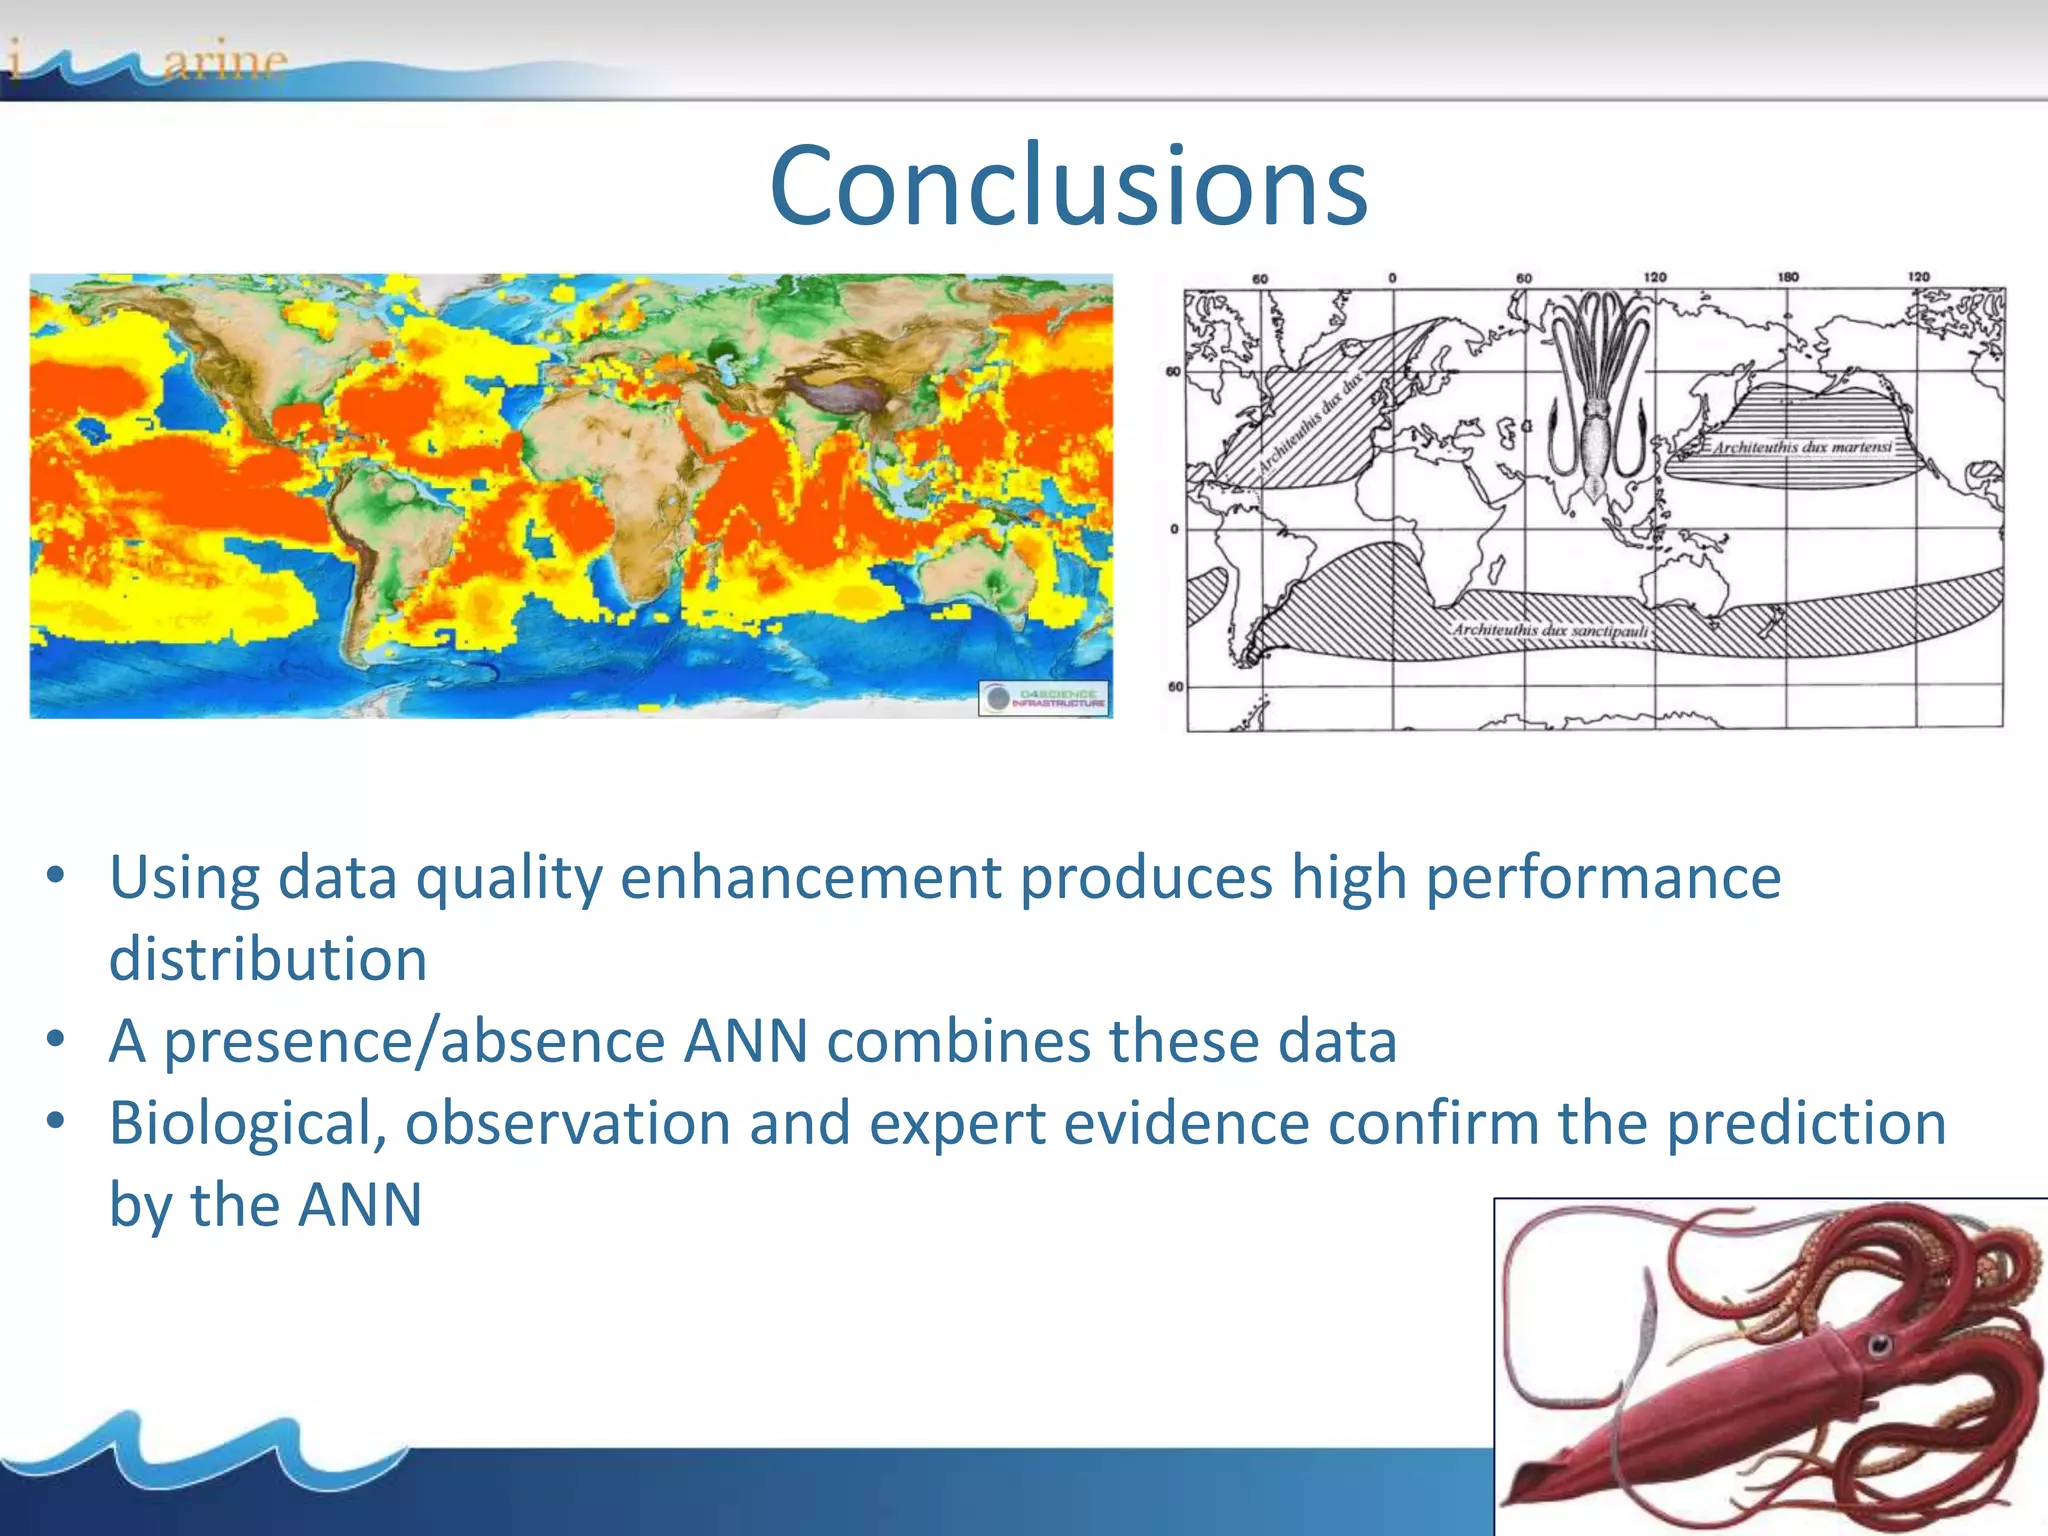
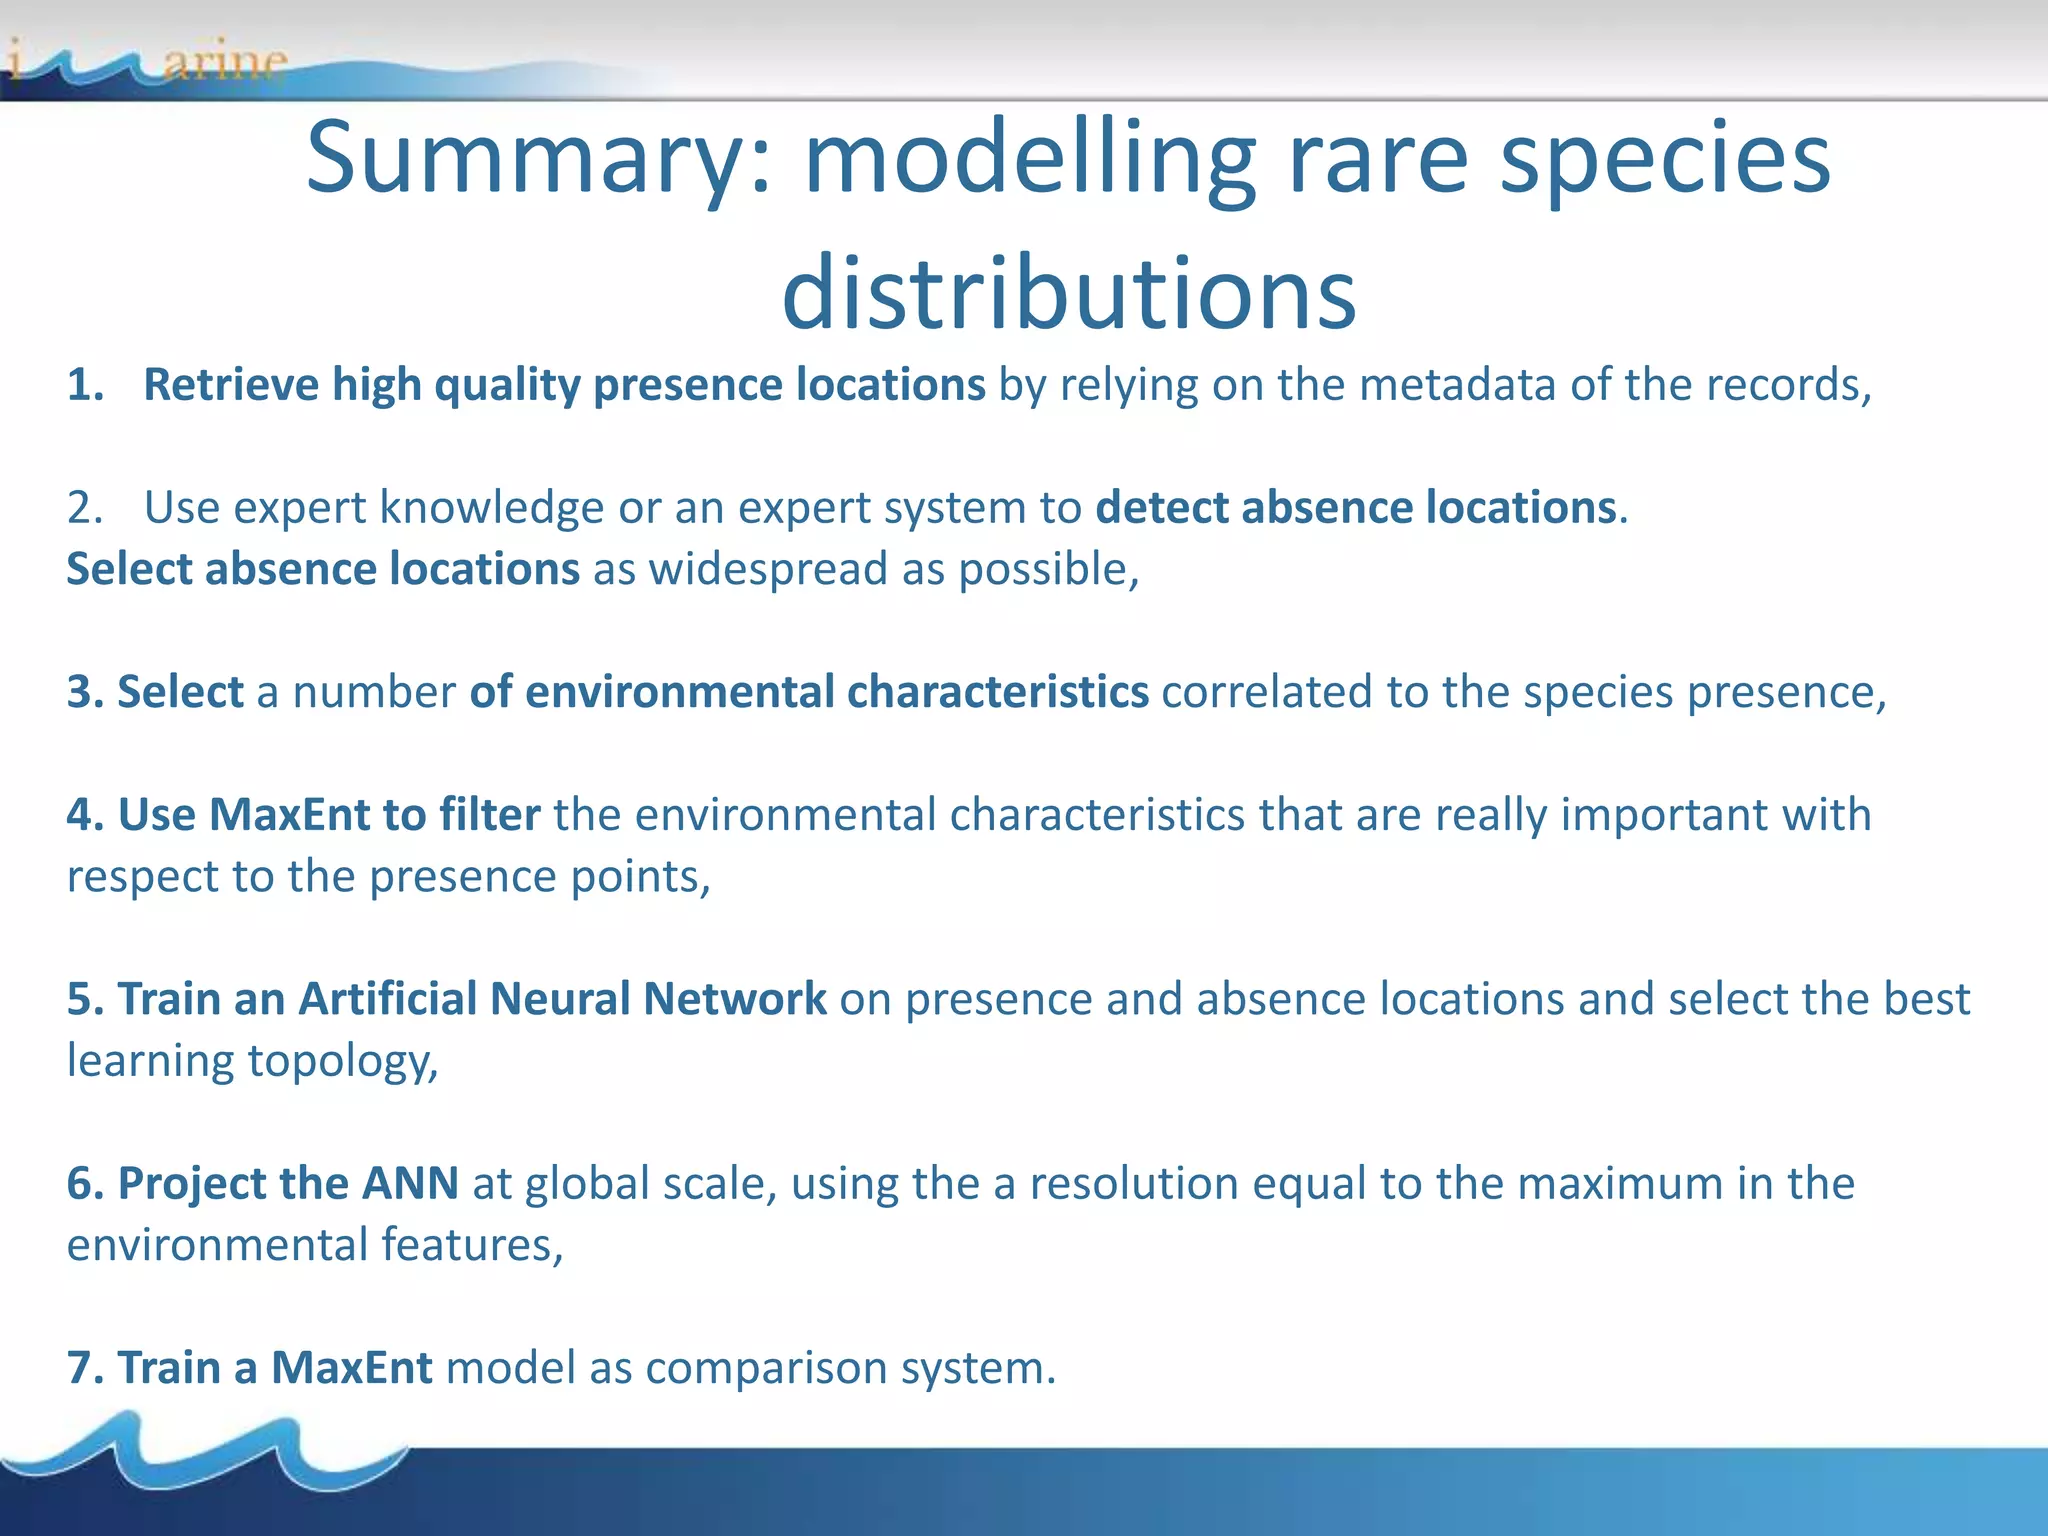
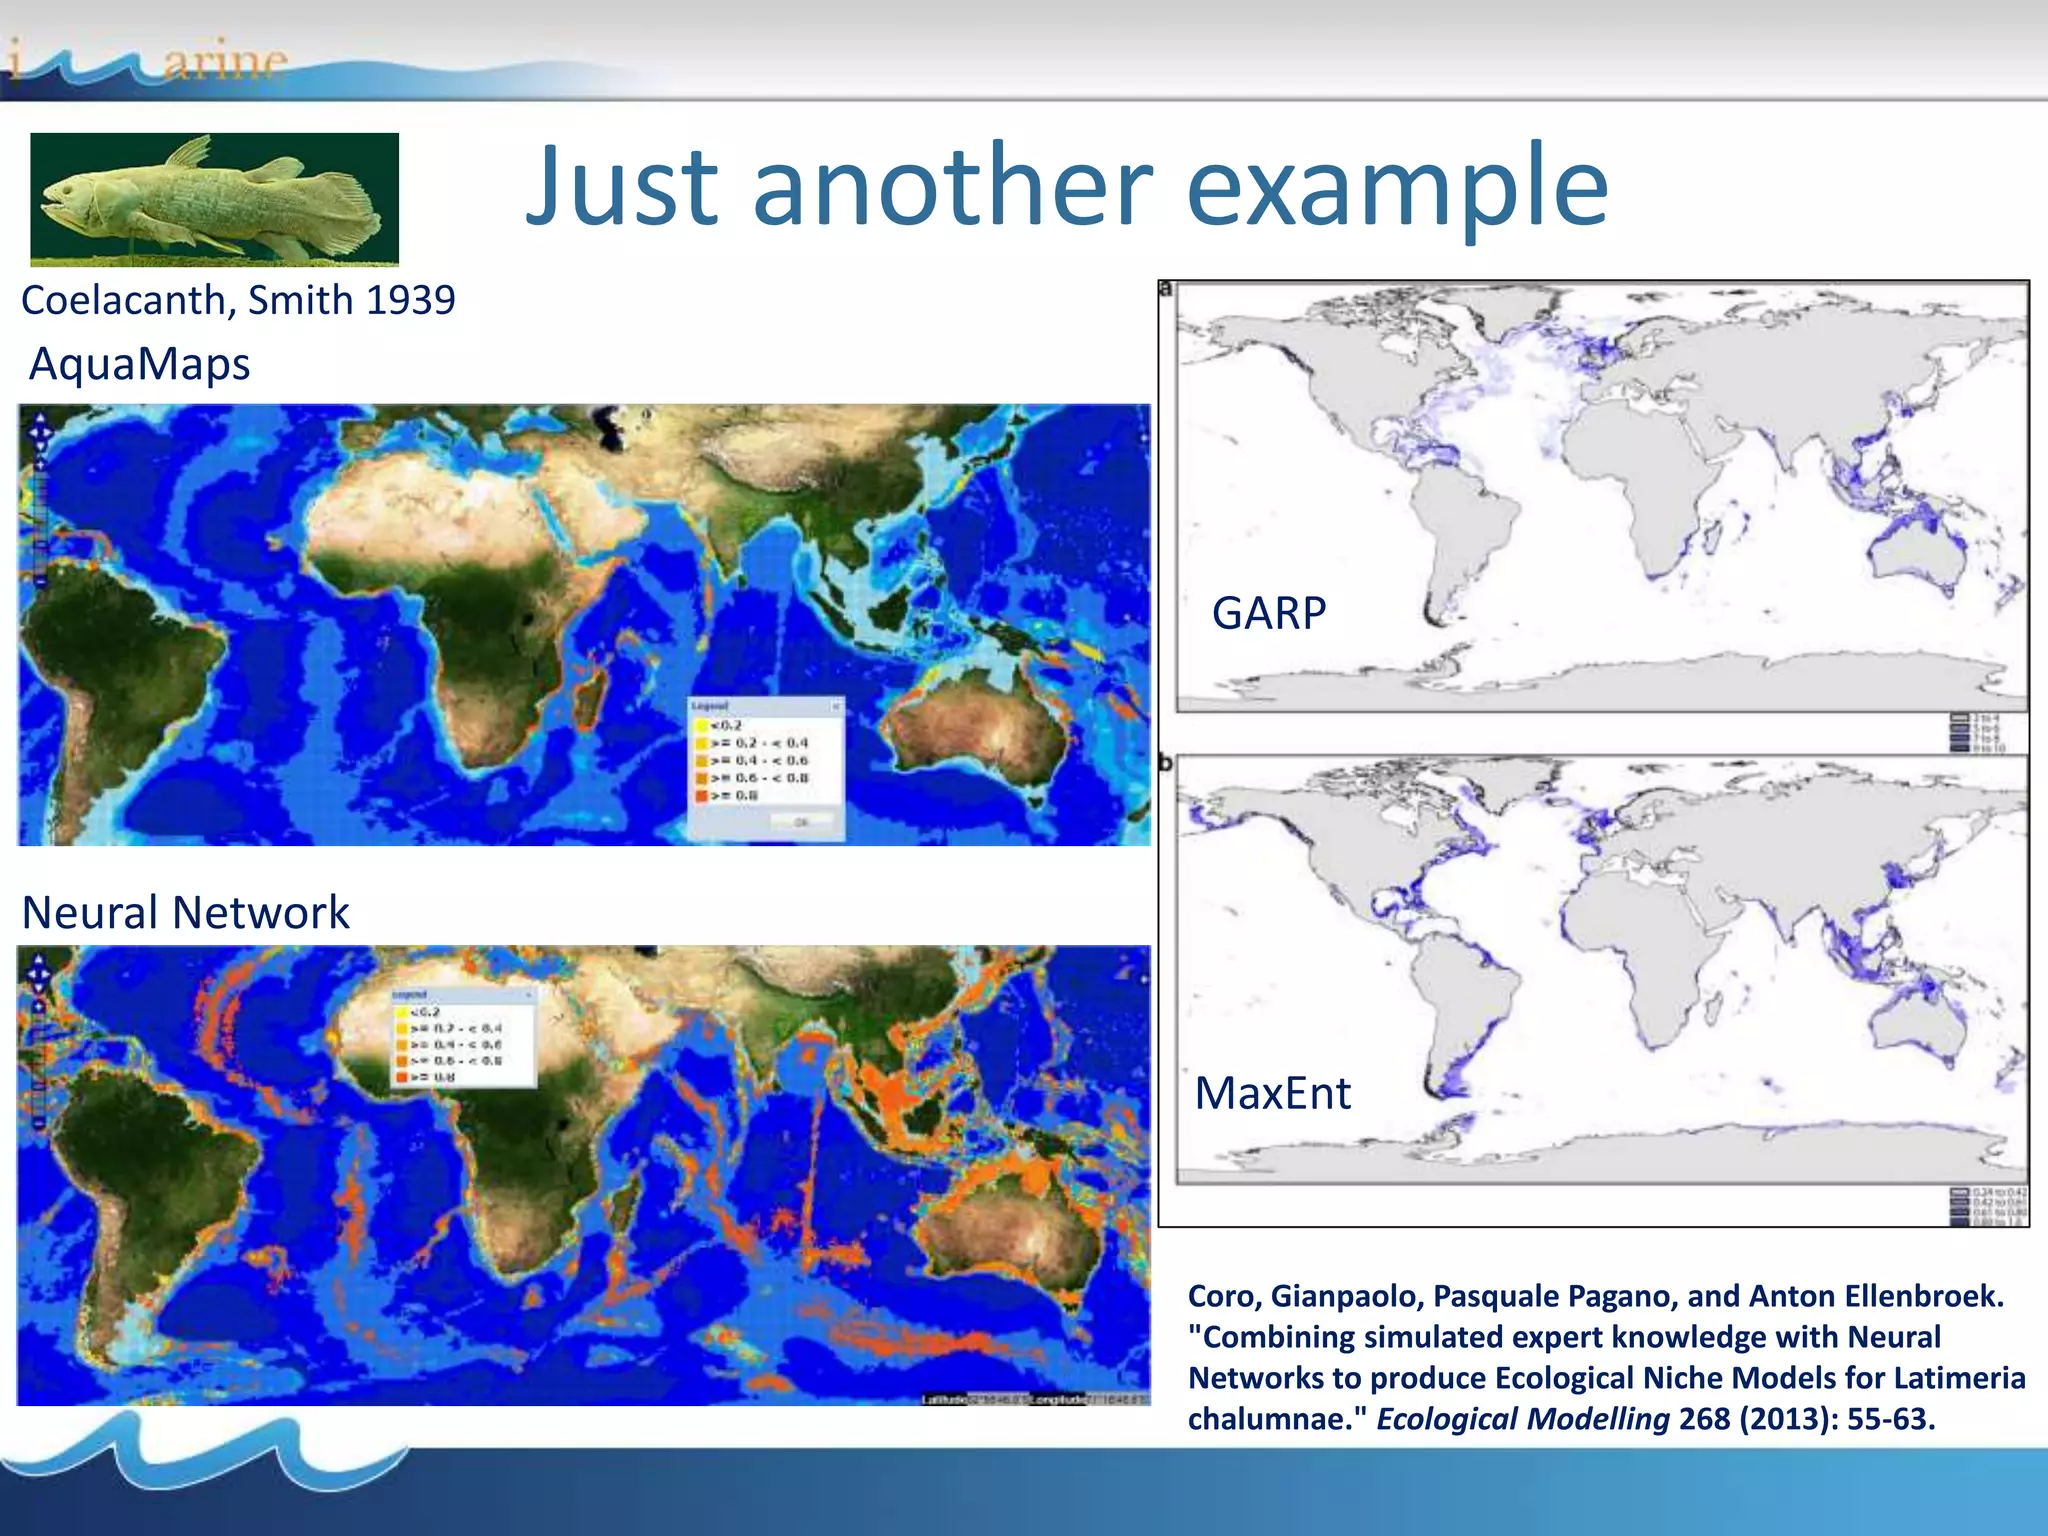
Using e-Infrastructures for
Biodiversity Conservation
Gianpaolo Coro
ISTI-CNR, Pisa, Italy
• Biodiversity and geospatial data
• Trends in biodiversity observations
• Combining species observations
• Combining biodiversity and geospatial data
Module 3 - Outline
D4Science
D4Science is both a Data and a Computational e-Infrastructure
• Used by several Projects: i-Marine, EUBrazil OpenBio, ENVRI;
• Implements the notion of e-Infrastructure as-a-Service: it offers on demand access to
data management services and computational facilities;
• Hosts several VREs for Fisheries Managers, Biologists, Statisticians…and Students.
D4Science - Resources
Large Set of Biodiversity
and Taxonomic Datasets
connected
A Network to
distribute and
access to
Geospatial Data
Distributed Storage
System to store
datasets and
documents
A Social
Network
to share
opinions and
useful news
Algorithms for Biology-
related experiments
• Biodiversity and geospatial data
• Trends in biodiversity observations
• Combining species observations
• Combining biodiversity and geospatial data
Module 3 - Outline
Biodiversity and Geospatial Data
Biodiversity Data Providers
i-Marine hosts biodiversity datasets coming from several data providers:
• Some are remotely accessed and are maintained by the respective owners;
• Other ones are resident in the e-Infrastructure.
Currently, the accessible datasets are:
• Catalogue of Life (CoL)
• Global Biodiversity Information Facility (GBIF),
• Integrated Taxonomic Information System (ITIS),
• Interim Register of Marine and Nonmarine Genera (IRMNG),
• Ocean Biogeographic Information System (OBIS),
• World Register of Marine Species (WoRMS)
• World Register of Deep-Sea Species ( WoRDSS )
Some data providers are collectors of other data providers, but the alignment is not
guaranteed!
The datasets allow to retrieve:
• Occurrence points (presence points or specimen)
• Taxa names
Online Examples:
http://www.catalogueoflife.org/
http://www.gbif.org/
http://www.iobis.org/
Geospatial Data Providers
Bio-ORACLE
NetCDF NetCDF
ASCII
ArcGIS
ASCII Raw formats
World Ocean Atlas
Online Examples:
http://www.myocean.eu
https://www.nodc.noaa.gov/OC5/woa13/
http://www.oracle.ugent.be/
ToolsUI ftp://ftp.unidata.ucar.edu/pub/netcdf-java/v4.5/toolsUI-4.5.jar
• Biodiversity and geospatial data
• Trends in biodiversity observations
• Combining species observations
• Combining biodiversity and geospatial data
Trendylyzer
Trendylyzer allows to
discover species
observation trends.
It is based on the
OBIS collector
OBIS
This trend tells the
story of the
Coelacanth discovery
Online Example:
the i-Marine Trendylyzer
https://i-marine.d4science.org/group/biodiversitylab/trends-production
• Biodiversity and geospatial data
• Trends in biodiversity observations
• Combining species observations
• Combining biodiversity and geospatial data
Cleaning
Union – Difference - Intersection
Occurrences Points Operations
A
x,y
Event Date
Modif Date
Author
Species Scientific
Name
d(x,y) < Distance Thr
=
LD(Author) * LD(SciName) > Lexical Thr
<Take the most recent>
B
x,y
Event Date
Modif Date
Author
Species Scientific
Name
Evaluate
Experiment
Solea solea
57 085 Records2 324 Records
1 871 Records
10 542 Records
Duplicates Deletion
with Exact Match
(DThr=0; LThr=1)
Subtraction
DThr=0.01; LThr=0 DThr=0.01; LThr=1
DThr=0.0001;
LThr=0.8
183 Records 0 Records 0 Records
Main remarks:
• The “recordedBy” fields contain
differences in names formats
• The Scientific Names fields are
different (names vs names and
codes)
• D4Science helps in collecting a
larger number of Solea solea
unique occurrence records
• Even if GBIF collects data from
OBIS, the coverage is not updated
Occurrences Points Operations
Occurrences Duplicates Deleter:
An algorithm for deleting similar occurrences in a sets of occurrence points coming from the
Species Discovery Facility of D4Science.
A
Occurrences Points Operations
Occurrences Intersection:
Between two Ocurrence Sets A and B, keeps the elements of the B that are similar to elements
in A.
A B
Occurrences Points Operations
Occurrences Subtraction:
Between two Ocurrence Sets A and B, keeps the elements of the A that are not similar
to any element in B
A B
Occurrences Points Operations
Occurrences Merger:
Between two Ocurrence Sets A and B, enriches A with the elements of B that are not in the A.
Updates the elements of the A with more recent elements in B. If one element in A corresponds
to several recent elements in B, these are substituted to the element of A.
A
B
Online experiments:
the i-Marine
Occurrence Management system
https://i-marine.d4science.org/group/biodiversitylab/processing-tools
• Biodiversity and geospatial data
• Trends in biodiversity observations
• Combining species observations
• Combining biodiversity and geospatial data
Module 3 - Outline
Combining Biodiversity and Geospatial data
Environmental layers
Species occurrence dataset
Enriched dataset
Online Experiments:
https://i-marine.d4science.org/group/biodiversitylab/processing-tools
One practical application
The giant squid - Architeuthis
16th century 2012
The giant squid (Architeuthis) has been reported worldwide even before the
16th century, and has recently been observed live in its habitat for the first
time.
Why rare species?
• Biological and evolutionary investigations
• Fisheries management policies and conservation
• Vulnerable Marine Ecosystems
• Key role in affecting biodiversity richness
• Indicators of degradation for aquatic ecosystems
Detecting rare species
• How to build a reliable distribution from few
observations?
• How to account for absence
locations?
• Is there any approach for
rare species?
Data quality
For rare species, data quality is fundamental:
• Reliable presence data
• Reliable absence locations
• High quality environmental features
• Non-noisy environmental features
Tools – i-marine.d4science.org
D4Science e-Infrastructure:
• Retrieve presence data
• Generate absence data
• Get environmental data
• Model, adjust data and
produce maps
• Share results
1. Presence data of A. dux from D4S
https://i-marine.d4science.org/group/biodiversitylab/species-data-discovery
2. Simulating A. dux absence locations from AquaMaps
https://i-marine.d4science.org/group/biodiversitylab/processing-tools
0<Prob. < 0.2AquaMaps Native
3. Environmental Features
https://i-
marine.d4science.org/group/biodiversitylab/ge
o-visualisation
https://i-
marine.d4science.org/group/biodiversitylab/pr
ocessing-tools
Most of these layers were
available in D4Science
Depth and Distance from land
were imported using the
Statistical Manager
4. MaxEnt model as filter
https://i-marine.d4science.org/group/biodiversitylab/processing-tools
MaxEnt
Env. features most
correlated to the giant
squid
Presence data
Env. data
Filtered Environmental Features
5. Presence/absence modelling:
Artificial Neural Networks (ANN)
Model trained on positive
and negative examples
In terms of env. features
Binary file
https://i-marine.d4science.org/group/biodiversitylab/processing-tools
Presence/absence data
Filtered env. features
6. Projection of the Neural Network
https://i-marine.d4science.org/group/biodiversitylab/processing-tools
7. Comparison
MaxEnt
(presence-only)
22.01% 21.68%
Similarity calculated using Maps
Comparison,
by Coro, Ellenbroek, Pagano
DOI: 10.1080/15481603.2014.959391
Expert map,
Nesis, 2003
Aquamaps
Suitable
(expert system)
Neural Network
(presence/absence)
42.83%
https://i-
marine.d4science.org/group/bio
diversitylab/processing-tools
Conclusions
• Using data quality enhancement produces high performance
distribution
• A presence/absence ANN combines these data
• Biological, observation and expert evidence confirm the prediction
by the ANN
Summary: modelling rare species
distributions
1. Retrieve high quality presence locations by relying on the metadata of the records,
2. Use expert knowledge or an expert system to detect absence locations.
Select absence locations as widespread as possible,
3. Select a number of environmental characteristics correlated to the species presence,
4. Use MaxEnt to filter the environmental characteristics that are really important with
respect to the presence points,
5. Train an Artificial Neural Network on presence and absence locations and select the best
learning topology,
6. Project the ANN at global scale, using the a resolution equal to the maximum in the
environmental features,
7. Train a MaxEnt model as comparison system.
Just another example
Coelacanth, Smith 1939
GARP
MaxEnt
AquaMaps
Neural Network
Coro, Gianpaolo, Pasquale Pagano, and Anton Ellenbroek.
"Combining simulated expert knowledge with Neural
Networks to produce Ecological Niche Models for Latimeria
chalumnae." Ecological Modelling 268 (2013): 55-63.

USING E-INFRASTRUCTURES FOR BIODIVERSITY CONSERVATION - Module 3

  • 1.
    Using e-Infrastructures for BiodiversityConservation Gianpaolo Coro ISTI-CNR, Pisa, Italy
  • 2.
    • Biodiversity andgeospatial data • Trends in biodiversity observations • Combining species observations • Combining biodiversity and geospatial data Module 3 - Outline
  • 3.
    D4Science D4Science is botha Data and a Computational e-Infrastructure • Used by several Projects: i-Marine, EUBrazil OpenBio, ENVRI; • Implements the notion of e-Infrastructure as-a-Service: it offers on demand access to data management services and computational facilities; • Hosts several VREs for Fisheries Managers, Biologists, Statisticians…and Students.
  • 4.
    D4Science - Resources LargeSet of Biodiversity and Taxonomic Datasets connected A Network to distribute and access to Geospatial Data Distributed Storage System to store datasets and documents A Social Network to share opinions and useful news Algorithms for Biology- related experiments
  • 5.
    • Biodiversity andgeospatial data • Trends in biodiversity observations • Combining species observations • Combining biodiversity and geospatial data Module 3 - Outline
  • 6.
  • 7.
    Biodiversity Data Providers i-Marinehosts biodiversity datasets coming from several data providers: • Some are remotely accessed and are maintained by the respective owners; • Other ones are resident in the e-Infrastructure. Currently, the accessible datasets are: • Catalogue of Life (CoL) • Global Biodiversity Information Facility (GBIF), • Integrated Taxonomic Information System (ITIS), • Interim Register of Marine and Nonmarine Genera (IRMNG), • Ocean Biogeographic Information System (OBIS), • World Register of Marine Species (WoRMS) • World Register of Deep-Sea Species ( WoRDSS ) Some data providers are collectors of other data providers, but the alignment is not guaranteed! The datasets allow to retrieve: • Occurrence points (presence points or specimen) • Taxa names
  • 8.
  • 9.
    Geospatial Data Providers Bio-ORACLE NetCDFNetCDF ASCII ArcGIS ASCII Raw formats World Ocean Atlas
  • 10.
  • 11.
    • Biodiversity andgeospatial data • Trends in biodiversity observations • Combining species observations • Combining biodiversity and geospatial data
  • 12.
    Trendylyzer Trendylyzer allows to discoverspecies observation trends. It is based on the OBIS collector OBIS This trend tells the story of the Coelacanth discovery
  • 13.
    Online Example: the i-MarineTrendylyzer https://i-marine.d4science.org/group/biodiversitylab/trends-production
  • 14.
    • Biodiversity andgeospatial data • Trends in biodiversity observations • Combining species observations • Combining biodiversity and geospatial data
  • 15.
  • 16.
    Union – Difference- Intersection
  • 17.
    Occurrences Points Operations A x,y EventDate Modif Date Author Species Scientific Name d(x,y) < Distance Thr = LD(Author) * LD(SciName) > Lexical Thr <Take the most recent> B x,y Event Date Modif Date Author Species Scientific Name Evaluate
  • 18.
    Experiment Solea solea 57 085Records2 324 Records 1 871 Records 10 542 Records Duplicates Deletion with Exact Match (DThr=0; LThr=1) Subtraction DThr=0.01; LThr=0 DThr=0.01; LThr=1 DThr=0.0001; LThr=0.8 183 Records 0 Records 0 Records Main remarks: • The “recordedBy” fields contain differences in names formats • The Scientific Names fields are different (names vs names and codes) • D4Science helps in collecting a larger number of Solea solea unique occurrence records • Even if GBIF collects data from OBIS, the coverage is not updated
  • 19.
    Occurrences Points Operations OccurrencesDuplicates Deleter: An algorithm for deleting similar occurrences in a sets of occurrence points coming from the Species Discovery Facility of D4Science. A
  • 20.
    Occurrences Points Operations OccurrencesIntersection: Between two Ocurrence Sets A and B, keeps the elements of the B that are similar to elements in A. A B
  • 21.
    Occurrences Points Operations OccurrencesSubtraction: Between two Ocurrence Sets A and B, keeps the elements of the A that are not similar to any element in B A B
  • 22.
    Occurrences Points Operations OccurrencesMerger: Between two Ocurrence Sets A and B, enriches A with the elements of B that are not in the A. Updates the elements of the A with more recent elements in B. If one element in A corresponds to several recent elements in B, these are substituted to the element of A. A B
  • 23.
    Online experiments: the i-Marine OccurrenceManagement system https://i-marine.d4science.org/group/biodiversitylab/processing-tools
  • 24.
    • Biodiversity andgeospatial data • Trends in biodiversity observations • Combining species observations • Combining biodiversity and geospatial data Module 3 - Outline
  • 25.
    Combining Biodiversity andGeospatial data Environmental layers Species occurrence dataset Enriched dataset
  • 26.
  • 27.
  • 28.
    The giant squid- Architeuthis 16th century 2012 The giant squid (Architeuthis) has been reported worldwide even before the 16th century, and has recently been observed live in its habitat for the first time.
  • 29.
    Why rare species? •Biological and evolutionary investigations • Fisheries management policies and conservation • Vulnerable Marine Ecosystems • Key role in affecting biodiversity richness • Indicators of degradation for aquatic ecosystems
  • 30.
    Detecting rare species •How to build a reliable distribution from few observations? • How to account for absence locations? • Is there any approach for rare species?
  • 31.
    Data quality For rarespecies, data quality is fundamental: • Reliable presence data • Reliable absence locations • High quality environmental features • Non-noisy environmental features
  • 32.
    Tools – i-marine.d4science.org D4Sciencee-Infrastructure: • Retrieve presence data • Generate absence data • Get environmental data • Model, adjust data and produce maps • Share results
  • 33.
    1. Presence dataof A. dux from D4S https://i-marine.d4science.org/group/biodiversitylab/species-data-discovery
  • 34.
    2. Simulating A.dux absence locations from AquaMaps https://i-marine.d4science.org/group/biodiversitylab/processing-tools 0<Prob. < 0.2AquaMaps Native
  • 35.
    3. Environmental Features https://i- marine.d4science.org/group/biodiversitylab/ge o-visualisation https://i- marine.d4science.org/group/biodiversitylab/pr ocessing-tools Mostof these layers were available in D4Science Depth and Distance from land were imported using the Statistical Manager
  • 36.
    4. MaxEnt modelas filter https://i-marine.d4science.org/group/biodiversitylab/processing-tools MaxEnt Env. features most correlated to the giant squid Presence data Env. data
  • 37.
  • 38.
    5. Presence/absence modelling: ArtificialNeural Networks (ANN) Model trained on positive and negative examples In terms of env. features Binary file https://i-marine.d4science.org/group/biodiversitylab/processing-tools Presence/absence data Filtered env. features
  • 39.
    6. Projection ofthe Neural Network https://i-marine.d4science.org/group/biodiversitylab/processing-tools
  • 40.
    7. Comparison MaxEnt (presence-only) 22.01% 21.68% Similaritycalculated using Maps Comparison, by Coro, Ellenbroek, Pagano DOI: 10.1080/15481603.2014.959391 Expert map, Nesis, 2003 Aquamaps Suitable (expert system) Neural Network (presence/absence) 42.83% https://i- marine.d4science.org/group/bio diversitylab/processing-tools
  • 41.
    Conclusions • Using dataquality enhancement produces high performance distribution • A presence/absence ANN combines these data • Biological, observation and expert evidence confirm the prediction by the ANN
  • 42.
    Summary: modelling rarespecies distributions 1. Retrieve high quality presence locations by relying on the metadata of the records, 2. Use expert knowledge or an expert system to detect absence locations. Select absence locations as widespread as possible, 3. Select a number of environmental characteristics correlated to the species presence, 4. Use MaxEnt to filter the environmental characteristics that are really important with respect to the presence points, 5. Train an Artificial Neural Network on presence and absence locations and select the best learning topology, 6. Project the ANN at global scale, using the a resolution equal to the maximum in the environmental features, 7. Train a MaxEnt model as comparison system.
  • 43.
    Just another example Coelacanth,Smith 1939 GARP MaxEnt AquaMaps Neural Network Coro, Gianpaolo, Pasquale Pagano, and Anton Ellenbroek. "Combining simulated expert knowledge with Neural Networks to produce Ecological Niche Models for Latimeria chalumnae." Ecological Modelling 268 (2013): 55-63.