Download to read offline
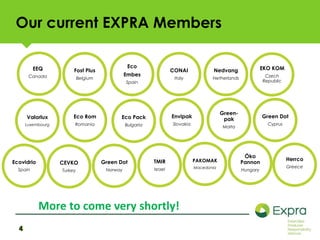
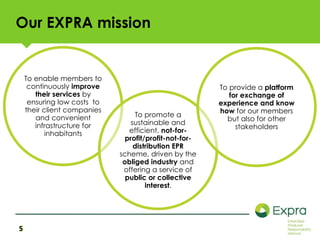
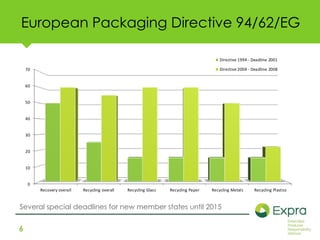
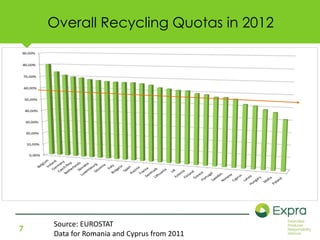
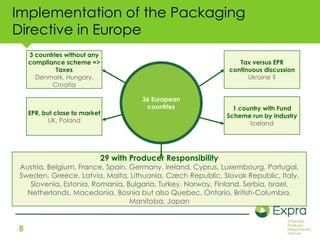
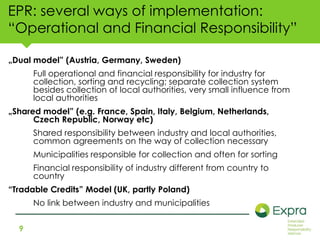
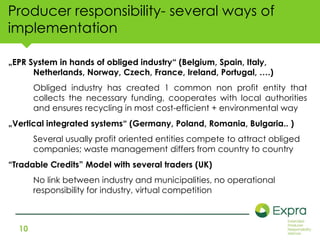
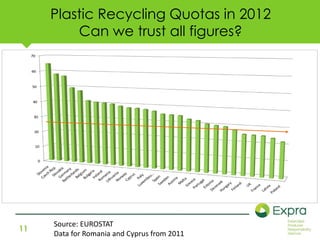


This document summarizes a presentation given by Joachim Quoden, the Managing Director of EXPRA, on the challenges of circular economy in packaging. Some key points: - EXPRA is an alliance of non-profit packaging waste recovery and recycling systems owned by obliged industry across Europe and Israel. It aims to improve services and promote sustainable EPR schemes. - EPR implementation varies across countries, from dual models with industry responsibility to shared responsibility between industry and municipalities. Data quality on recycling rates also varies between countries. - New EU proposals include more ambitious recycling targets, changing the measurement point to post-recycling, and vague EPR criteria that don't address key issues. EXPR