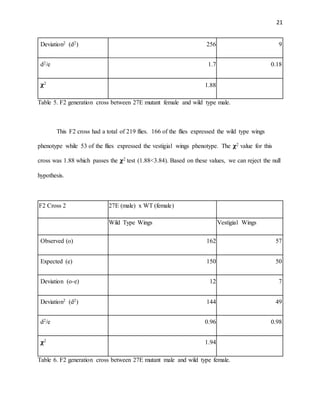
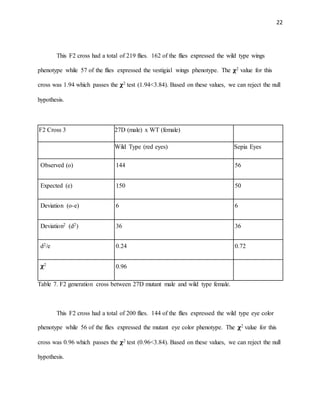
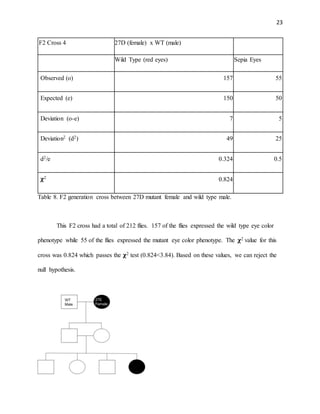
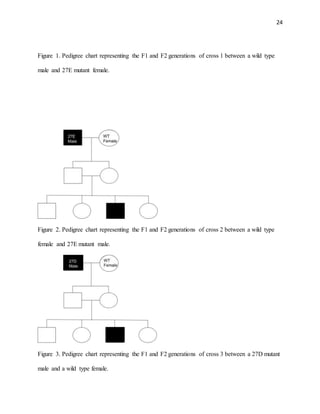
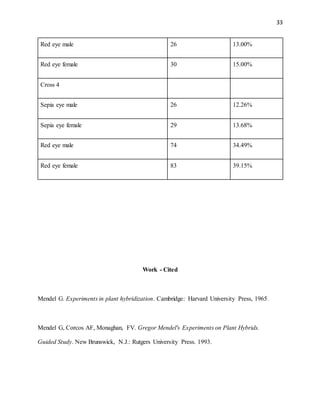
This document summarizes an experiment using Mendelian genetics to study the inheritance of traits in Drosophila melanogaster (fruit flies). Two mutant fly strains, 27D with brown eyes and 27E with vestigial wings, were crossed with a wild-type strain to observe phenotypic ratios over multiple generations. The F1 offspring all expressed the dominant traits, while the F2 offspring showed Mendel's expected 3:1 ratio between dominant and recessive traits, supporting the hypothesis that the mutant traits were autosomal recessive. The experiment demonstrated how Mendelian genetics can be used to determine unknown genotypes through observing inheritance patterns over generations.
Heridity and Evolution - Biology Class 10 CBSEAthira S
This Powerpoint Presentation is on the chapter Heredity and Evolution from class 10 Biology in CBSE Board. The contents of the presentation are from the NCERT science textbook for class 10 and Lakhmir Singh Biology Handbook Class 10.
IF YOU ARE GOING TO DOWNLOAD THIS FILE, PLEASE NOTIFY me by sending a message via Facebook.
It's a pleasure to help you through my presentation. Thank you so much!
Discuss the methods Mendel utilized in his research that led to his success in understanding the process of inheritance
The science community ignored the paper, possibly because it was ahead of the ideas of heredity and variation accepted at the time. In the early 1900s, 3 plant biologists finally acknowledged Mendel’s work. Unfortunately, Mendel was not around to receive the recognition as he had died in 1884.
Concept of quantitative inheritance, Difference between qualitative and quantitative
Traits, Inheritance of quantitative trait in Maize (Cob length),
Cytoplasmic inheritance: Definition and concept, Chloroplast- Variation in Four O’clock plants,
Mitochondria- Petite mutants in yeast
Genetics- Chapter 5 - Principles of inheritance and variation.docxAjay Kumar Gautam
Genetics is a branch of biology concerned with the study of genes, genetic variation, and heredity in organisms. Though heredity had been observed for millennia, Gregor Mendel, Moravian scientist and Augustinian friar working in the 19th century in Brno, was the first to study genetics scientifically. Mendel studied "trait inheritance", patterns in the way traits are handed down from parents to offspring over time. He observed that organisms (pea plants) inherit traits by way of discrete "units of inheritance". This term, still used today, is a somewhat ambiguous definition of what is referred to as a gene.
This pdf comprises of Basic of Genetics: Purpose: To convey that “Genetics is to biology what Newton’s
laws are to Physical Sciences”. Mendel’s laws, Concept of segregation and
independent assortment. Concept of allele. Gene mapping, Gene
interaction, Epistasis. Meiosis and Mitosis be taught as a part of
genetics. Emphasis to be give not to the mechanics of cell division nor the
phases but how genetic material passes from parent to offspring. Concepts
of recessiveness and dominance. Concept of mapping of phenotype to
genes. Discuss about the single gene disorders in humans. Discuss the
concept of complementation using human genetics.
Similar to Jenna Rose Kol Deciphering Phenotypic Ratios Using Mendelian Genetics (20)
These simplified slides by Dr. Sidra Arshad present an overview of the non-respiratory functions of the respiratory tract.
Learning objectives:
1. Enlist the non-respiratory functions of the respiratory tract
2. Briefly explain how these functions are carried out
3. Discuss the significance of dead space
4. Differentiate between minute ventilation and alveolar ventilation
5. Describe the cough and sneeze reflexes
Study Resources:
1. Chapter 39, Guyton and Hall Textbook of Medical Physiology, 14th edition
2. Chapter 34, Ganong’s Review of Medical Physiology, 26th edition
3. Chapter 17, Human Physiology by Lauralee Sherwood, 9th edition
4. Non-respiratory functions of the lungs https://academic.oup.com/bjaed/article/13/3/98/278874
Factory Supply Best Quality Pmk Oil CAS 28578–16–7 PMK Powder in Stockrebeccabio
Factory Supply Best Quality Pmk Oil CAS 28578–16–7 PMK Powder in Stock
Telegram: bmksupplier
signal: +85264872720
threema: TUD4A6YC
You can contact me on Telegram or Threema
Communicate promptly and reply
Free of customs clearance, Double Clearance 100% pass delivery to USA, Canada, Spain, Germany, Netherland, Poland, Italy, Sweden, UK, Czech Republic, Australia, Mexico, Russia, Ukraine, Kazakhstan.Door to door service
Hot Selling Organic intermediates
Anti ulcer drugs and their Advance pharmacology ||
Anti-ulcer drugs are medications used to prevent and treat ulcers in the stomach and upper part of the small intestine (duodenal ulcers). These ulcers are often caused by an imbalance between stomach acid and the mucosal lining, which protects the stomach lining.
||Scope: Overview of various classes of anti-ulcer drugs, their mechanisms of action, indications, side effects, and clinical considerations.
HOT NEW PRODUCT! BIG SALES FAST SHIPPING NOW FROM CHINA!! EU KU DB BK substit...GL Anaacs
Contact us if you are interested:
Email / Skype : kefaya1771@gmail.com
Threema: PXHY5PDH
New BATCH Ku !!! MUCH IN DEMAND FAST SALE EVERY BATCH HAPPY GOOD EFFECT BIG BATCH !
Contact me on Threema or skype to start big business!!
Hot-sale products:
NEW HOT EUTYLONE WHITE CRYSTAL!!
5cl-adba precursor (semi finished )
5cl-adba raw materials
ADBB precursor (semi finished )
ADBB raw materials
APVP powder
5fadb/4f-adb
Jwh018 / Jwh210
Eutylone crystal
Protonitazene (hydrochloride) CAS: 119276-01-6
Flubrotizolam CAS: 57801-95-3
Metonitazene CAS: 14680-51-4
Payment terms: Western Union,MoneyGram,Bitcoin or USDT.
Deliver Time: Usually 7-15days
Shipping method: FedEx, TNT, DHL,UPS etc.Our deliveries are 100% safe, fast, reliable and discreet.
Samples will be sent for your evaluation!If you are interested in, please contact me, let's talk details.
We specializes in exporting high quality Research chemical, medical intermediate, Pharmaceutical chemicals and so on. Products are exported to USA, Canada, France, Korea, Japan,Russia, Southeast Asia and other countries.
Lung Cancer: Artificial Intelligence, Synergetics, Complex System Analysis, S...Oleg Kshivets
RESULTS: Overall life span (LS) was 2252.1±1742.5 days and cumulative 5-year survival (5YS) reached 73.2%, 10 years – 64.8%, 20 years – 42.5%. 513 LCP lived more than 5 years (LS=3124.6±1525.6 days), 148 LCP – more than 10 years (LS=5054.4±1504.1 days).199 LCP died because of LC (LS=562.7±374.5 days). 5YS of LCP after bi/lobectomies was significantly superior in comparison with LCP after pneumonectomies (78.1% vs.63.7%, P=0.00001 by log-rank test). AT significantly improved 5YS (66.3% vs. 34.8%) (P=0.00000 by log-rank test) only for LCP with N1-2. Cox modeling displayed that 5YS of LCP significantly depended on: phase transition (PT) early-invasive LC in terms of synergetics, PT N0—N12, cell ratio factors (ratio between cancer cells- CC and blood cells subpopulations), G1-3, histology, glucose, AT, blood cell circuit, prothrombin index, heparin tolerance, recalcification time (P=0.000-0.038). Neural networks, genetic algorithm selection and bootstrap simulation revealed relationships between 5YS and PT early-invasive LC (rank=1), PT N0—N12 (rank=2), thrombocytes/CC (3), erythrocytes/CC (4), eosinophils/CC (5), healthy cells/CC (6), lymphocytes/CC (7), segmented neutrophils/CC (8), stick neutrophils/CC (9), monocytes/CC (10); leucocytes/CC (11). Correct prediction of 5YS was 100% by neural networks computing (area under ROC curve=1.0; error=0.0).
CONCLUSIONS: 5YS of LCP after radical procedures significantly depended on: 1) PT early-invasive cancer; 2) PT N0--N12; 3) cell ratio factors; 4) blood cell circuit; 5) biochemical factors; 6) hemostasis system; 7) AT; 8) LC characteristics; 9) LC cell dynamics; 10) surgery type: lobectomy/pneumonectomy; 11) anthropometric data. Optimal diagnosis and treatment strategies for LC are: 1) screening and early detection of LC; 2) availability of experienced thoracic surgeons because of complexity of radical procedures; 3) aggressive en block surgery and adequate lymph node dissection for completeness; 4) precise prediction; 5) adjuvant chemoimmunoradiotherapy for LCP with unfavorable prognosis.
Title: Sense of Taste
Presenter: Dr. Faiza, Assistant Professor of Physiology
Qualifications:
MBBS (Best Graduate, AIMC Lahore)
FCPS Physiology
ICMT, CHPE, DHPE (STMU)
MPH (GC University, Faisalabad)
MBA (Virtual University of Pakistan)
Learning Objectives:
Describe the structure and function of taste buds.
Describe the relationship between the taste threshold and taste index of common substances.
Explain the chemical basis and signal transduction of taste perception for each type of primary taste sensation.
Recognize different abnormalities of taste perception and their causes.
Key Topics:
Significance of Taste Sensation:
Differentiation between pleasant and harmful food
Influence on behavior
Selection of food based on metabolic needs
Receptors of Taste:
Taste buds on the tongue
Influence of sense of smell, texture of food, and pain stimulation (e.g., by pepper)
Primary and Secondary Taste Sensations:
Primary taste sensations: Sweet, Sour, Salty, Bitter, Umami
Chemical basis and signal transduction mechanisms for each taste
Taste Threshold and Index:
Taste threshold values for Sweet (sucrose), Salty (NaCl), Sour (HCl), and Bitter (Quinine)
Taste index relationship: Inversely proportional to taste threshold
Taste Blindness:
Inability to taste certain substances, particularly thiourea compounds
Example: Phenylthiocarbamide
Structure and Function of Taste Buds:
Composition: Epithelial cells, Sustentacular/Supporting cells, Taste cells, Basal cells
Features: Taste pores, Taste hairs/microvilli, and Taste nerve fibers
Location of Taste Buds:
Found in papillae of the tongue (Fungiform, Circumvallate, Foliate)
Also present on the palate, tonsillar pillars, epiglottis, and proximal esophagus
Mechanism of Taste Stimulation:
Interaction of taste substances with receptors on microvilli
Signal transduction pathways for Umami, Sweet, Bitter, Sour, and Salty tastes
Taste Sensitivity and Adaptation:
Decrease in sensitivity with age
Rapid adaptation of taste sensation
Role of Saliva in Taste:
Dissolution of tastants to reach receptors
Washing away the stimulus
Taste Preferences and Aversions:
Mechanisms behind taste preference and aversion
Influence of receptors and neural pathways
Impact of Sensory Nerve Damage:
Degeneration of taste buds if the sensory nerve fiber is cut
Abnormalities of Taste Detection:
Conditions: Ageusia, Hypogeusia, Dysgeusia (parageusia)
Causes: Nerve damage, neurological disorders, infections, poor oral hygiene, adverse drug effects, deficiencies, aging, tobacco use, altered neurotransmitter levels
Neurotransmitters and Taste Threshold:
Effects of serotonin (5-HT) and norepinephrine (NE) on taste sensitivity
Supertasters:
25% of the population with heightened sensitivity to taste, especially bitterness
Increased number of fungiform papillae
These lecture slides, by Dr Sidra Arshad, offer a quick overview of physiological basis of a normal electrocardiogram.
Learning objectives:
1. Define an electrocardiogram (ECG) and electrocardiography
2. Describe how dipoles generated by the heart produce the waveforms of the ECG
3. Describe the components of a normal electrocardiogram of a typical bipolar leads (limb II)
4. Differentiate between intervals and segments
5. Enlist some common indications for obtaining an ECG
Study Resources:
1. Chapter 11, Guyton and Hall Textbook of Medical Physiology, 14th edition
2. Chapter 9, Human Physiology - From Cells to Systems, Lauralee Sherwood, 9th edition
3. Chapter 29, Ganong’s Review of Medical Physiology, 26th edition
4. Electrocardiogram, StatPearls - https://www.ncbi.nlm.nih.gov/books/NBK549803/
5. ECG in Medical Practice by ABM Abdullah, 4th edition
6. ECG Basics, http://www.nataliescasebook.com/tag/e-c-g-basics
Prix Galien International 2024 Forum ProgramLevi Shapiro
June 20, 2024, Prix Galien International and Jerusalem Ethics Forum in ROME. Detailed agenda including panels:
- ADVANCES IN CARDIOLOGY: A NEW PARADIGM IS COMING
- WOMEN’S HEALTH: FERTILITY PRESERVATION
- WHAT’S NEW IN THE TREATMENT OF INFECTIOUS,
ONCOLOGICAL AND INFLAMMATORY SKIN DISEASES?
- ARTIFICIAL INTELLIGENCE AND ETHICS
- GENE THERAPY
- BEYOND BORDERS: GLOBAL INITIATIVES FOR DEMOCRATIZING LIFE SCIENCE TECHNOLOGIES AND PROMOTING ACCESS TO HEALTHCARE
- ETHICAL CHALLENGES IN LIFE SCIENCES
- Prix Galien International Awards Ceremony
The prostate is an exocrine gland of the male mammalian reproductive system
It is a walnut-sized gland that forms part of the male reproductive system and is located in front of the rectum and just below the urinary bladder
Function is to store and secrete a clear, slightly alkaline fluid that constitutes 10-30% of the volume of the seminal fluid that along with the spermatozoa, constitutes semen
A healthy human prostate measures (4cm-vertical, by 3cm-horizontal, 2cm ant-post ).
It surrounds the urethra just below the urinary bladder. It has anterior, median, posterior and two lateral lobes
It’s work is regulated by androgens which are responsible for male sex characteristics
Generalised disease of the prostate due to hormonal derangement which leads to non malignant enlargement of the gland (increase in the number of epithelial cells and stromal tissue)to cause compression of the urethra leading to symptoms (LUTS
ARTIFICIAL INTELLIGENCE IN HEALTHCARE.pdfAnujkumaranit
Artificial intelligence (AI) refers to the simulation of human intelligence processes by machines, especially computer systems. It encompasses tasks such as learning, reasoning, problem-solving, perception, and language understanding. AI technologies are revolutionizing various fields, from healthcare to finance, by enabling machines to perform tasks that typically require human intelligence.
The POPPY STUDY (Preconception to post-partum cardiovascular function in prim...
Jenna Rose Kol Deciphering Phenotypic Ratios Using Mendelian Genetics
1. Jenna Kol
Bio 1C
10th May 2019
Using Mendelian Genetics to Decipher Phenotypic Inheritance Present in the Cross Genetics of
Mutant and Wild Type Genes of Drosophila melanogaster
Abstract
Genetics is the study of heredity and the probability of inherited characteristics.
Developed by Mendel, Mendelian Genetics provided support on how the laws of inheritance
work. Mendelian genetics were used to find the phenotypic ratios between the heterozygous
offspring of two true breeding organisms. The modeled organism for this experiment is the
Drosophila melanogaster. Within this experiment, the unknown genotypes of two unknown
mutant types were observed by using the mendelian genetics. Mutant 27D and Mutant 27 E were
hypothesized to contain autosomal recessive traits. Both the mutant types produced heterozygous
offspring and followed the expected phenotypic ratios of Mendel within each generation. Thus,
the hypothesis was proven correct and the two mutant types represent autosomal recessive genes.
Introduction
None of us are the same. We are all entirely different. We are array of different shapes,
sizes, forms, different features, characteristics, different eye colors, skin tones. So what accounts
for the heritable variations of traits that result from the parents to the offspring? During the
1800s heredity was mostly favored just for its mere idea that the genetic material of one was just
a mixture of two parents; giving it the name “blending hypothesis” (Campbell 2013). The idea
simply proposed that over many generations, a population will set a uniform population of
individuals with an inherited trait that is unidentifiable. Arising from this blending model, was
the “particulate hypothesis” of inheritance which standardized the idea of genes (Campbell
2. 2
2013). Parents are able to pass down heritable genes present within themselves, however, retain a
separate identity within the offspring. All of these theories of inheritance were largely presumed
through assumption rather than factual experimentation. This was until a monk named Gregor
Mendel developed a mechanism that drove his legacy as the founder of modern genetics.
Genetics is the study of heredity and the probability of inherited characteristics.
Developed by Mendel, Mendelian Genetics provided support on how the laws of inheritance
work. The idea of heredity was supported through the observations of traits inherited from one
generation to the next in the pea plants, Pisum sativum (Jefferson 2009). In developing his
experiment Mendel took a quantitative approach to choosing an appropriate model organism.
Mendel called a heritable feature, a feature that varies among individuals, in this case the flower
color, a character. The variant for the character, such as white or purple flowers is called a trait.
Mendel had chosen pea plants as a model of his experiment due to its many different
varieties, its short generation of time, the large numbers of offspring produced from mating, and
that their mating could be controlled. He wanted to track characteristics that were distinct and
came in two alternative forms. In this case, the objective of this experiment was to study the
pattern of inheritance of either purple or white flower color. He made sure that the start of the
experiment consisted the cross between true-breeding parents, meaning over a series of
generations, the offspring would only show variation presented in those of the parent generation.
Mendel performed, what is known as hybridization, the cross between two-true breeding parents
with different phenotypes (Mendel 1965). One’s phenotypes is an observed characteristic,
physical expression, that is influenced by the interaction of its genotype with the environment.
One’s genotype is a set of genes that it carries, or the genetic makeup of what makes a trait.
Mendel referred genes as a heritable factor.
3. 3
The true-breeding parents, the white flower and the purple flower, was referred to as the
P – generation (parental generation). The cross between the two true breeding parents resulted in
a heterozygous hybrid offspring referred to as the F1 generation. The F1 generation also stands
for filial generation, deriving from the Latin word meaning “son” (Corcos et. al.). The genotype
ratio is 1, meaning all flowers would represent a color and the specific color it represented
resulted in a phenotype ratio 1; all plants produced purple flowers. Mendel than allowed the F1
hybrids to self – pollinate or cross pollinate with the other F1 hybrids to produce the second filial
generation also known as the F2 generation. The results concluded that the F2’s yielded a 3:1
ratio within the phenotypes. Thus, for every three purple flowers produced, one white flower
would be produced.
An allele refers to the alternative versions of genes. In this case, alleles refer to the
alternation in genes represented by the flower color. Purple flowers persisted in the F1
generation. According to Mendel, this occurred because the allele for this trait is dominant.
Furthermore, since the white flower was not present in the F1 generation, but re-appeared in the
following generations, Mendel claimed that the allele for this trait is recessive. Mendel
represented a dominant trait as capital letter P and used a lowercase p to represent the recessive
trait. The plant could either receive two dominant traits AA, one with a dominant and recessive
trait Aa, or two recessive traits aa.
Mendel continued to grow generation after to generation to track the pattern of the
heritability of these traits (Jefferson 2009). After continuous trials, Mendel had yielded the same
mathematical ratios present in each F1 and F2 generation. Mendel concluded that the purple
would continuously be present in the F1 generation and the F2 generation would yield the
4. 4
randomized combo of gametes in a 3:1 ratio. From this Mendel derived two fundamental
properties, the law of segregation and the law of independent assortment.
The law of segregation states that during gamete formation, two alleles in a gene pair will
segregate, in which half the gametes will display one allele, while the other half will display the
other allele (Mendel 1993). This law was specifically displayed within the F1 hybrids. Half of
the gametes will have a purple flower allele, and the other half will have a white-flower allele.
F2 generation is then produced from the self-pollination of the F1 generation. In order to show
all the combinations of the alleles within the offspring, a Punnett square can be used. Within the
F2 generation, gametes combined randomly to form the 3:1 ratio as predicted in the Punnett
squares.
In order to study the pattern of inheritance of traits, Mendel chose organisms that were
readily available, reached adult life cycle at a fast rate, was able to control breeding, and didn’t
consume much space. Another modeled organism that replicated these traits, and was great for
experiments involving genetics, is the Drosophila melanogaster.
D. melanogaster has four stages within its life cycle: egg, larva, pupa, and adult. To reach
adulthood, it takes only about 14 days. However, temperature and light play two vital factors
within this organism. In warmer temperatures adults will form faster, and when exposed to
sufficient amount of light, fertility rate of flies will increase.
A cross is referred to as the specific breeding of one population with another. If the cross
of two true breeding is conducted, then heterozygous offspring will form. If one was to observe
the phenotypic ratio displayed within each generation of the cross of two true breeding parents,
the patterns of inheritance can be discovered of a specific gene (Jefferson 2009). D.
melanogaster, is a diploid, meaning one gene will be expressed over the other. When two
5. 5
dominant alleles pair up with another, they form a dominant genotype (XX), which result in a
dominant trait. However, the dominant trait can be expressed within a heterozygous genotype. A
heterozygous genotype is when a dominant allele is paired with a recessive allele (Xx). If two
recessive alleles par with one another, a homozygous recessive genotype is formed, thus a
recessive trait is expressed (xx).
Phenotyping is a method used to predict an organism’s phenotype by observing traits
expressed by an organism. A “wild-type” version of an organism is naturally occurring. Thus,
phenotypes of a wild type are traits from an organism is influenced from its natural environment.
A wild type D. melanogaster contains the following phenotypes: red eyes, normal wings
(transparent and long), black thorax, and brown abdomen. Wild type version of D. melanogaster
was crossed with unknown mutant types of the D. melanogaster. Two mutant types were also
used in the basis of this experiment. The first mutant type, called 27 D, displayed an autosomal
recessive trait of brown eyes. The second mutant type called 27 E, also displayed an autosomal
recessive trait of vestigial wings. Within this experiment four specific crosses were done within
each of the different populations. In order to predict the phenotypic ratios within each generation,
a Punnett square is used.
Figure 1 displays the prediction of the phenotypic probability of cross 1 within the first
generation. The cross was done between the wild type and mutant 27D. The wild type
represented the homozygous dominant normal wing (DD), and the mutant 27 D, represented the
heterozygous recessive vestigial wing (dd). The cross resulted in a heterozygous genotype where
the dominant phenotype was displayed. In this case, the phenotypic percentage of WT wings
displayed in the F1 generation was 100%. Also shown in the Punnett square, the dominant gene
6. 6
is expressed more frequently than the recessive gene, thus the dominant trait was shown. The
same results occurred for all four different crosses within the F1 generation.
D D
d Dd Dd
d Dd Dd
Figure 1: 27D mutant crossedwith WildType Flies toproduce heterozygous F1 offspring
The F1 generation was then mated amongst one another to produce the F2 generation.
The genotypic ratio displayed in the F2 is a 1:2:1 where the F2 population has a 25% chance of
displaying the dominant genotype (DD), 50% change of displaying the heterozygous genotype
(Dd), and the 25% chance of displaying the heterozygous genotype (dd). The phenotypic ratio is
3:1 where 75% of the population will express the dominant WT trait, and 25% of the population
will show the recessive Mutant trait shown in figure 2. This is only shown in autosomal recessive
traits. Thus, the trait is located on a non-sex chromosome.
D d
D DD Dd
d Dd dd
Figure 2: F2 generationof 27D cross with wildtype flies toexhibit dominant Wt trait
Chromosomes in homologous pairs are referred to as autosomes, and non-homologous
pairs are referred to as sex chromosomes. Thomas Hunt Morgan, also an important contributor to
7. 7
genetics, developed the chromosomal theory of inheritance. This theory supported the idea that
genes are located in specific sites on chromosomes (Jefferson 2009). Genes are commonly
passed on the autosomes. An autosome is a homologous pair that has the same size and gene.
This allows an offspring to receive two alleles from each trait, and one allele present from each
parent (Mendel 1965). Different number of chromosomes are present in different species. Fruit
flies are present with four chromosomes. Three chromosomes are represented by autosomal
chromosomes, and one is represented as sex-linked.
Mendelian genetics were used to find the phenotypic ratios between the heterozygous
offspring of two true breeding organisms. The modeled organism for this experiment is the
Drosophila melanogaster. Within this experiment, the unknown genotypes of two unknown
mutant types were observed by using the mendelian genetics. Mutant 27D and Mutant 27 E were
hypothesized to contain autosomal recessive traits. For the duration of this experiment, D.
melanogaster was sometimes referred to as its common name “fruit fly”.
Materials
The modeled organism used as the basis of this experiment is Drosophila melanogaster.
The wild type, and two unknown mutants were three populations given of the D. melanogaster.
Throughout the course of this experiment the following materials were used: plastic 5 inch tall 1
inch diameter vials, sponge toppers, “blow” gun attached to CO2 gas tank, shoe box, two pill
boxes, Kim-wipes, array of different colors of labeling tape, paint brushes, ethyl acetate, kill jar,
platform that releases CO2 gas, field notebook, Carolina Blue medium, deionized water, squirt
bottles, and dissecting microscope.
8. 8
Figure 9: This setup was useddaily to performthis experiment
Methods
Storage of Vials and Means of Setting up Experiment
Phenotypic variation within different generations were observed through kept-sake vials
that fruit flies were embodied in for the entirety of the experiment. Fruit flies were kept in
plastic, clear vials around 5 inches tall and 2 inches in diameter. The vials had an open top and
were enclosed by a foam stopper when flies embodied the container. Within each vial, culture
medium was added. Each vial was labeled, using labeling tape, by the number of the sub-culture
it was from in the parent generation, and the date it was made in the lower right-hand corner. For
example, the original parent generation vial was transferred into a new vial. The new vial was
labeled Wild Type subculture #1 made *insert date. The F1 Generation of crosses were labeled
with orange tape, as where, the F2 generation was labeled with yellow tape. Virgins collected
were labeled with baby blue tape. Each vial was organized by its respective population and
use. Each vial was grouped together by use of a rubber band. The mutant subcultures of 27 D
were compiled into one group. The wild type and 27 E mutants were also compiled this way. The
9. 9
vials were also organized by its time sequence that it was created. So, the F1 and F2 generation
of each population was separated and organized. All vials were stored in a shoe box that was
placed in a shelf inside the Biological Learning Center at Las Positas College. Fruit flies were
most active when exposed to light. In order to increase frequent mating, the shoe box was
intentionally stored in the top upper shelf where light was most available.
Preparing Culture Medium & Maintaining Vials
Medium was used as a vital source for culturing fruit flies. A maintained culture medium
is crucial for the success of culturing. Medium provided the proper nutrients necessary for fruit
flies to live off of. One scoop (approximately 4.5 grams) of dry culture, Caroline Blue Medium,
was added into each vial. Deionized water was followed right after. To properly measure the
amount of water necessary for a good medium water was added until the medium turned into a
dark blue color. A squirt bottle was used to add deionized water to the medium. The deionized
water and medium were mixed by swirling the medium until no dry spots of medium was visible
and the entire medium represented a dark color. The vial was then tapped down until most of the
medium was settled at the bottom. A Kim wipe was then used to clear out the remaining medium
that clung to the sides. Maintaining a good culture medium determined the number of flies
observed for the basis of your experiment. If culture – medium represented a light color after
water added, this represented the medium in the vial would last only a week until. By this time,
the culture medium would dry out along the sides, and flies could get stuck and die. This
problem had occurred many times throughout this experiment. Another problem that had
occurred, was too much water. If the medium was too moist, flies could drown, and larvae can
penetrate deep down into the medium. Also, the flies would drag the medium along the edges of
10. 10
the wall. Due to this, larvae could have a hard time traveling up towards the wall before starting
the pupation cycle. Avalanches could also occur when the medium was too moist, and not intact.
This caused an abundant amount of medium to shift to one side which buried the living
organisms inside. Another problem that occurred was improper care of the vials. Contaminated
cultures could contain mold spores or bacteria. White mold was most common within this
experiment. If flies were transferred in medium that were contaminated with white mold, the
mold can transfer to the subculture from that vial. To prevent this problem, flies were transferred
into a new subculture every two weeks or any signs of these problems were present.
Anesthetizing Flies
The fruit flies were constantly anesthetized throughout the course of this
experiment. Examining different characters produced within each generation was vital to the
mendelian genetic process. The use of anesthetization was used for the production of newly
formed subcultures from transferred fruit flies, recognizing significant characters within the
parent generation of each population, retrieving virgin female flies, and starting crosses within
the F1 generation. A “blow gun” was used as the dominant source of knocking out flies. The tip
of the gun had a needle-like tip that reached around 5 inches and less than 0.5 an inch in
diameter. The handle released the carbon dioxide through the tip of the blow-gun. In preparation
of transferring or examination, a Kim wipe was placed down onto a small platform that
contained holes that released carbon dioxide. The platform was attached to a pedal that would
control the release of CO2 gas. The Kim wipe was then held down by a plastic covering, that
attached to the platform and covered the edges of the Kim wipe. When flies were needed to be
anesthetized, the vial was tilted at around a 45-degree angle. This allowed the flies to easily be
located towards the top of the vial for a fast removal from the vial onto the platform. Once the
11. 11
vial was tiled, the tip of the blow gun was inserted between the sponge and walls of the vial.
NOTE, the stopper was not removed when anesthetizing the flies until the flies were notably
unconscious. The handle of the gun was lightly pressed for around 10 seconds or until no
movement was present, and flies were located towards the top of the vial. The longer the CO2
was released, the longer the flies remained unconscious. The handle was not pressed hard nor the
vial was anesthetized when the vial was standing straight up. This method was purposely
avoided because too much the pressure of the blow gun caused the flies to be blown to the
bottom of the vial; where the fruit flies would remain stuck in the medium. Once the flies were
notably unconscious, the top of the stopper was removed, and the flies were poured onto the Kim
wipe attached to the platform. If the noticeable movement occurred, or the flies seemed to be
waking up from consciousness, the pedal attached to the platform was pressed down to release
more CO2. Action took place immediately at a fast place of any notable signs of conscious
behavior since the fruit flies instinctively flew towards the light. Once transferring flies,
phenotyping, obtaining virgins, and crossing flies, were completed, the flies that were no longer
needed were placed into the “morgue”. Flies were first anesthetized and wrapped into a Kim
wipe. Two mL of ethyl acetate was added to a jar. The Kim wipe containing the unconscious
flies were then placed into the jar covered by a lid. The flies remained in the killing jar for
around 20-60 min until the flies were made sure they were completely dead.
Starting Parental Vials
The first day of starting the experiment consisted of three vials that were given to us from
the biology department of Las Positas College. One of the vials contained Wild Type versions of
Drosophila melanogaster, and the other two vials were labeled 27D, 27E. Each vial was labeled
12. 12
WT, 27D, or 27 E with a date. These notations meant these were two different unknown
mutations of the fruit fly and WT stood for wild type. The wild type versions of D. melanogaster
consisted of phenotypes that were present naturally. The flies were in each vial were transferred
into new vials where the very first subculture was created. This was the beginning of the parental
generation.
Examining Flies & Recognizing Characteristics
Each parental generation from each population was examined for its current phenotypes.
Flies were first anesthetized and then observed using a dissecting microscope located at the BLC.
Characteristics of wild type flies were first examined. Next the mutant and wild type flies were
compared to one another. This step is crucial when identifying the unknown mutant traits
received for this particular experiment. Identifying characteristics within the parental generation
given is the start of tracing the patterns of inheritance of the phenotypes apparent in each
population.
Figure 6: Female andMale WildType flies. Females were noticeably larger, andmales containedsex trichomes.
14. 14
Collecting Virgin Female Flies
The F1 generation was created with the use of female virgins. This step was crucial in
creating crosses. Once enough subcultures were made of each parent generation for each variant
of the fruit fly, the flies were examined and assorted. A dissecting microscope was used to
separate the female and male flies present in each population. Males typically were a lot smaller
and were more pigmented than female flies. Male flies had narrower more rounded abdomens,
whereas the female flies contained swollen, sharper tips. The females also displayed larger
abdomens. The most apparent characteristic of identifying a male is the sex combs. Only males
displayed sex combs. These were small dots located on the foreleg of a male only around the
knee. Virgin female flies remained present for only 8-12 hours from emergence. Flies were
transferred, labeled, and made into a new subculture. The only remaining live organisms
consisted of pupa along the walls of the vials, and larvae. Within those 8-12 hours males and
females must be separated to maintain the female a virgin. Females must remain virgins because
they can store genetic material from a male fly that they already have mated with. This can cause
cross contamination if these non -virgin flies were used to start your crosses.
Starting Crosses
Two true breeding parents, in this case, the virgin female flies from one of the three
populations were crossed with the male flies produced in another population, to create
heterozygous offspring. Four different crosses were made total within this experiment see figure
3. The two mutant types were crossed with the wild type population. The purpose of these
crosses was to determine the pattern of inheritance within the F1 and F2 generation.
Cross 1 WT (male) + 27 D (virgin female)
15. 15
Cross 2 WT (virgin female) + 27 D (male)
Cross 3 WT (male) + 27 E (virgin female)
Cross 4 WT (male) + WT (virgin female)
Figure 3: Different crosses of Wild Type x Mutant
Starting the F1 Generation
F1 generation consisted of the offspring that was produced by cross displayed in figure 1.
Around 6-10 flies were collected of the male flies of one population, and 6-10 virgin females of
the other population were added into a vial together. After 7-9 days or once larvae and pupae
were present, these flies were removed. The offspring of the cross, mated amongst one another
and continued to bread offspring of their own. The progeny of each cross was counted. The
phenotype of the F1 generation was then determined based on the offspring.
Starting the F2 Generation
Virgin females were unnecessary in the F2 generation. 6-10 males and 6-10 females of
the first cross were placed into a vial labeled by its original cross (F2 generation and date
created). After 7-9 days, or when larvae or pupa is shown, the parents were removed and placed
into another vial to begin another sub-culture. Once the progeny of the F2 generation emerged,
each of the offspring were counted for its sex and phenotype.
Determining the phenotype of the F1 and F2 Generation
The phenotypes were determined within each generation. The parental generation of each
population was first recorded as the basis of the experiment. The wild type phenotype was
recorded. The wild displayed red eyes, normal wings, brown abdomen, and grey/black thorax.
16. 16
The 27 D mutant displayed brown (sepia) eyes, normal wings, black thorax, and brown
abdomen. The 27 E mutants displayed red eyes, vestigial wings, black thorax, and brown
abdomen.
To determine the pattern of inheritance of each generation, the phenotype was determined.
Phenotyping occurred when the fruit flies were dead. A Kim wipe was first set up. The dead fruit
flies were assorted into four groups displayed on the Kim wipe. For example, phenotyping of the
first cross consisted four boxes; where each box was labeled as: WT M (wild-type wings
displayed in males), WT F (wild-type wings displayed in females), vestigial males (vestigial
wings shown in male flies, or vestigial females (vestigial wings shown in female flies) shown in
figure 4.
WT M WT F
Phenotype of Mutant Displayed in Male Phenotype of Mutant Displayed in Female
Figure 4 displayed the standard set-up of Kim wipe used for phenotyping
Flies were then anesthetized and placed on the labeled Kim wipe. 2 mL of ethyl acetate
was added into a killing jar and the flies within the labeled phenotype was quickly inserted into
the jar and covered by the killing jar cover. The time was recorded once the flies entered the
killing jar. The flies remained in the killing for at least 30 minutes to an hour long. The labeled
Kim-wipe consisting of the flies were then pulled from the kill jar and was placed under a
dissecting microscope. A small paint-brush was used to sort the flies to particular spots labeled
on Kim-wipe based on gender and specific phenotype displayed. Once all of the flies were
assorted, the flies were transferred to appropriate containers in the pill box. If the flies were
pulled to early from the killing jar, the flies could possibly wake up later, and remain alive within
17. 17
the pill box. This occurred a few times in this experiment. The blow gun was then used and
pressed slightly to release CO2 into the cracks of the containers of the pill box to anesthetize the
flies. The flies were then transformed to the “morgue” again for the second time around for a
longer duration. The flies were then placed back into designated area in pill box.
Statistical Data
The phenotypic percentage present in each cross within the F2 generation was found by
the total number of flies that displayed the mutant traits after phenotyping, divided by the total
sum of flies within the population.
(sum of population showing recessive trait/total population) x 100% = %
Equation 1. Equationusedto thefindthe percentage offlies representingmutant phenotypes
𝛘2 =∑(observed-expected) ²/(expected)
Equation 2. Formula usedto forchi-squaretest
A chi-squared test was then performed to determine whether the percentage found was
due to random chance. The null hypothesis concludes that any deviation from the expected
Mendelian ratio was due to chance alone. In order for the null hypothesis to be rejected and for
the 𝛘2 value to pass the chi-square test, the 𝛘2 value must be lower than 3.841.
Results
F1 Cross 1 27E (female) x WT (male)
Wild Type Wings Vestigial Wings
18. 18
Observed (o) 200 0
Expected (e) 200 0
Deviation (o-e) 0 0
Deviation2 (d2) 0 0
d2/e 0 0
𝛘2
0
Table 1. F1 generation cross between 27E mutant female and wild type male
This F1 cross had a total of 200 flies. All of the flies expressed the wild type wings
phenotype. The 𝛘2 value was 0 which passes the 𝛘2 test (0<3.84). Based on these values, we can
reject the null hypothesis.
F1 Cross 2 27E (male) x WT (female)
Wild Type Wings Vestigial Wings
Observed (o) 225 0
Expected (e) 225 0
Deviation (o-e) 0 0
Deviation2 (d2) 0 0
19. 19
d2/e 0 0
𝛘2
0
Table 2. F1 generation cross between 27E mutant male and wild type female.
This F1 cross had a total of 225 flies. All of the flies expressed the wild type wings
phenotype. The 𝛘2 value was 0 which passes the 𝛘2 test (0<3.84). Based on these values, we can
reject the null hypothesis.
F1 Cross 3 27D (male) x WT (female)
Wild Type (red eyes) Sepia Eyes
Observed (o) 223 0
Expected (e) 223 0
Deviation (o-e) 0 0
Deviation2 (d2) 0 0
d2/e 0 0
𝛘2 0
Table 3. F1 generation cross between 27D mutant male and wild type female.
This F1 cross had a total of 223 flies. All of the flies expressed the wild type eye color
phenotype. The 𝛘2 value was 0 which passes the 𝛘2 test (0<3.84). Based on these values, we can
reject the null hypothesis.
20. 20
F1 Cross 4 27D (female) x WT (male)
Wild Type (red eyes) Sepia Eyes
Observed (o) 208 0
Expected (e) 208 0
Deviation (o-e) 0 0
Deviation2 (d2) 0 0
d2/e 0 0
𝛘2
0
Table 4. F1 generation cross between 27D mutant female and wild type male.
This F1 cross had a total of 208 flies. All of the flies expressed the wild type eye color
phenotype. The 𝛘2 value was 0 which passes the 𝛘2 test (0<3.84). Based on these values, we can
reject the null hypothesis.
F2 Cross 1 27E (female) x WT (male)
Wild Type Wings Vestigial Wings
Observed (o) 166 53
Expected (e) 150 50
Deviation (o-e) 16 3
21. 21
Deviation2 (d2) 256 9
d2/e 1.7 0.18
𝛘2
1.88
Table 5. F2 generation cross between 27E mutant female and wild type male.
This F2 cross had a total of 219 flies. 166 of the flies expressed the wild type wings
phenotype while 53 of the flies expressed the vestigial wings phenotype. The 𝛘2 value for this
cross was 1.88 which passes the 𝛘2 test (1.88<3.84). Based on these values, we can reject the null
hypothesis.
F2 Cross 2 27E (male) x WT (female)
Wild Type Wings Vestigial Wings
Observed (o) 162 57
Expected (e) 150 50
Deviation (o-e) 12 7
Deviation2 (d2) 144 49
d2/e 0.96 0.98
𝛘2 1.94
Table 6. F2 generation cross between 27E mutant male and wild type female.
22. 22
This F2 cross had a total of 219 flies. 162 of the flies expressed the wild type wings
phenotype while 57 of the flies expressed the vestigial wings phenotype. The 𝛘2 value for this
cross was 1.94 which passes the 𝛘2 test (1.94<3.84). Based on these values, we can reject the null
hypothesis.
F2 Cross 3 27D (male) x WT (female)
Wild Type (red eyes) Sepia Eyes
Observed (o) 144 56
Expected (e) 150 50
Deviation (o-e) 6 6
Deviation2 (d2) 36 36
d2/e 0.24 0.72
𝛘2
0.96
Table 7. F2 generation cross between 27D mutant male and wild type female.
This F2 cross had a total of 200 flies. 144 of the flies expressed the wild type eye color
phenotype while 56 of the flies expressed the mutant eye color phenotype. The 𝛘2 value for this
cross was 0.96 which passes the 𝛘2 test (0.96<3.84). Based on these values, we can reject the null
hypothesis.
23. 23
F2 Cross 4 27D (female) x WT (male)
Wild Type (red eyes) Sepia Eyes
Observed (o) 157 55
Expected (e) 150 50
Deviation (o-e) 7 5
Deviation2 (d2) 49 25
d2/e 0.324 0.5
𝛘2
0.824
Table 8. F2 generation cross between 27D mutant female and wild type male.
This F2 cross had a total of 212 flies. 157 of the flies expressed the wild type eye color
phenotype while 55 of the flies expressed the mutant eye color phenotype. The 𝛘2 value for this
cross was 0.824 which passes the 𝛘2 test (0.824<3.84). Based on these values, we can reject the
null hypothesis.
24. 24
Figure 1. Pedigree chart representing the F1 and F2 generations of cross 1 between a wild type
male and 27E mutant female.
Figure 2. Pedigree chart representing the F1 and F2 generations of cross 2 between a wild type
female and 27E mutant male.
Figure 3. Pedigree chart representing the F1 and F2 generations of cross 3 between a 27D mutant
male and a wild type female.
25. 25
Figure 4. Pedigree chart representing the F1 and F2 generations of cross 4 between a wild type
male and a 27D mutant female.
Figure 5. Pie chart depicted percentages of each phenotype passed down from F1 to F2 in cross
1.
26. 26
Figure 6. Pie chart depicted percentages of each phenotype passed down from F1 to F2 in cross
2.
Figure 7. Pie chart depicted percentages of each phenotype passed down from F1 to F2 in cross
3.
27. 27
Figure 8. Pie chart depicted percentages of each phenotype passed down from F1 to F2 in cross
4.
Discussion
The cross between two true breeding parents created a heterozygous offspring. The
phenotypic ratios were observed in the F1 and F2 generations by the use of Mendelian genetics.
Mutant 1, 27 D, displayed a vestigial wing mutation. Mutant 2, 27 E, displayed a brown eyed
mutation. Both of these genes were proven to be recessive, autosomal genes.
The F1 generation of all the crosses can be proven to be autosomal if the flies all
expressed the wild type phenotype. Within the first generation, mutation should not occur. 100%
of the population should display all wild type wings. This is because, if one was to cross the wild
type parent that represents the homozygous dominant genotype, with the mutant that represents
the homozygous recessive genotype, the heterozygous offspring will be produced displaying the
dominant phenotype. The genotypic ratio in the F2 will display 1:2:1 ratio. Thus, 25% of the
genotype will be homozygous dominant (DD), 50 % will be heterozygous dominant (Dd), and
28. 28
25% homozygous recessive (dd). The phenotypic ratio should follow the expected Mendelian
ratio of 3:1 in the F2 generation. Based off of Mendelian genetics, the F2 generation will display
75% of the dominant trait, wild type trait, and 25% of the population will display the recessive
trait, the mutation displayed in the mutant. Chi-square calculations were used to determine how
far the phenotypic ratio observed within each generation deviated from the expected values. If
the chi-squared value was less than 3.84 than the null hypothesis can be rejected. Meaning, that
random chance did not occur, and the cross followed the expected Mendelian ratio. The F1
generation of all the crosses can be proven to be autosomal if the flies all expressed the wild type
phenotype and the phenotypic ratio of in the F2 followed the expected Mendelian ratio of 3:1.
F1 Generation
Within the first generation, 200 flies of each cross were expected to display wild type
traits. Although, more than 200 flies were observed and recorded, all of the crosses had a chi-
squared value of 0. Thus, the null hypothesis could be rejected, and all of the crosses followed
the expected phenotypic ratio of 1; displaying wild type trait.
F2 Generation
If one was to perform a second generation, then the expected ratio of the phenotypes
would be 3:1 Thus, 150 flies would display wild type traits, and 50 flies would display mutant
traits within a population.
Mutant 27 D crossed with Wild Type
Within cross 1, 219 flies were observed and counted in total. 166 flies displayed wild
type traits, and 53 flies displayed the mutant traits. The percentage of the subpopulation was
calculated at 24.2% of the flies displaying the mutant phenotype. The chi-squared value was
29. 29
calculated at 1.88<3.841, thus, rejecting the null hypothesis. Within cross 2, 219 flies were
observed and counted in total. 162 flies displayed wild type traits, and 57 flies displayed the
mutant traits. The percentage of the subpopulation was calculated at 24.2% of the flies displaying
the mutant phenotype. The chi-squared value was calculated at 1.94<3.841, thus, rejecting the
null hypothesis.
Mutant 27 E crossed with Wild Type
Within cross 3, 200 flies were observed and counted in total. 144 flies displayed wild
type traits, and 53 flies displayed the mutant traits. The chi-squared value was calculated at
0.96<3.841, thus, rejecting the null hypothesis. Within cross 4, 212 flies were observed and
counted in total. 157 flies displayed wild type traits, and 53 flies displayed the mutant traits. The
percentage of the subpopulation was calculated at 25.9% of the flies displaying the mutant
phenotype. The chi-squared value was calculated at 0.824<3.841, thus, rejecting the null
hypothesis.
Although all four crosses had chi-squared values that passed, the calculated percentage of
the subpopulation for crosses 3 and 4 had slightly higher values than the expectancy. This is
possibly due to random chance or miss-counting of the fruit flies that were actually produced.
If this experiment was to be repeated, consider less vials being used/less subcultures
created. Too many subcultures were in placed in creation of the F1 generation onto the F2
generation. This caused the time frame to pull out the parents to produce the proper F2 offspring,
extremely difficult. Some of the parents were not pulled out in time to create the F2 generation
because the time-frame of each subculture was difficult to manage. Another problem that
occurred throughout this experiment was transfer of white mold. If white mold was present, even
slightly in one vial, mold can be moved to another vial when flies were transferred from the vial
30. 30
originally present with mold. To avoid these regulatory problems, one should consider the use of
only two to three subcultures of each cross. Furthermore, fruit flies should be transferred at least
every two weeks, and the presence of the white mold should be removed immediately.
In conclusion, the hypothesis was supported through the course of this experiment. The
two mutant types were proven to be autosomal genes. The F1 generation proved that the
offspring is a heterozygous of two true breeding parents, and that the phenotypic ratios followed
the expected Mendelian ratios of 3:1; the dominant phenotype, displayed by wild-type, occurred
more than the recessive phenotype, displayed by the mutant. The mutation is not sex-linked and
in fact an autosomal recessive gene. Thus, genes were commonly passed on in the autosomes, a
chromosome that is not a sex chromosome.
Appendix
Chi Squared Calculations
Formula Used: 𝛘2 =∑(observed-expected) ^2/expected
F2 Generation
Cross 1: 27 D Female x WT male
WT Phenotype
𝛘2= (166-150) ^2/150=1.88
31. 31
Cross 2: 27 D Female x WT male
WT Phenotype
𝛘2= (162-150) ^2/150=1.94
Cross 3: 27 E Male x WT Male
WT Phenotype
𝛘2= (144-150) ^2/150=0.96
Cross 4: 27 E Female x WT male
WT Phenotype:
𝛘2= (157-150) ^2/150=0.824
F2 Trait Count
Observed Percent
Cross 1
Red eye male 100 45.66%
Red eye female 119 54.34%
Sepia eye male 0 0%
Sepia eye female 0 0%
32. 32
Long wing male 77 34.22%
Long wing female 89 39.56%
Vestigial wing male 30 13.33%
Vestigial wing female 29 12.89%
Cross 2
Red eye male 97 44.29%
Red eye female 122 55.71%
Sepia eye male 0 0%
Sepia eye female 0 0%
Long wing male 74 34.26%
Long wing female 88 40.07%
Vestigial wing male 23 10.65%
Vestigial wing female 31 14.35%
Cross 3
Sepia eye male 69 34.50%
Sepia eye female 75 37.50%
33. 33
Red eye male 26 13.00%
Red eye female 30 15.00%
Cross 4
Sepia eye male 26 12.26%
Sepia eye female 29 13.68%
Red eye male 74 34.49%
Red eye female 83 39.15%
Work - Cited
Mendel G. Experiments in plant hybridization. Cambridge: Harvard University Press, 1965.
Mendel G, Corcos AF, Monaghan, FV. Gregor Mendel's Experiments on Plant Hybrids.
Guided Study. New Brunswick, N.J.: Rutgers University Press. 1993.
34. 34
Jefferson SE, Weingarten CN. Sex Chromosomes: Genetics, Abnormalities and Disorders. New
York: Nova Science Publishers, Inc. 2009.
Urry, Cain, Wasserman, Minorsky, Reece. 2013. Biology, Campbell. (11): 275-286.
Shine, I. and Wrobel, S. Thomas Hunt Morgan: Pioneer of Genetics. Lexington: The University
Press of Kentucky. 2009.