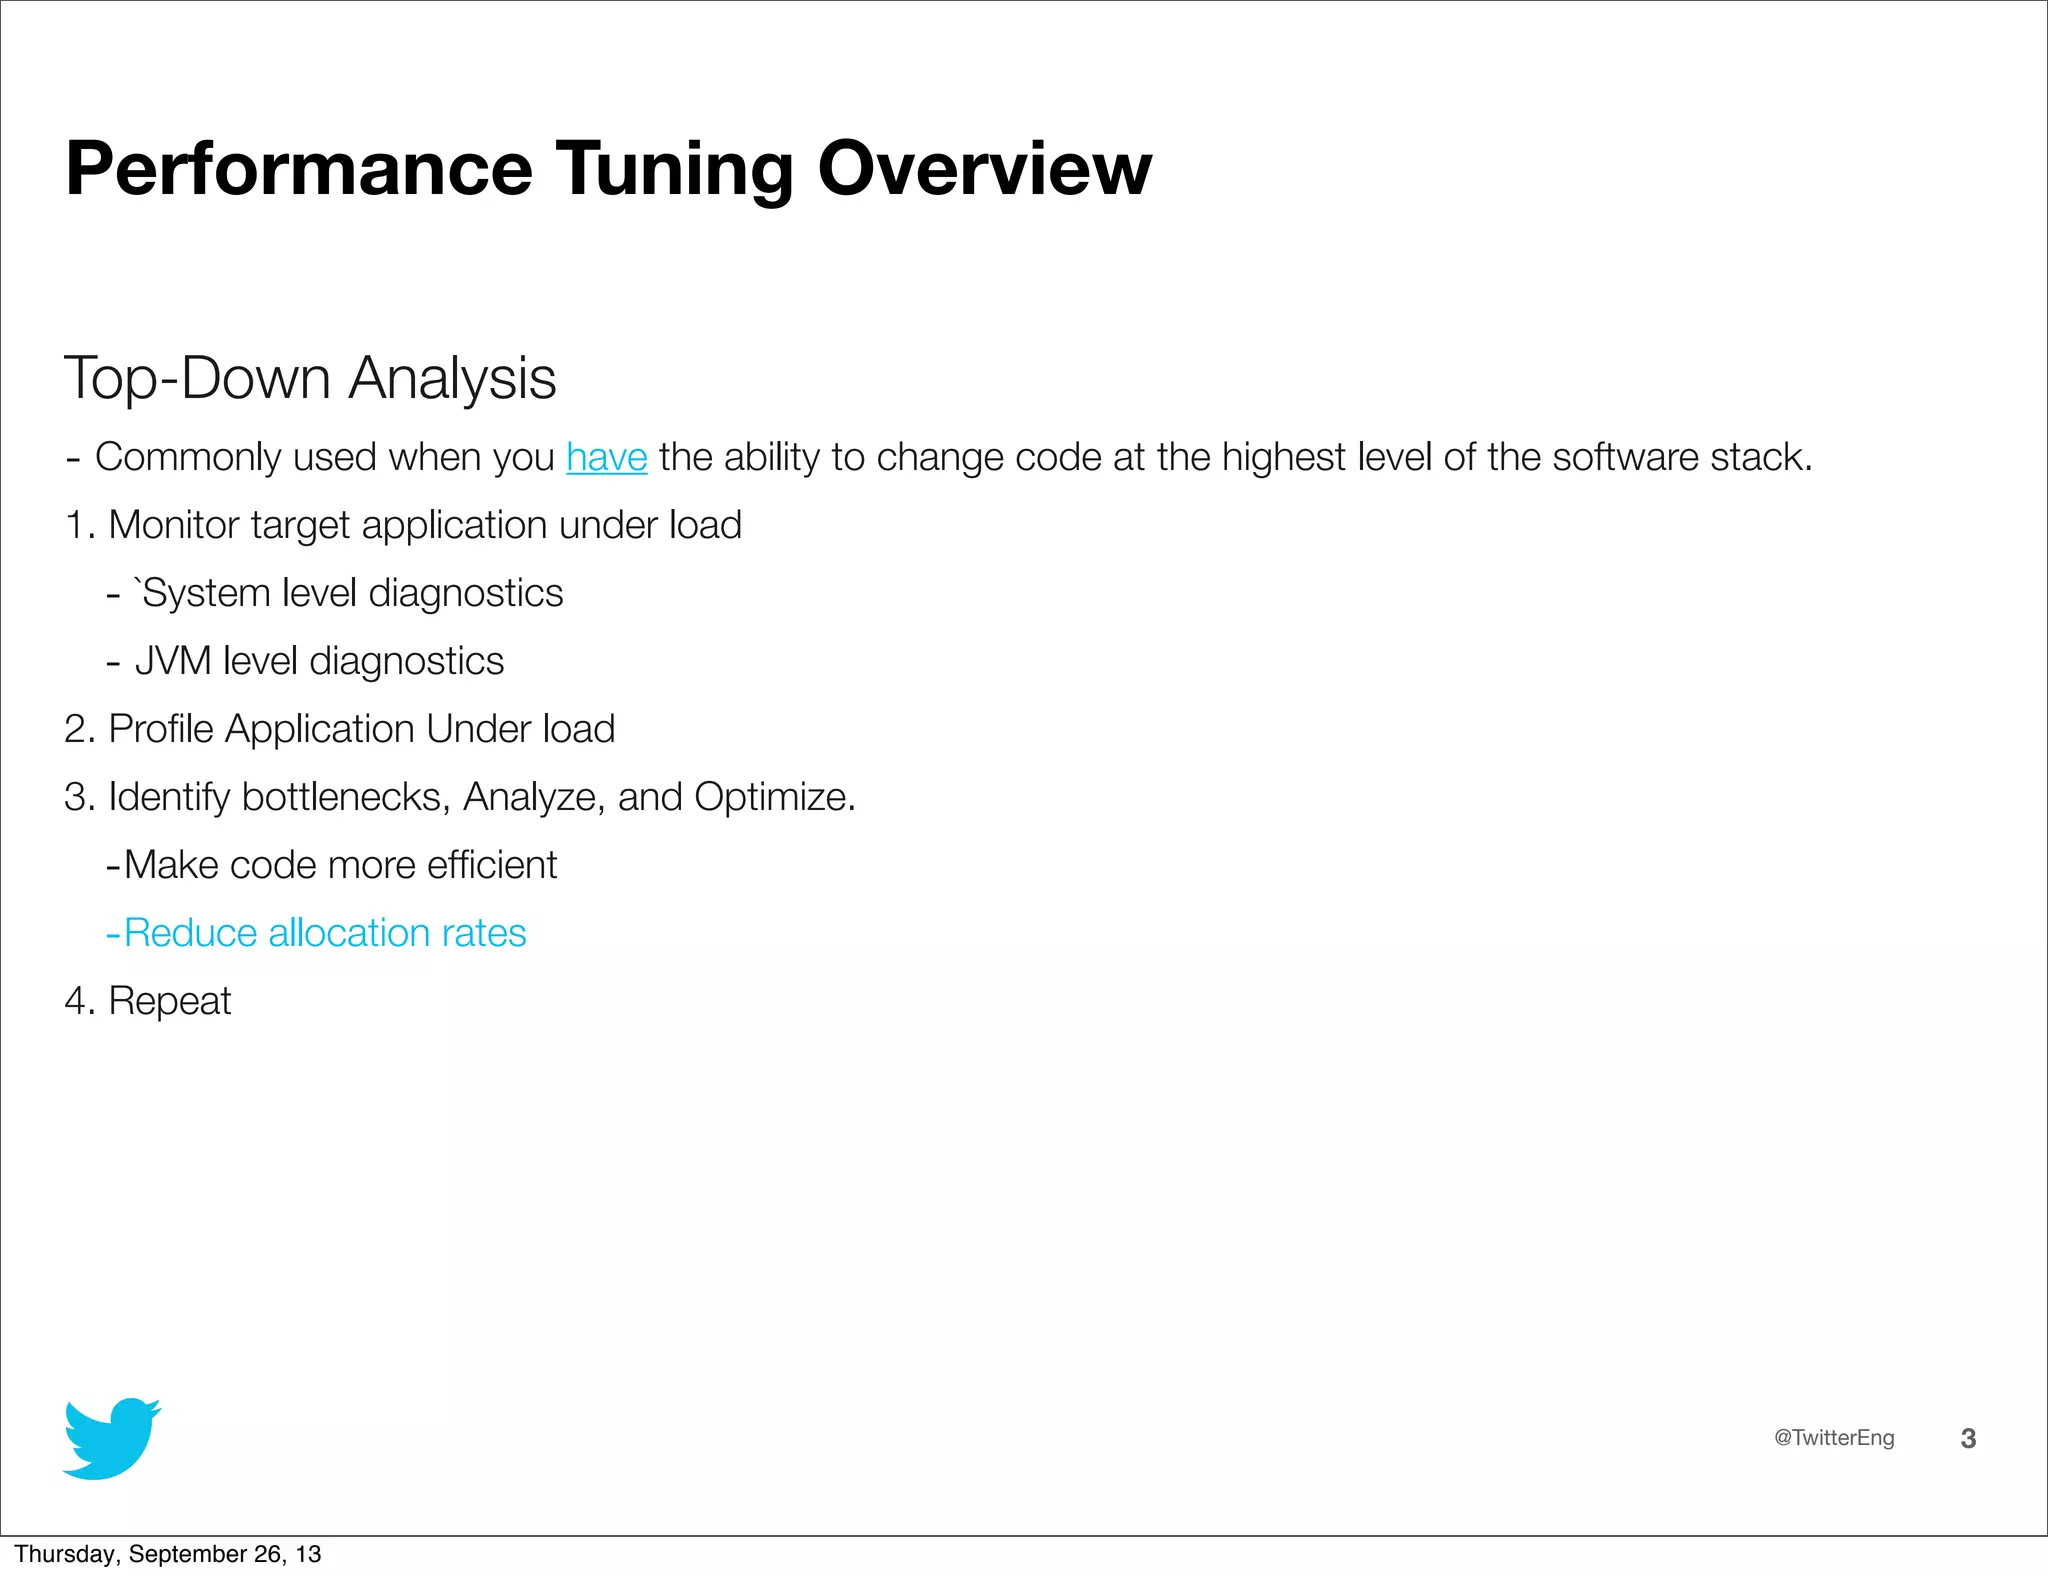
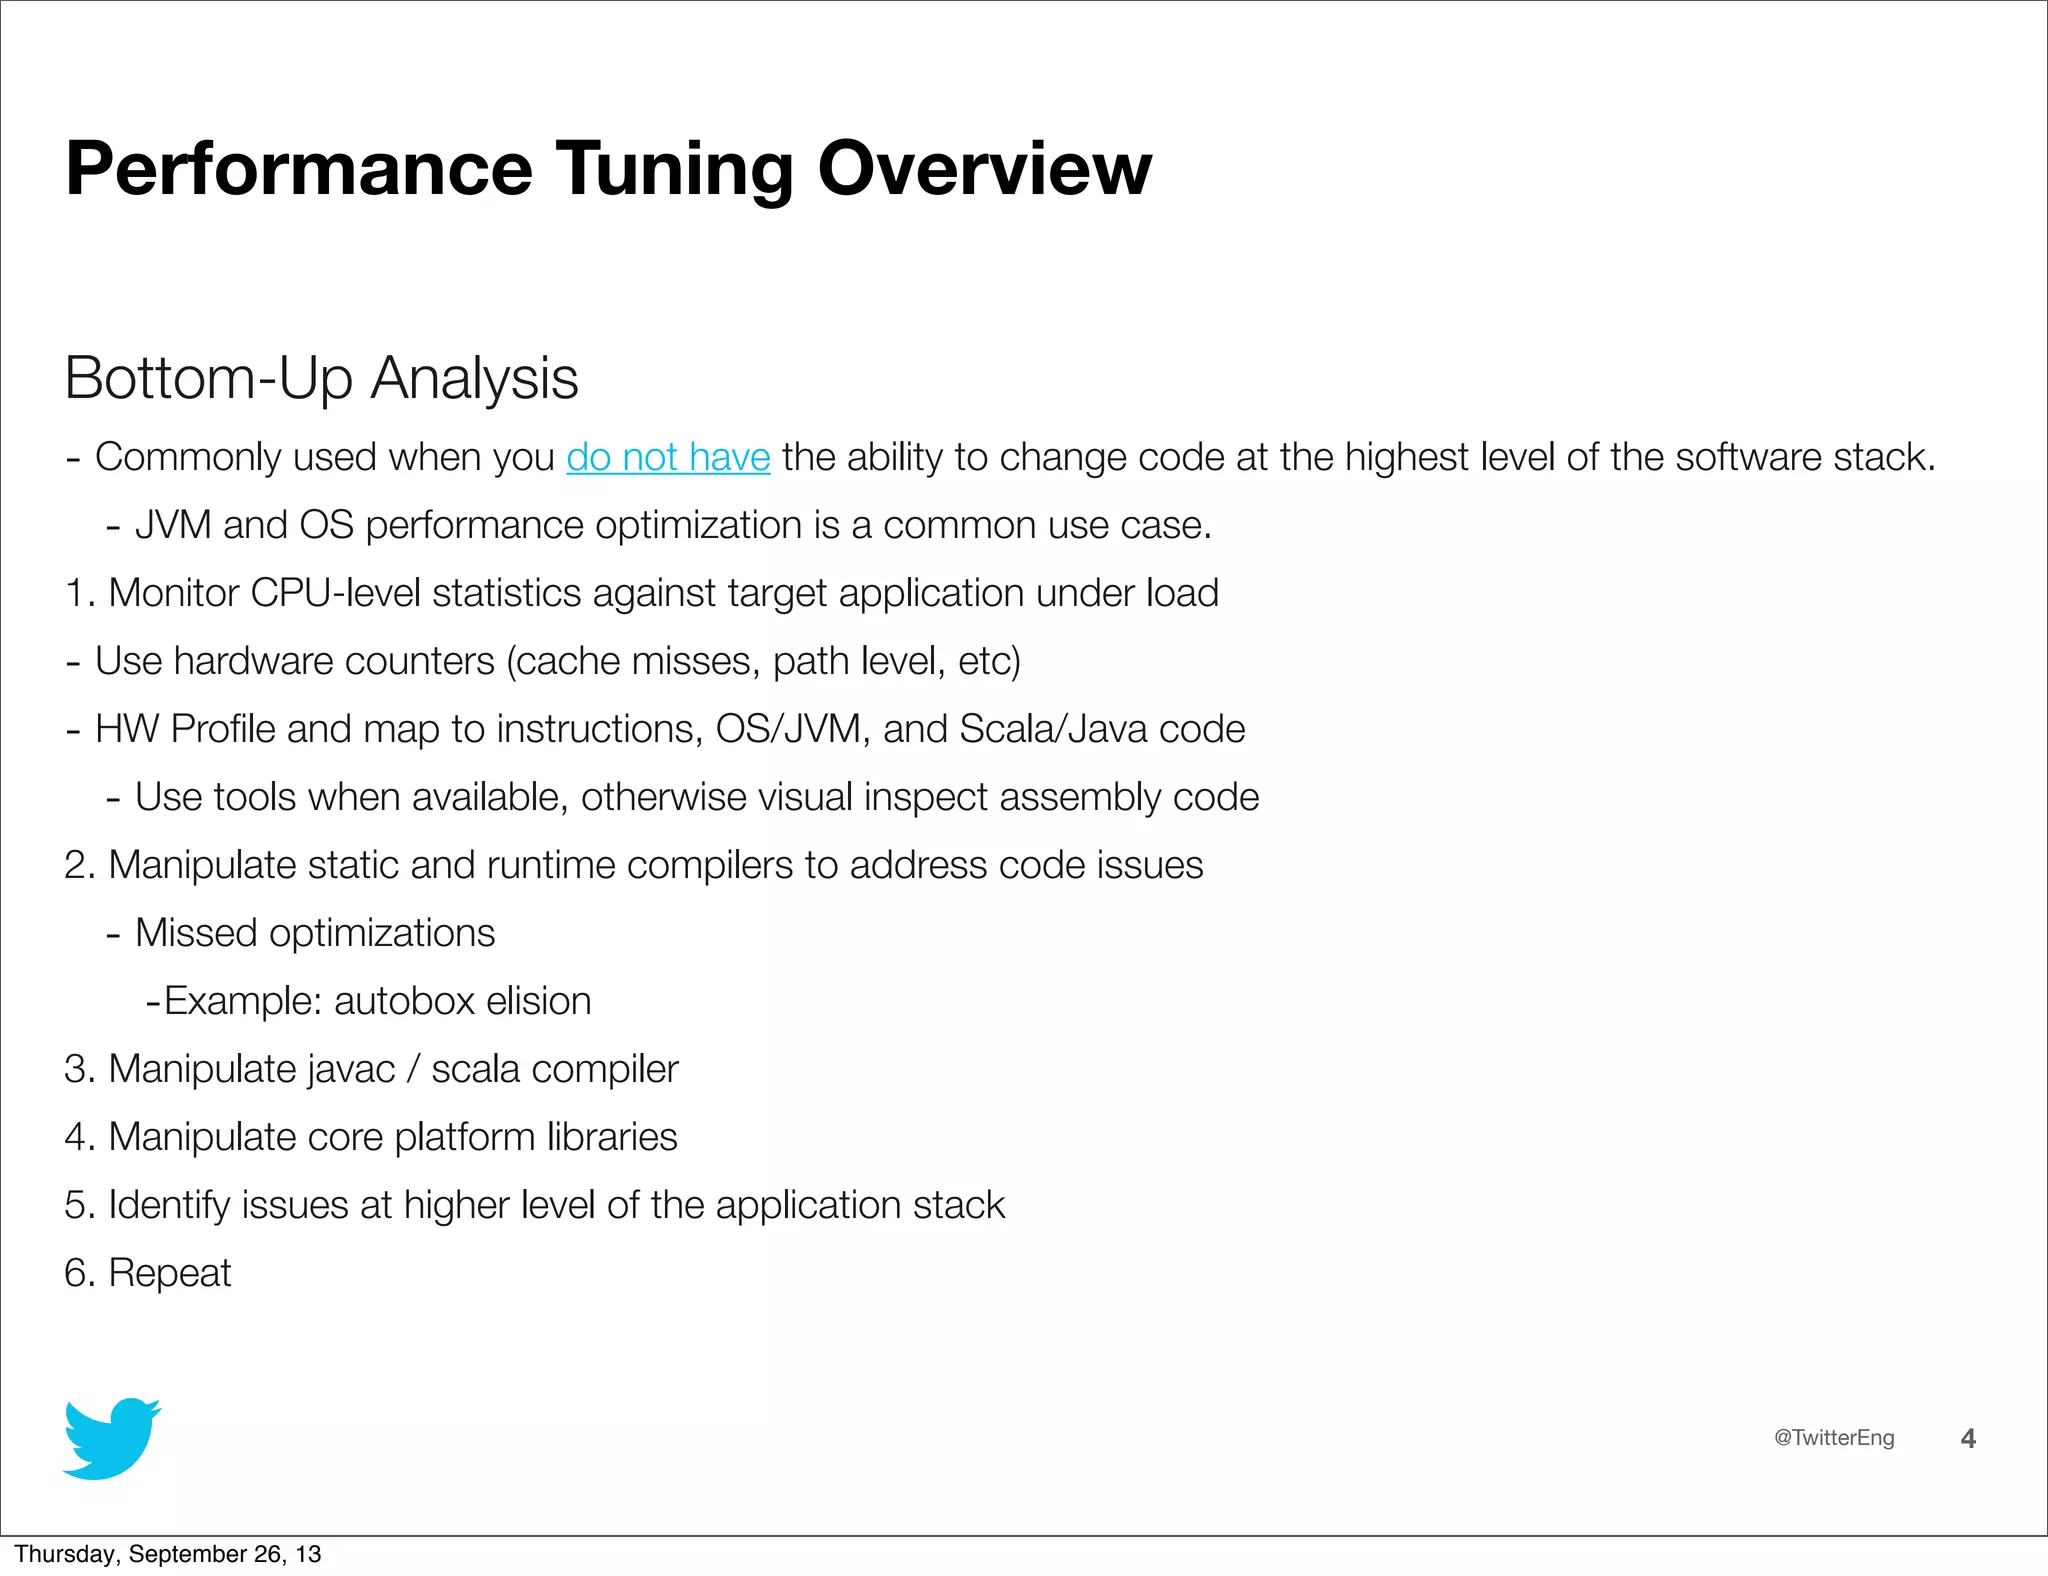
This document provides an overview of performance tuning for Java applications. It discusses top-down and bottom-up performance analysis approaches. It also covers choosing the right garbage collector and JVM tuning basics like calculating allocation rates and live data size from GC logs. The document shows examples of tuning JVM settings for latency using CMS and G1 collectors as well as tuning for throughput using ParallelOldGC.


![@TwitterEng 16
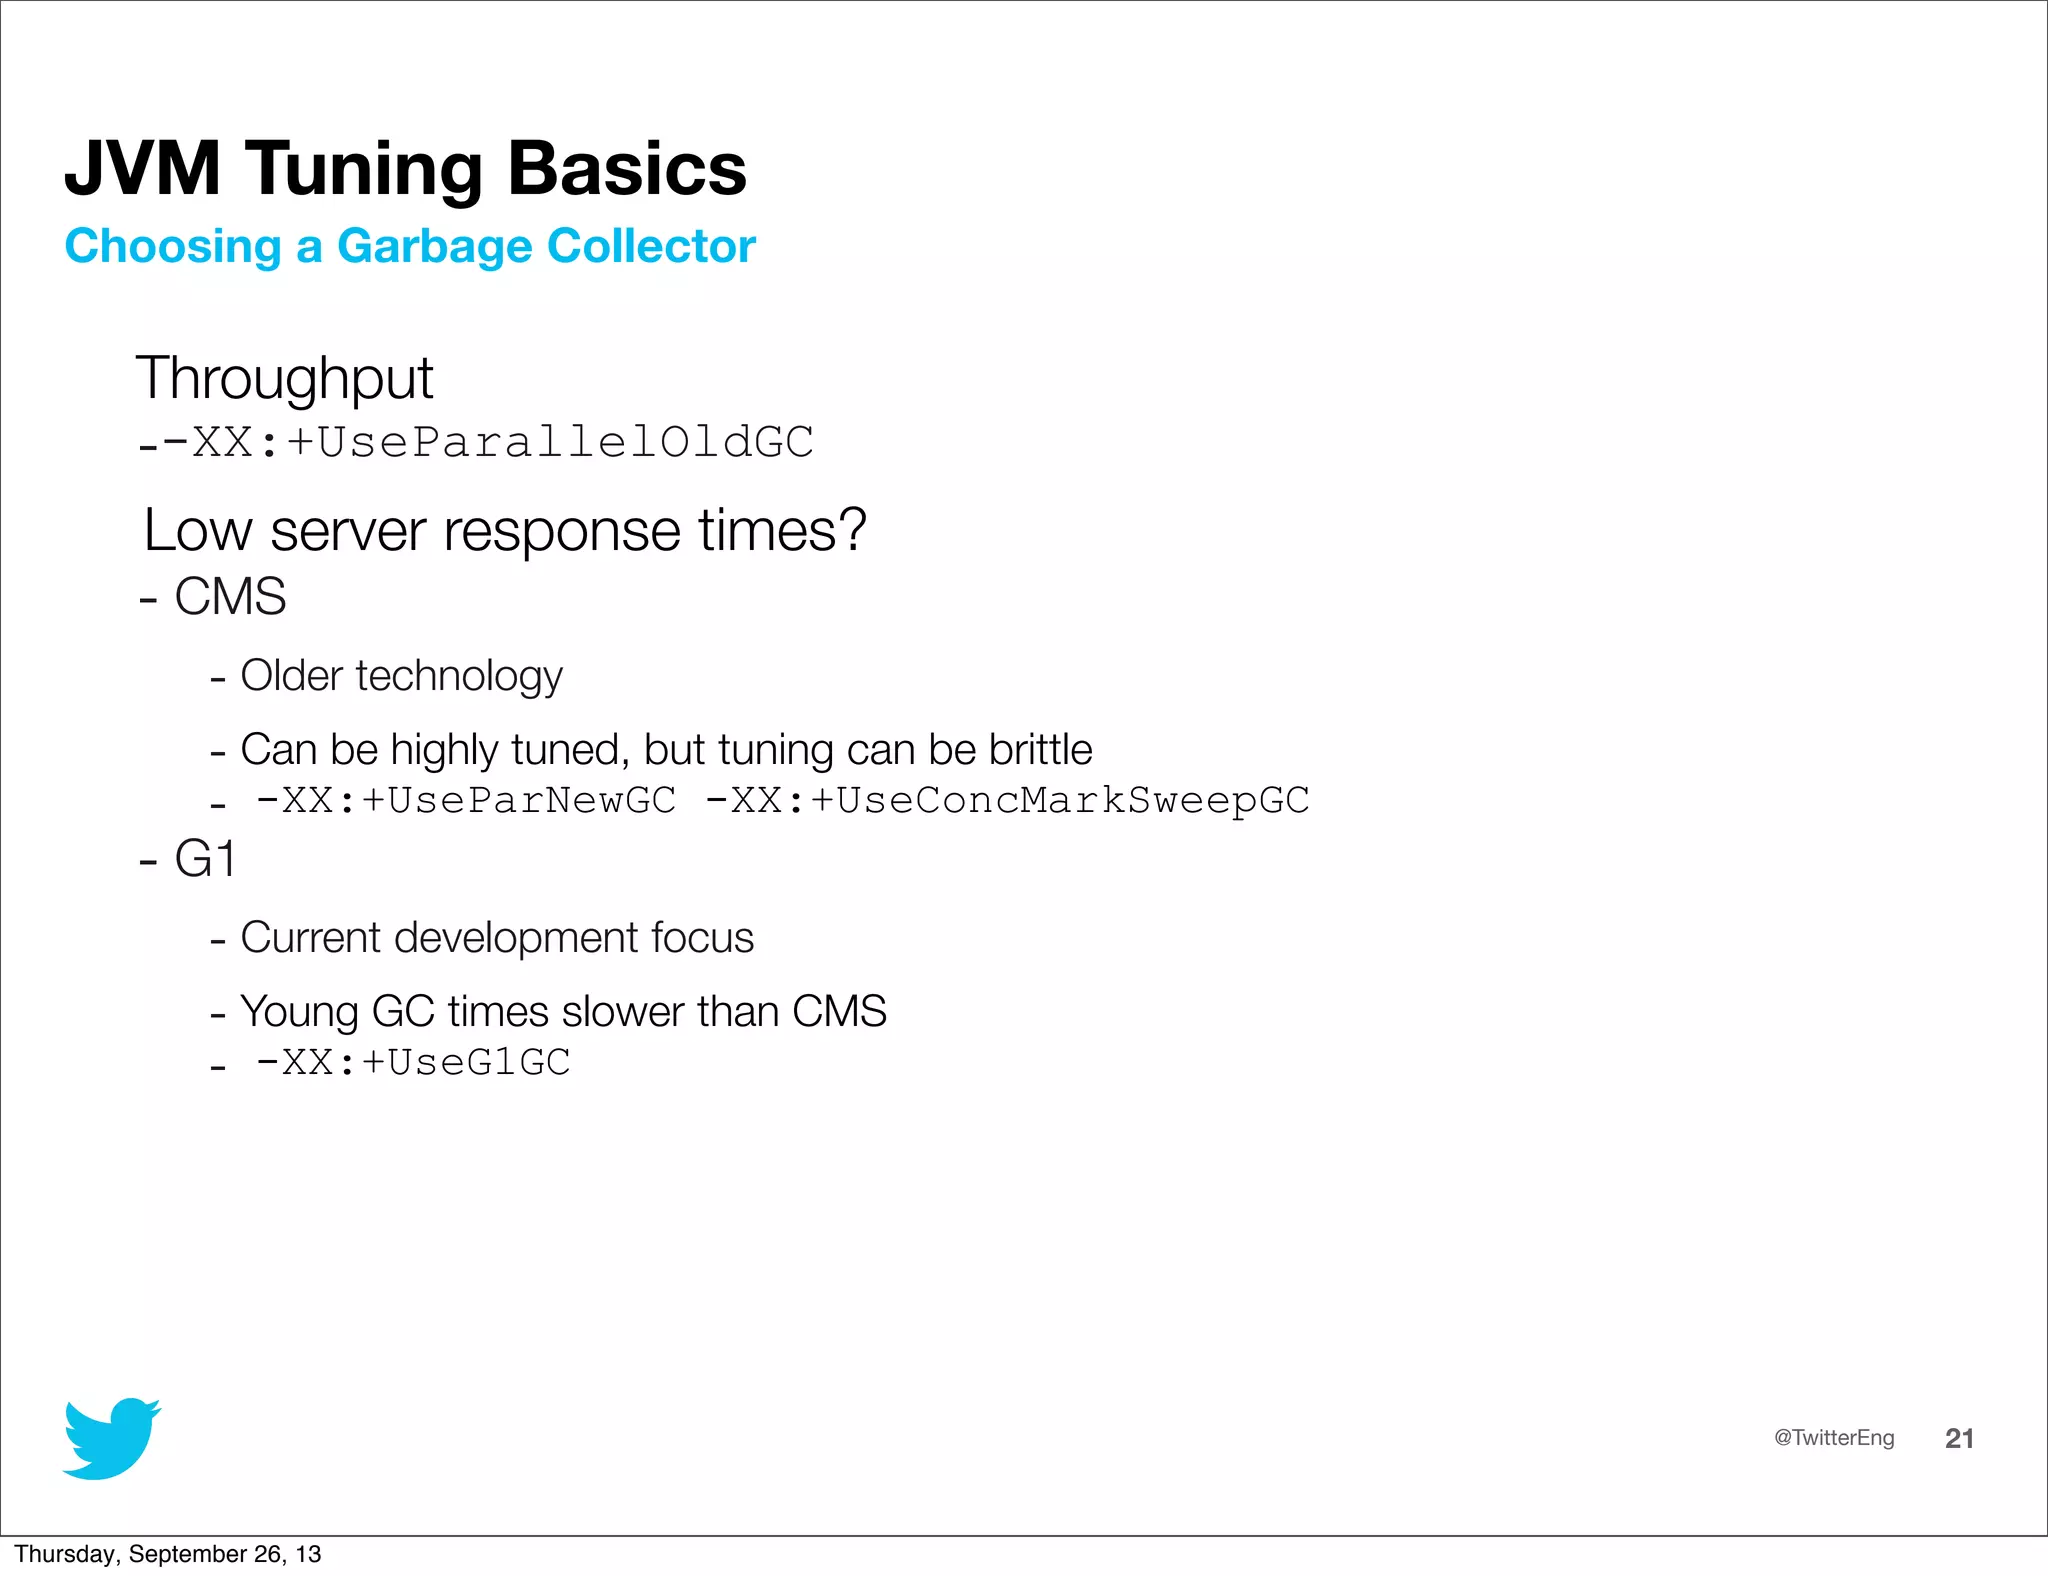
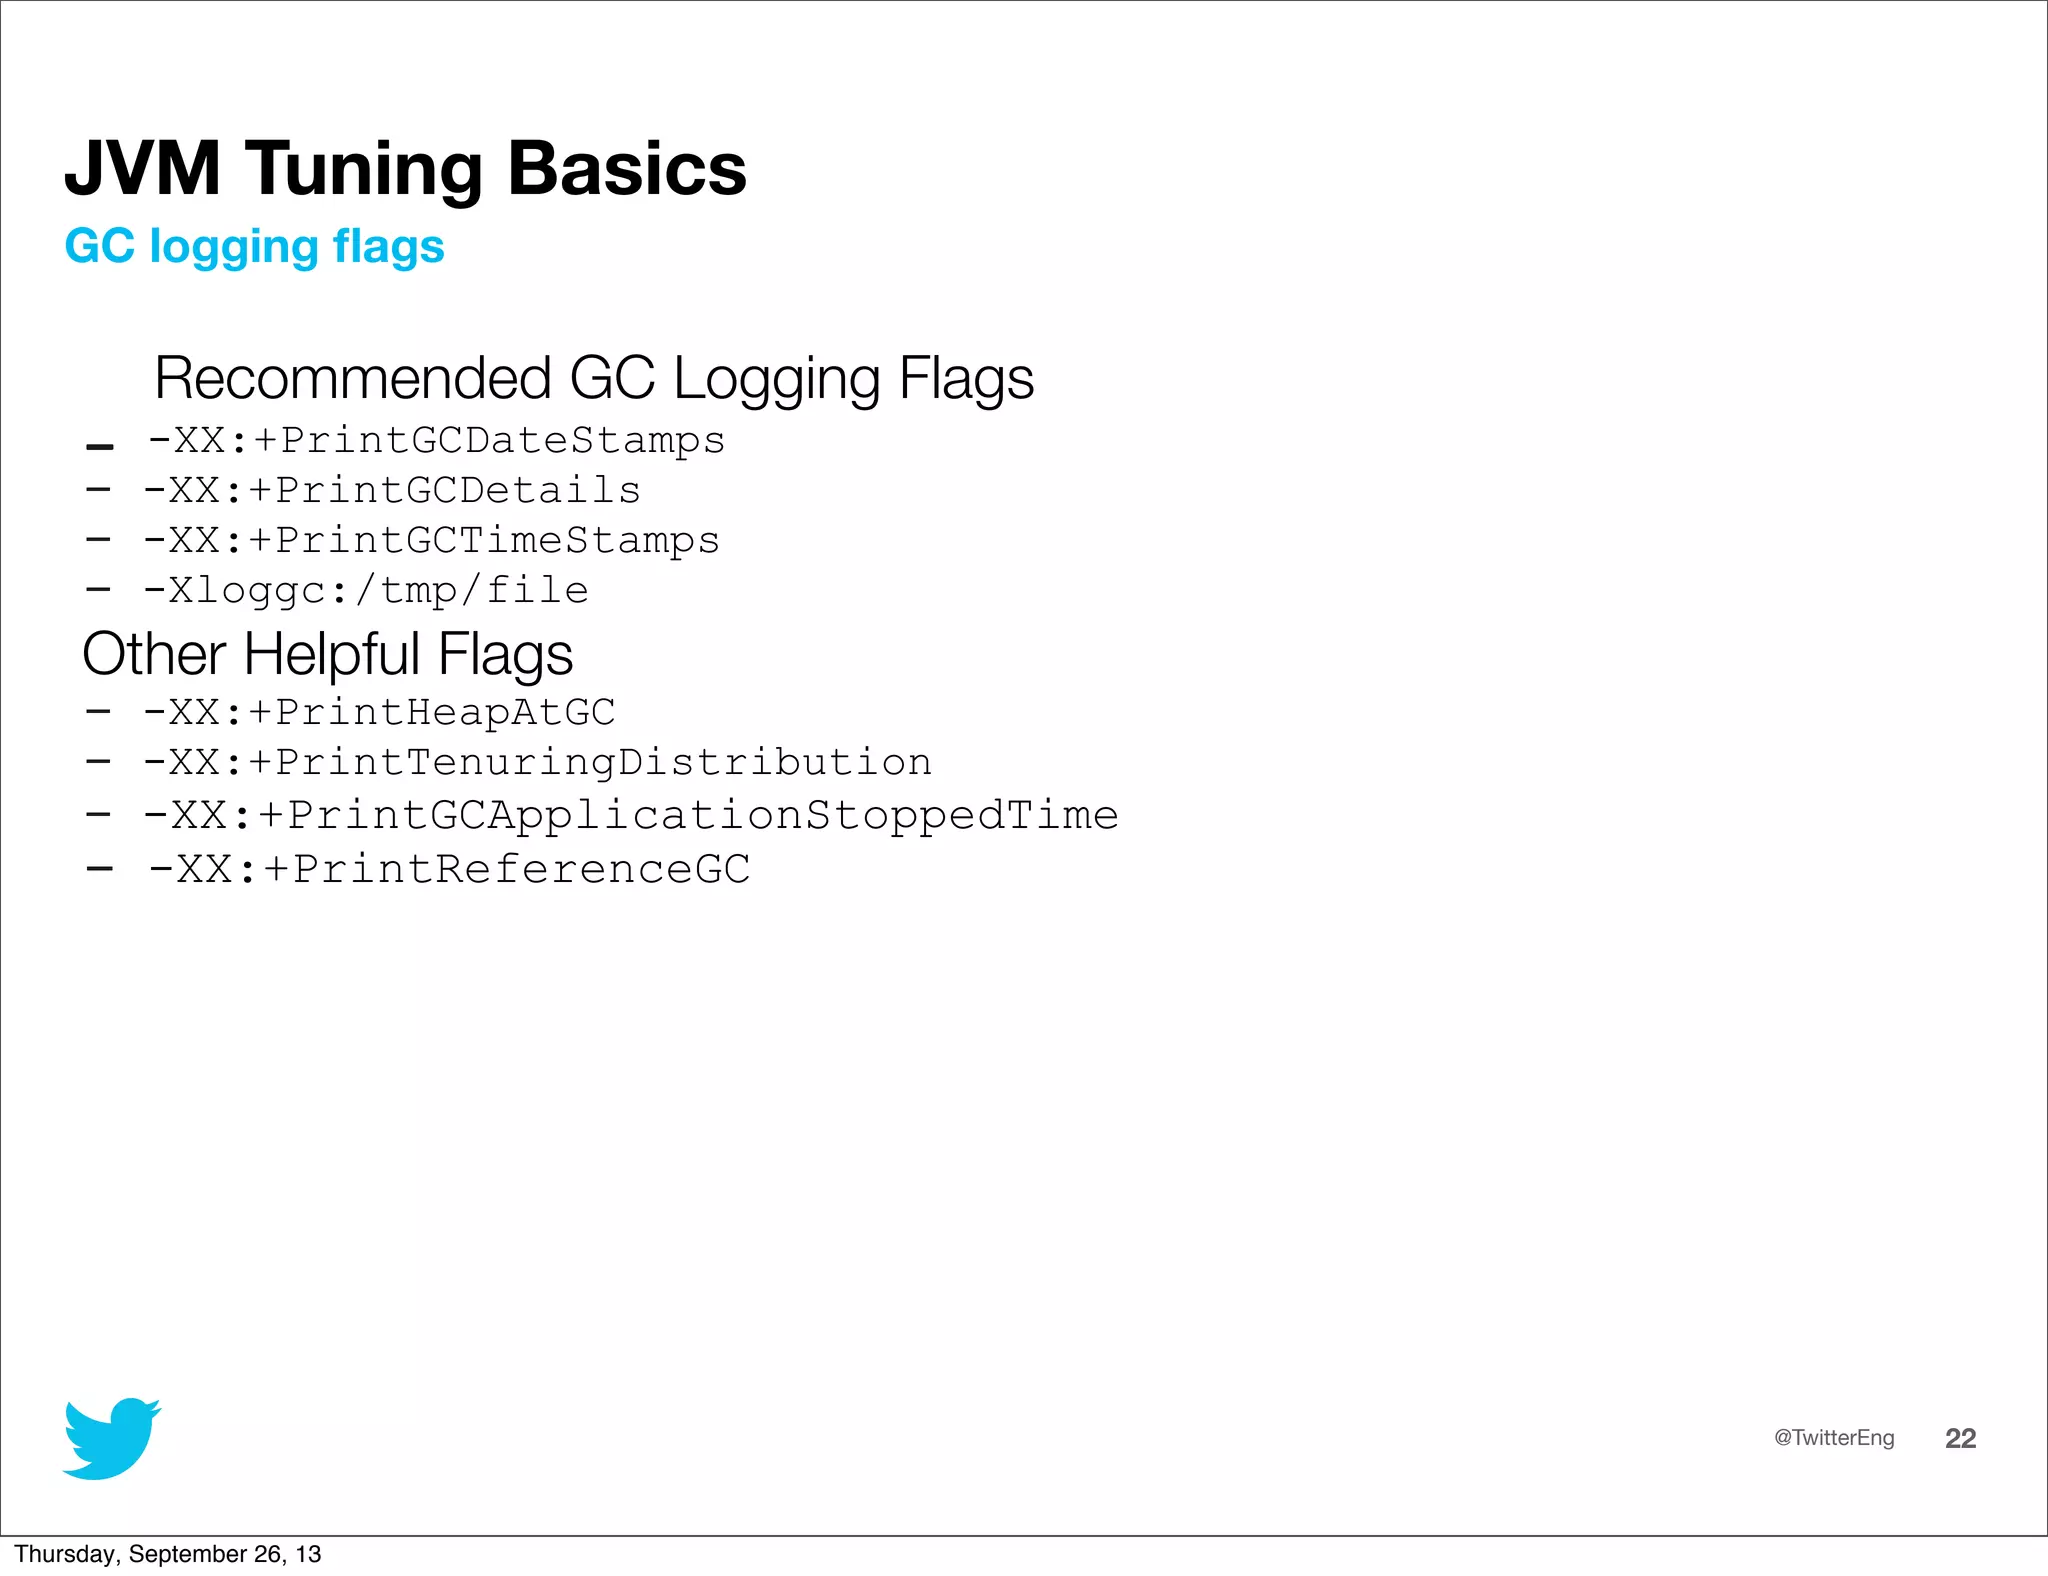
JVM Tuning Basics
Track size of Old Generation after Full GCs
[GC 435426K->392697K(657920K), 0.1411660 secs]
[Full GC 392697K->390333K(927232K), 0.5547680 secs]
[GC 625853K->592369K(1000960K), 0.1852460 secs]
[GC 831473K->800585K(1068032K), 0.1707610 secs]
[Full GC 800585K->798499K(1456640K), 1.9056030 secs]
Calculating Live Data Size
Thursday, September 26, 13](https://image.slidesharecdn.com/javaone2013-con4540-keenan-130926155153-phpapp02/75/Java-one2013-con4540-keenan-16-2048.jpg)
![@TwitterEng 17
JVM Tuning Basics
Track size of Old Generation after Young GCs if no Full GC events occur
2013-09-10T05:39:03.489+0000: [GC[ParNew: 11766264K-
>18476K(13212096K), 0.0326070 secs] 12330878K-
>583306K(16357824K), 0.0327090 secs] [Times: user=0.48
sys=0.01, real=0.03 secs]
2013-09-10T05:42:54.666+0000: [GC[ParNew: 11762604K-
>20088K(13212096K), 0.0270110 secs] 12327434K-
>585068K(16357824K), 0.0271140 secs] [Times: user=0.39
sys=0.00, real=0.02 secs]
2013-09-10T05:46:41.623+0000: [GC[ParNew: 11764216K-
>21013K(13212096K), 0.0267490 secs] 12329196K-
>586133K(16357824K), 0.0268490 secs] [Times: user=0.40
sys=0.00, real=0.03 secs]
Calculating Live Data Size
Thursday, September 26, 13](https://image.slidesharecdn.com/javaone2013-con4540-keenan-130926155153-phpapp02/75/Java-one2013-con4540-keenan-17-2048.jpg)
![@TwitterEng 23
JVM Tuning Basics
2013-09-10T05:39:03.489+0000: [GC[ParNew: 11766264K-
>18476K(13212096K), 0.0326070 secs] 12330878K-
>583306K(16357824K), 0.0327090 secs] [Times: user=0.48
sys=0.01, real=0.03 secs]
2013-09-10T05:42:54.666+0000: [GC[ParNew: 11762604K-
>20088K(13212096K), 0.0270110 secs] 12327434K-
>585068K(16357824K), 0.0271140 secs] [Times: user=0.39
sys=0.00, real=0.02 secs]
2013-09-10T05:46:41.623+0000: [GC[ParNew: 11764216K-
>21013K(13212096K), 0.0267490 secs] 12329196K-
>586133K(16357824K), 0.0268490 secs] [Times: user=0.40
sys=0.00, real=0.03 secs]
(YGen before GC) - (YGen after gc) / ΔTime
(11764216K - 21013K) / (5:46:41.623+0000 - 5:42:54.666+0000)
11.2GB / 186 sec = ~62 MB/sec
Calculating Allocation Rate
Thursday, September 26, 13](https://image.slidesharecdn.com/javaone2013-con4540-keenan-130926155153-phpapp02/75/Java-one2013-con4540-keenan-23-2048.jpg)
![@TwitterEng 24
JVM Tuning Basics
2013-09-10T05:39:03.489+0000: [GC[ParNew: 11766264K-
>18476K(13212096K), 0.0326070 secs] 12330878K-
>583306K(16357824K), 0.0327090 secs] [Times: user=0.48
sys=0.01, real=0.03 secs]
2013-09-10T05:42:54.666+0000: [GC[ParNew: 11762604K-
>20088K(13212096K), 0.0270110 secs] 12327434K-
>585068K(16357824K), 0.0271140 secs] [Times: user=0.39
sys=0.00, real=0.02 secs]
2013-09-10T05:46:41.623+0000: [GC[ParNew: 11764216K-
>21013K(13212096K), 0.0267490 secs] 12329196K-
>586133K(16357824K), 0.0268490 secs] [Times: user=0.40
sys=0.00, real=0.03 secs]
ΔOld Generation Size / ΔTime
(586133K - 583306K) / (5:46:41.623+0000 - 5:39:03.489+0000)
2827Kb / 458 sec = ~6.172Kb/sec
Calculating Promotion Rate
Thursday, September 26, 13](https://image.slidesharecdn.com/javaone2013-con4540-keenan-130926155153-phpapp02/75/Java-one2013-con4540-keenan-24-2048.jpg)

![@TwitterEng 47
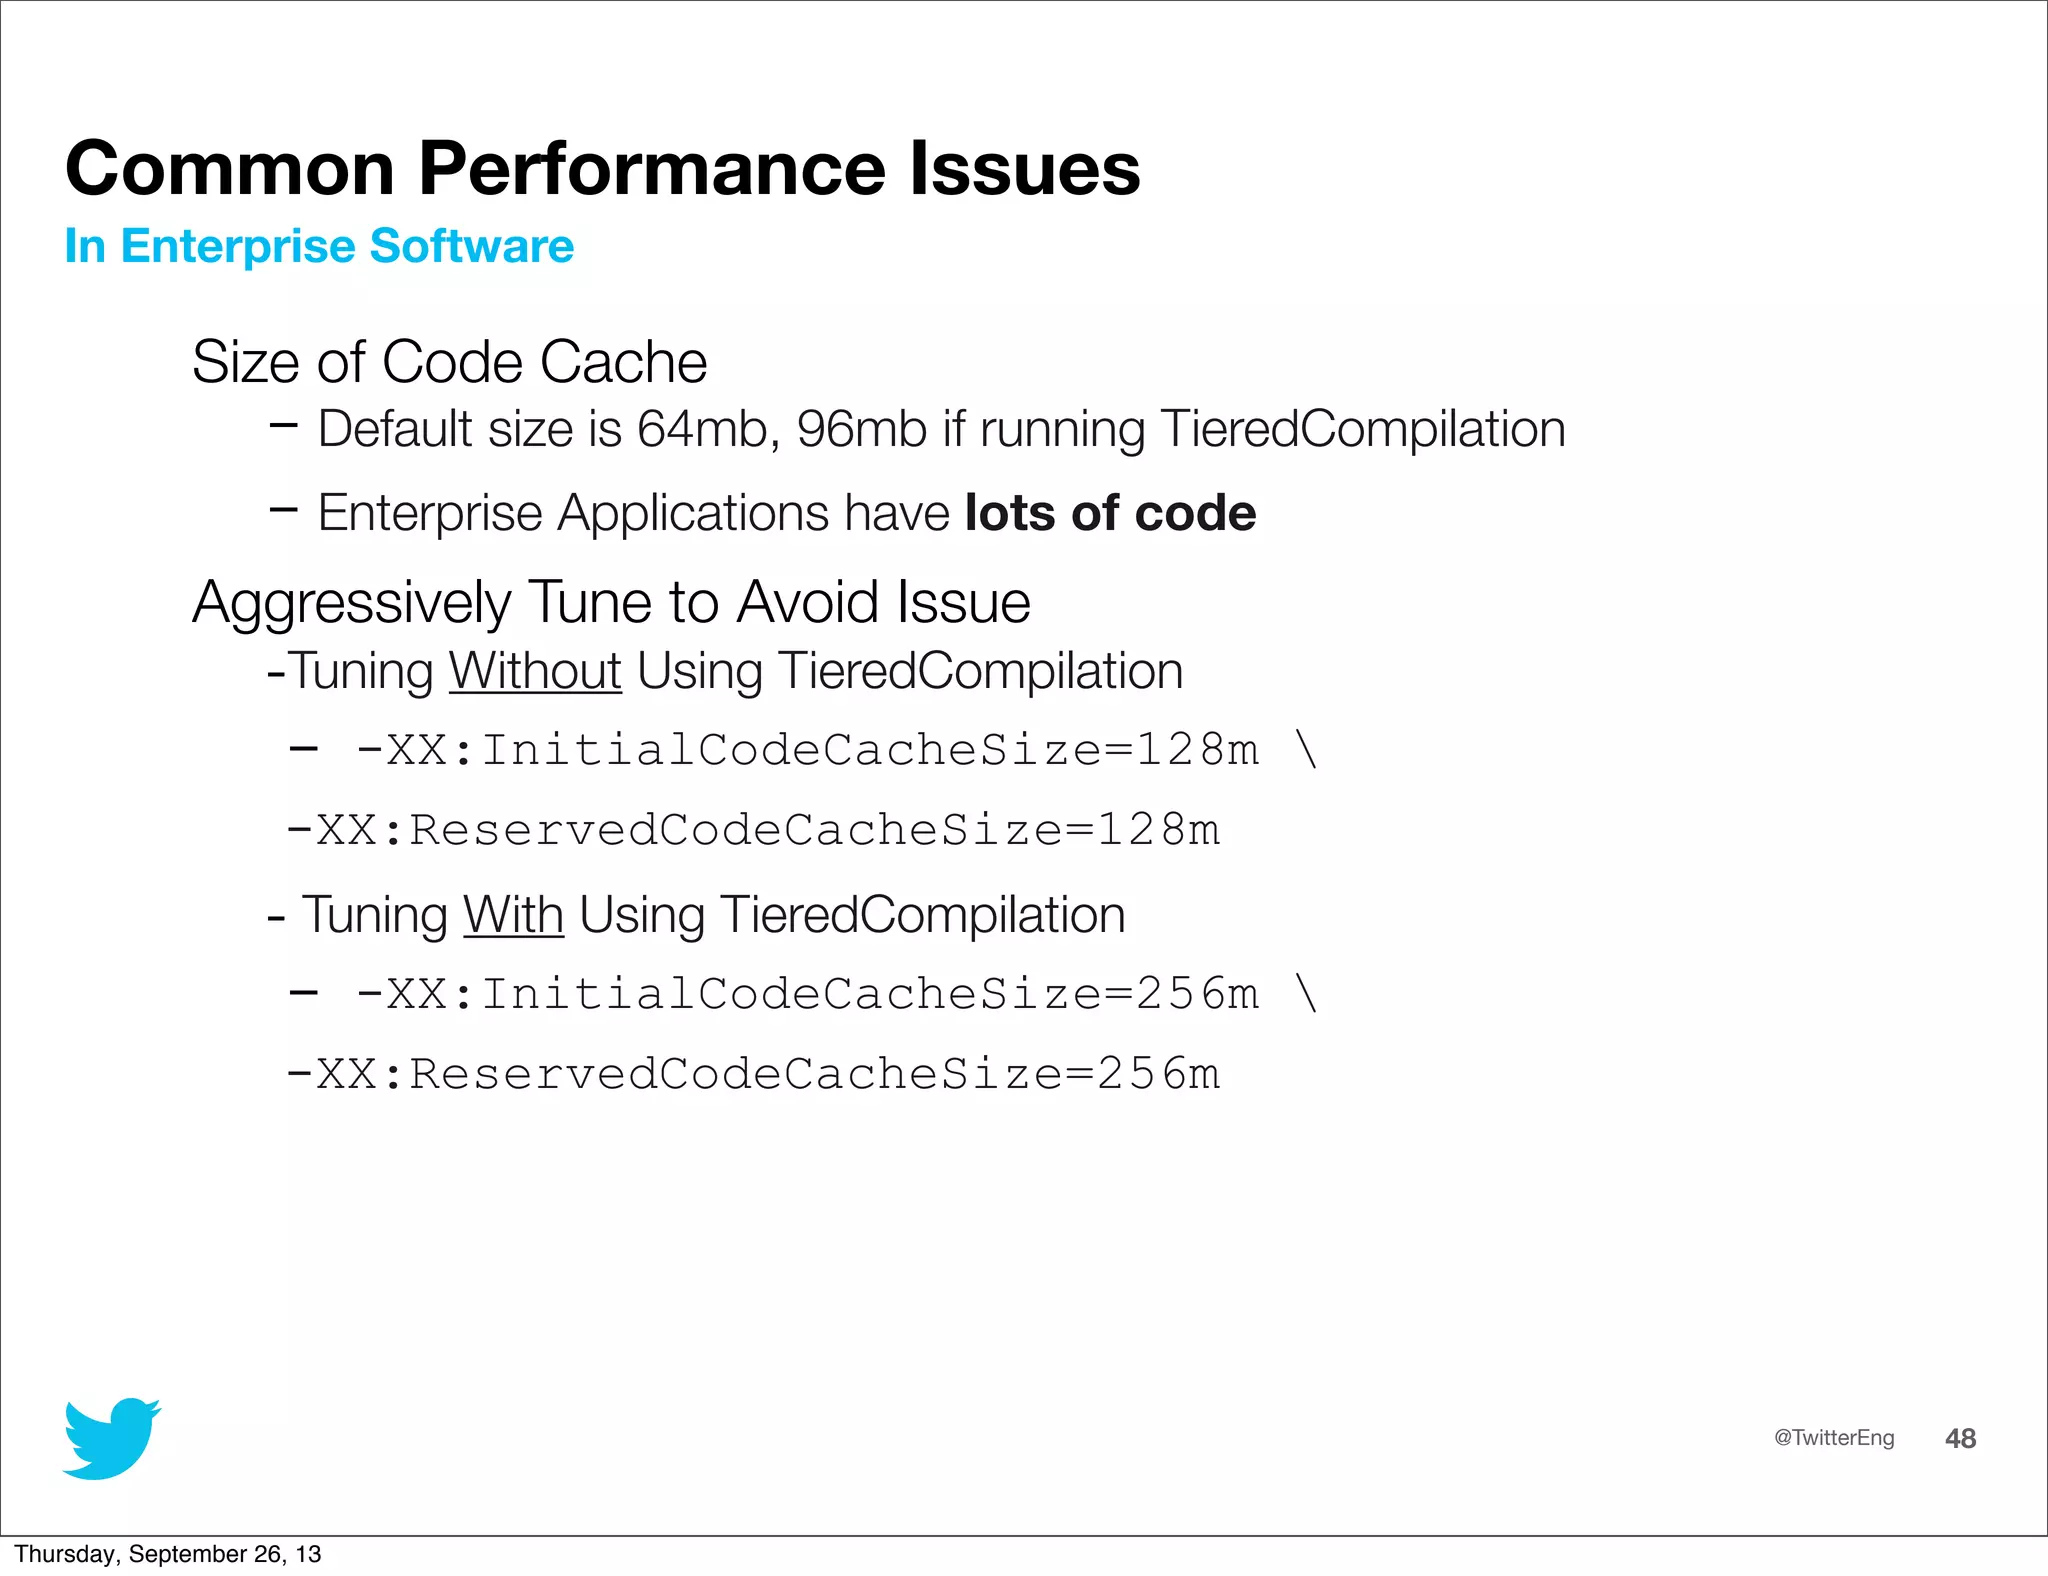
Common Performance Issues
Size of Permanent Generation
- Perm. Gen. only collects and resizes at Full GC.
Heap before GC invocations=40019 (full 36522):
par new generation total 15354176K, used 14K [0x00000003b9c00000, 0x0000000779c00000,
0x0000000779c00000)
eden space 14979712K, 0% used [0x00000003b9c00000, 0x00000003b9c039a8, 0x000000074c0a0000)
from space 374464K, 0% used [0x000000074c0a0000, 0x000000074c0a0000, 0x0000000762e50000)
to space 374464K, 0% used [0x0000000762e50000, 0x0000000762e50000, 0x0000000779c00000)
concurrent mark-sweep generation total 2097152K, used 588343K [0x0000000779c00000, 0x00000007f9c00000,
0x00000007f9c00000)
concurrent-mark-sweep perm gen total 102400K, used 102399K [0x00000007f9c00000, 0x0000000800000000,
0x0000000800000000)
2013-09-05T17:21:39.530+0000: [Full GC[CMS: 588343K->588343K(2097152K), 1.6166150 secs] 588357K-
>588343K(17451328K), [CMS Perm : 102399K->102399K(102400K)], 1.6167040 secs] [Times: user=1.57 sys=0.00,
real=1.61 secs]
Heap after GC invocations=40020 (full 36523):
par new generation total 15354176K, used 0K [0x00000003b9c00000, 0x0000000779c00000,
0x0000000779c00000)
eden space 14979712K, 0% used [0x00000003b9c00000, 0x00000003b9c00000, 0x000000074c0a0000)
from space 374464K, 0% used [0x000000074c0a0000, 0x000000074c0a0000, 0x0000000762e50000)
to space 374464K, 0% used [0x0000000762e50000, 0x0000000762e50000, 0x0000000779c00000)
concurrent mark-sweep generation total 2097152K, used 588343K [0x0000000779c00000, 0x00000007f9c00000,
0x00000007f9c00000)
concurrent-mark-sweep perm gen total 102400K, used 102399K [0x00000007f9c00000, 0x0000000800000000,
0x0000000800000000)
}
Recommendation: -XX:PermSize=256m –XX:MaxPermSize=256m
In Enterprise Software
Thursday, September 26, 13](https://image.slidesharecdn.com/javaone2013-con4540-keenan-130926155153-phpapp02/75/Java-one2013-con4540-keenan-47-2048.jpg)