Download as PDF, PPTX
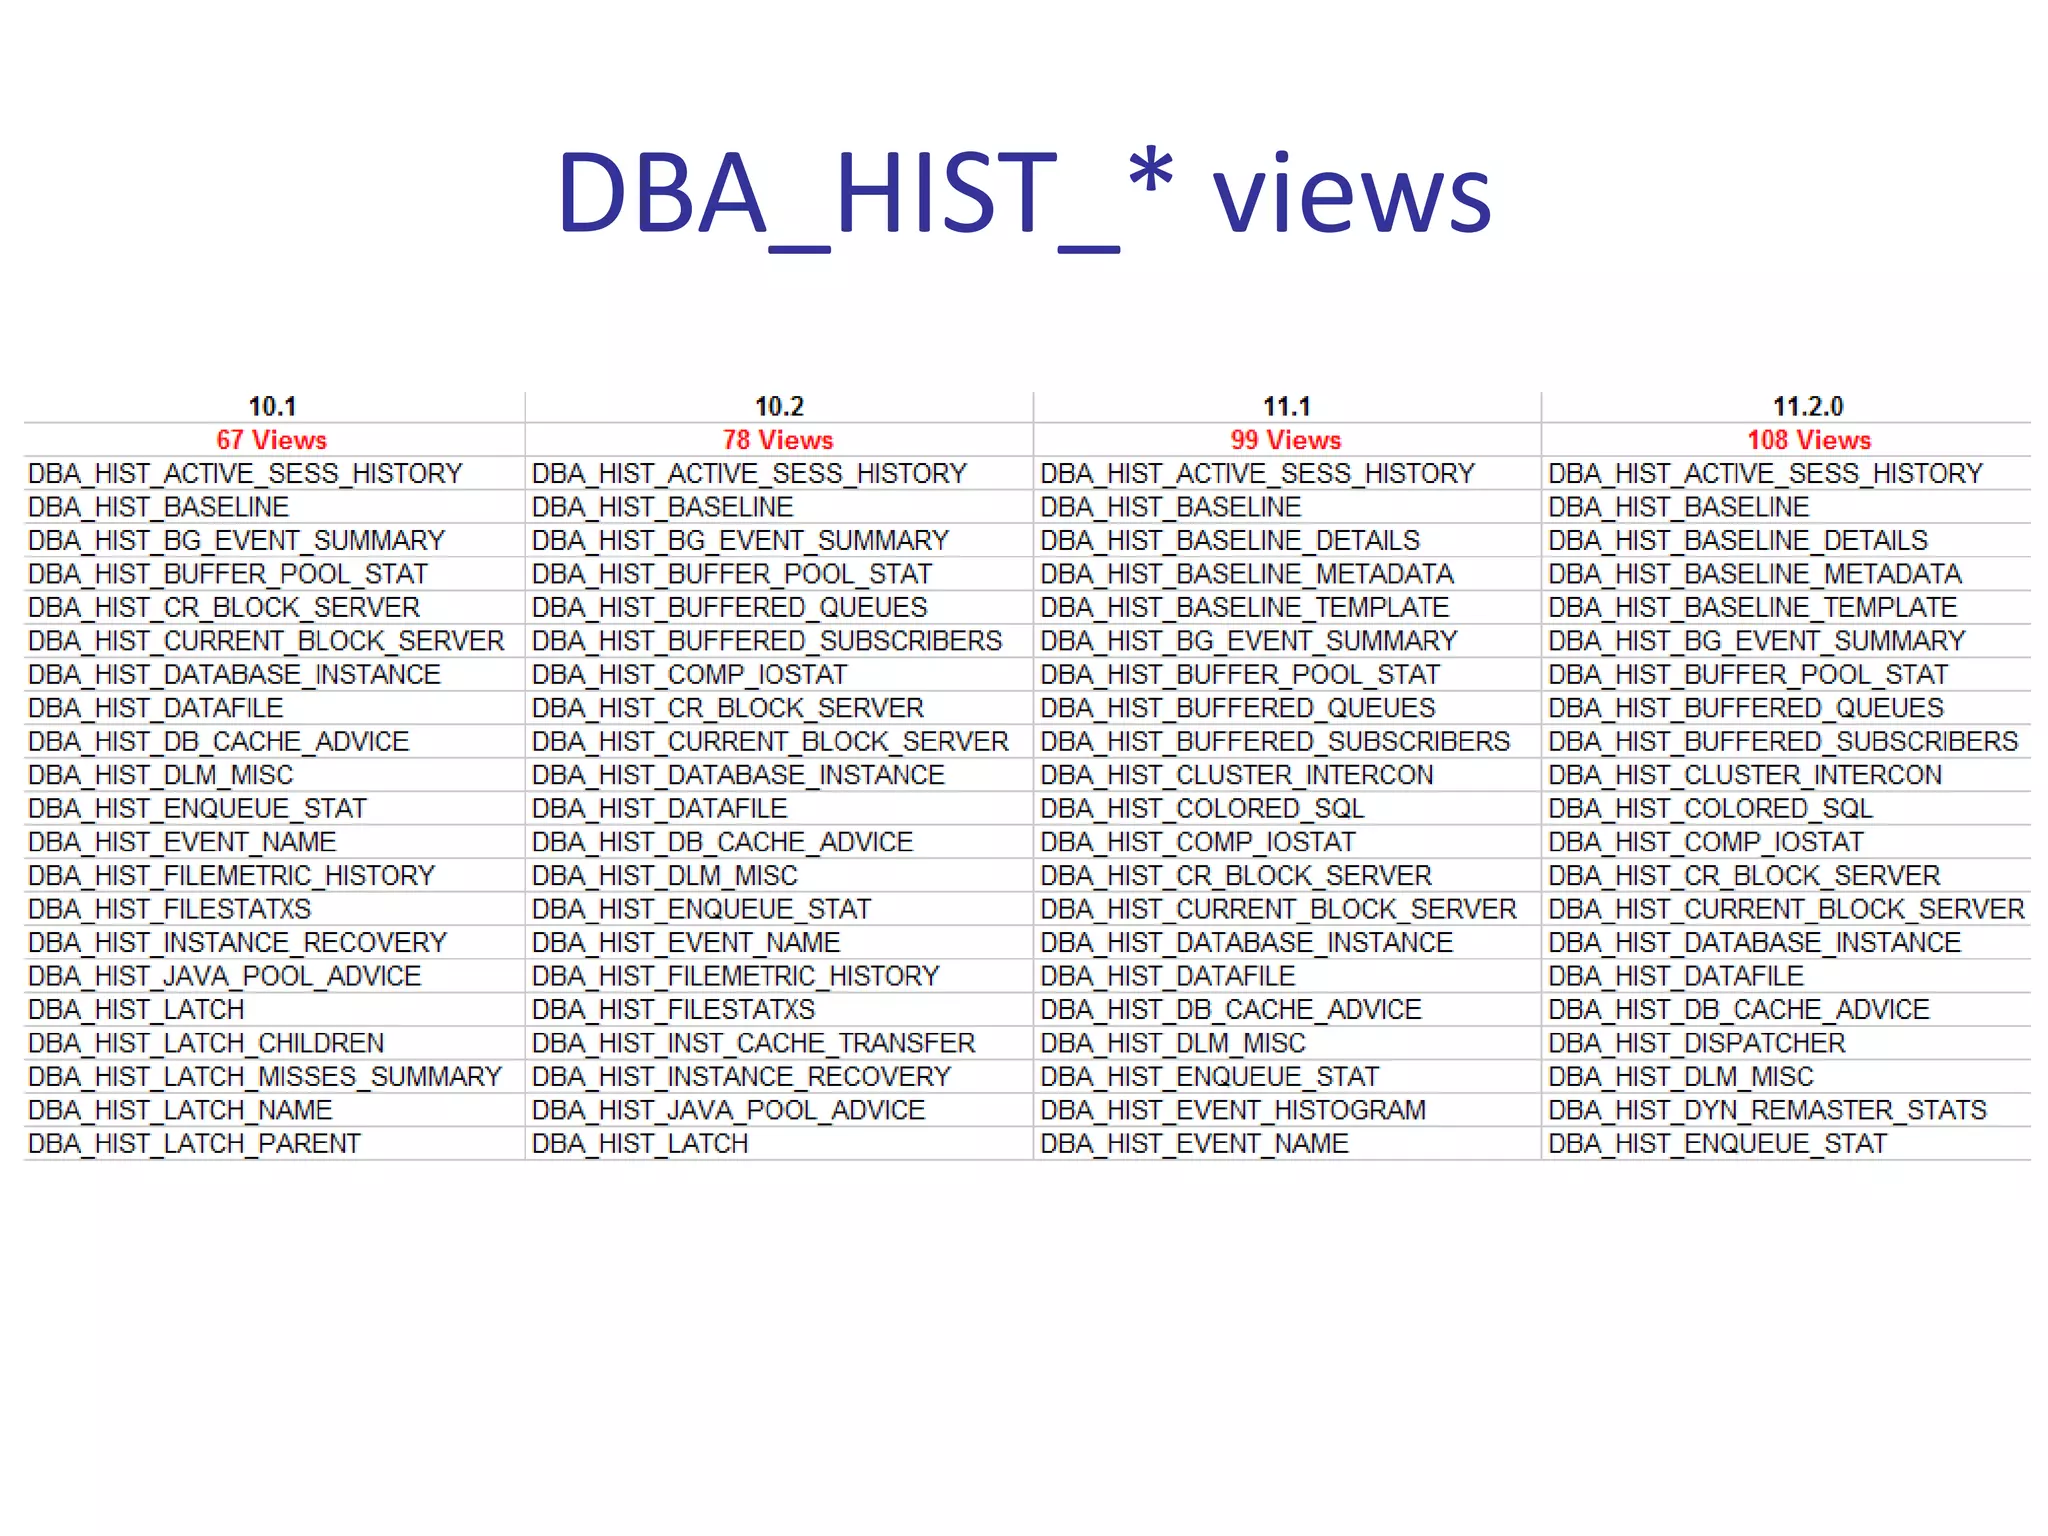
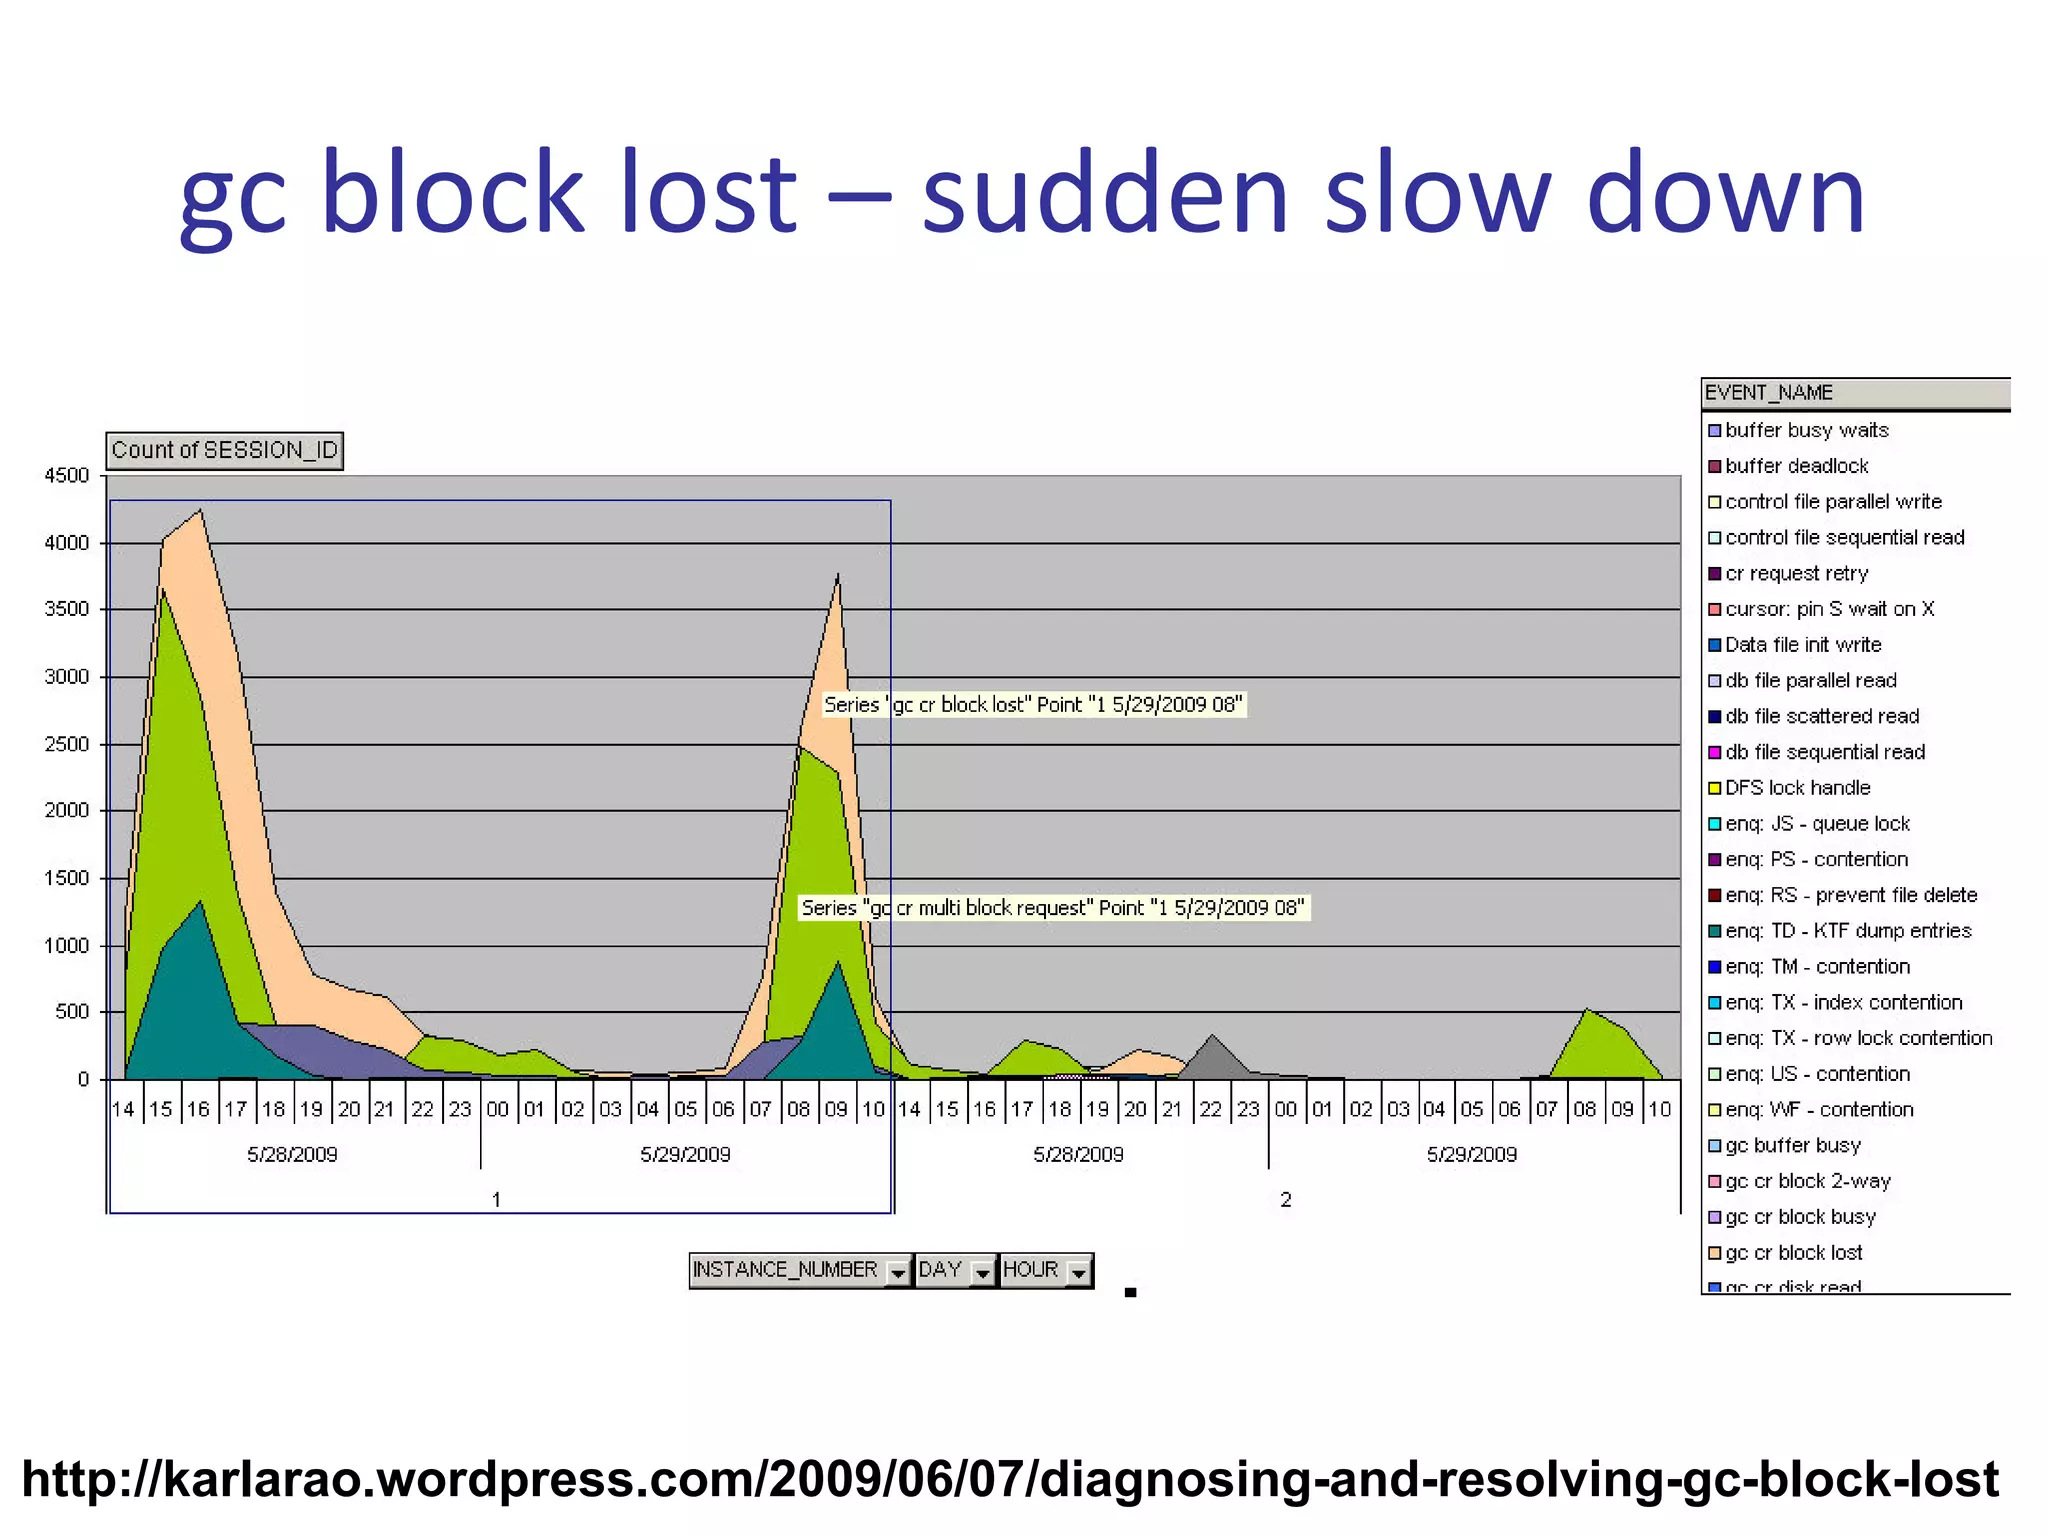
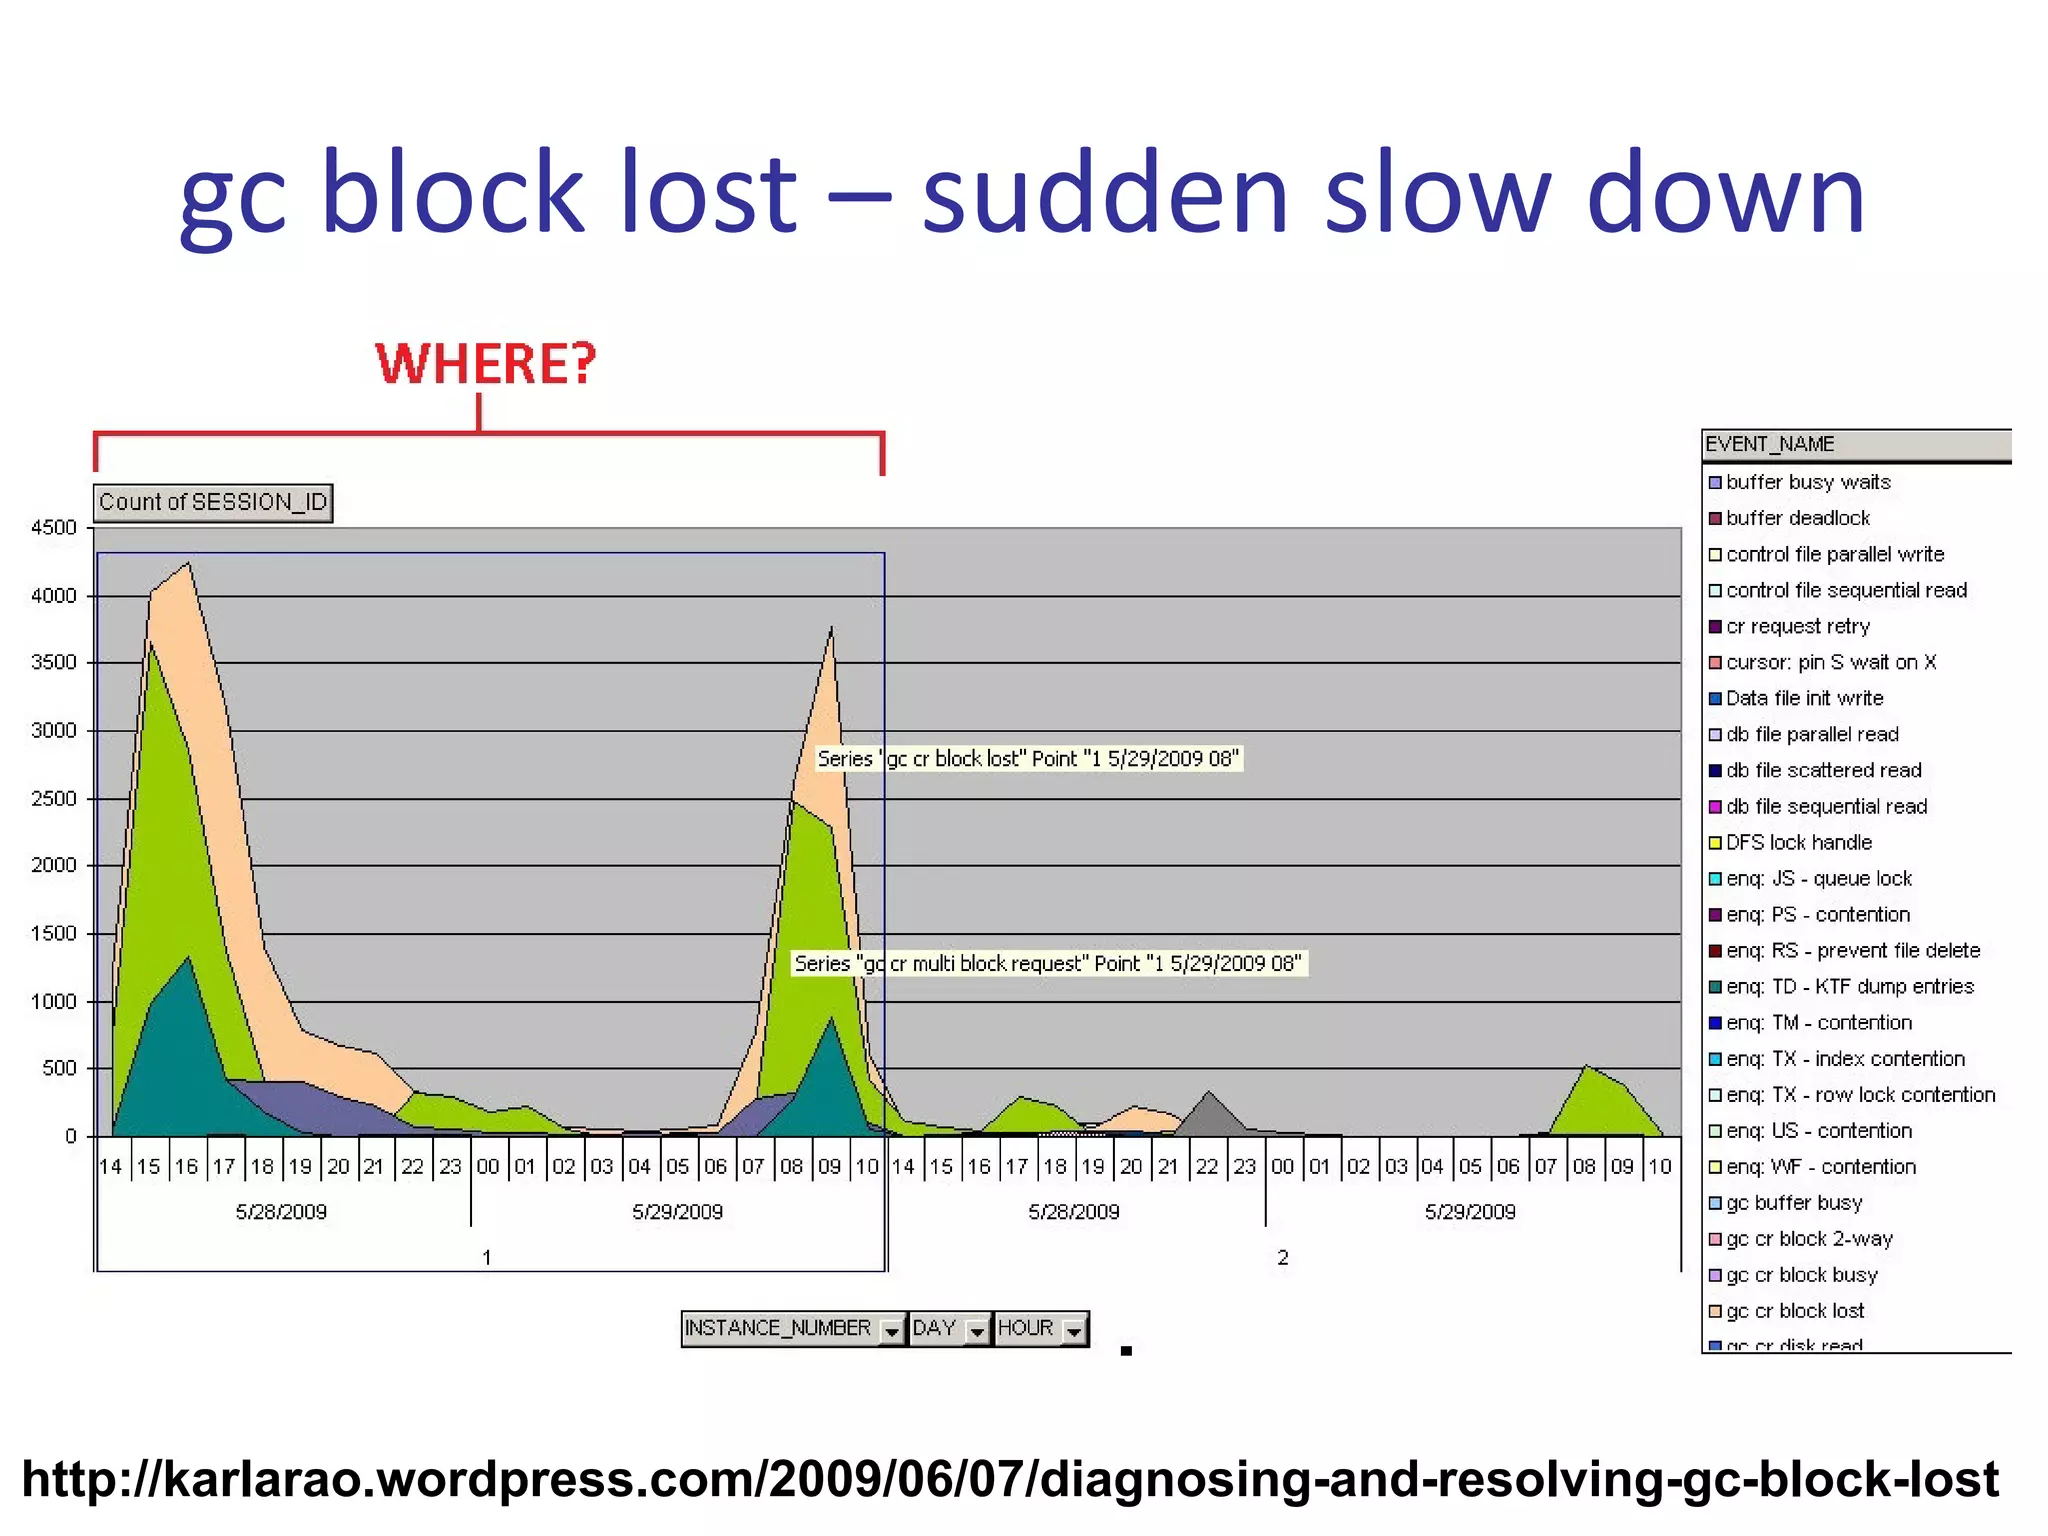
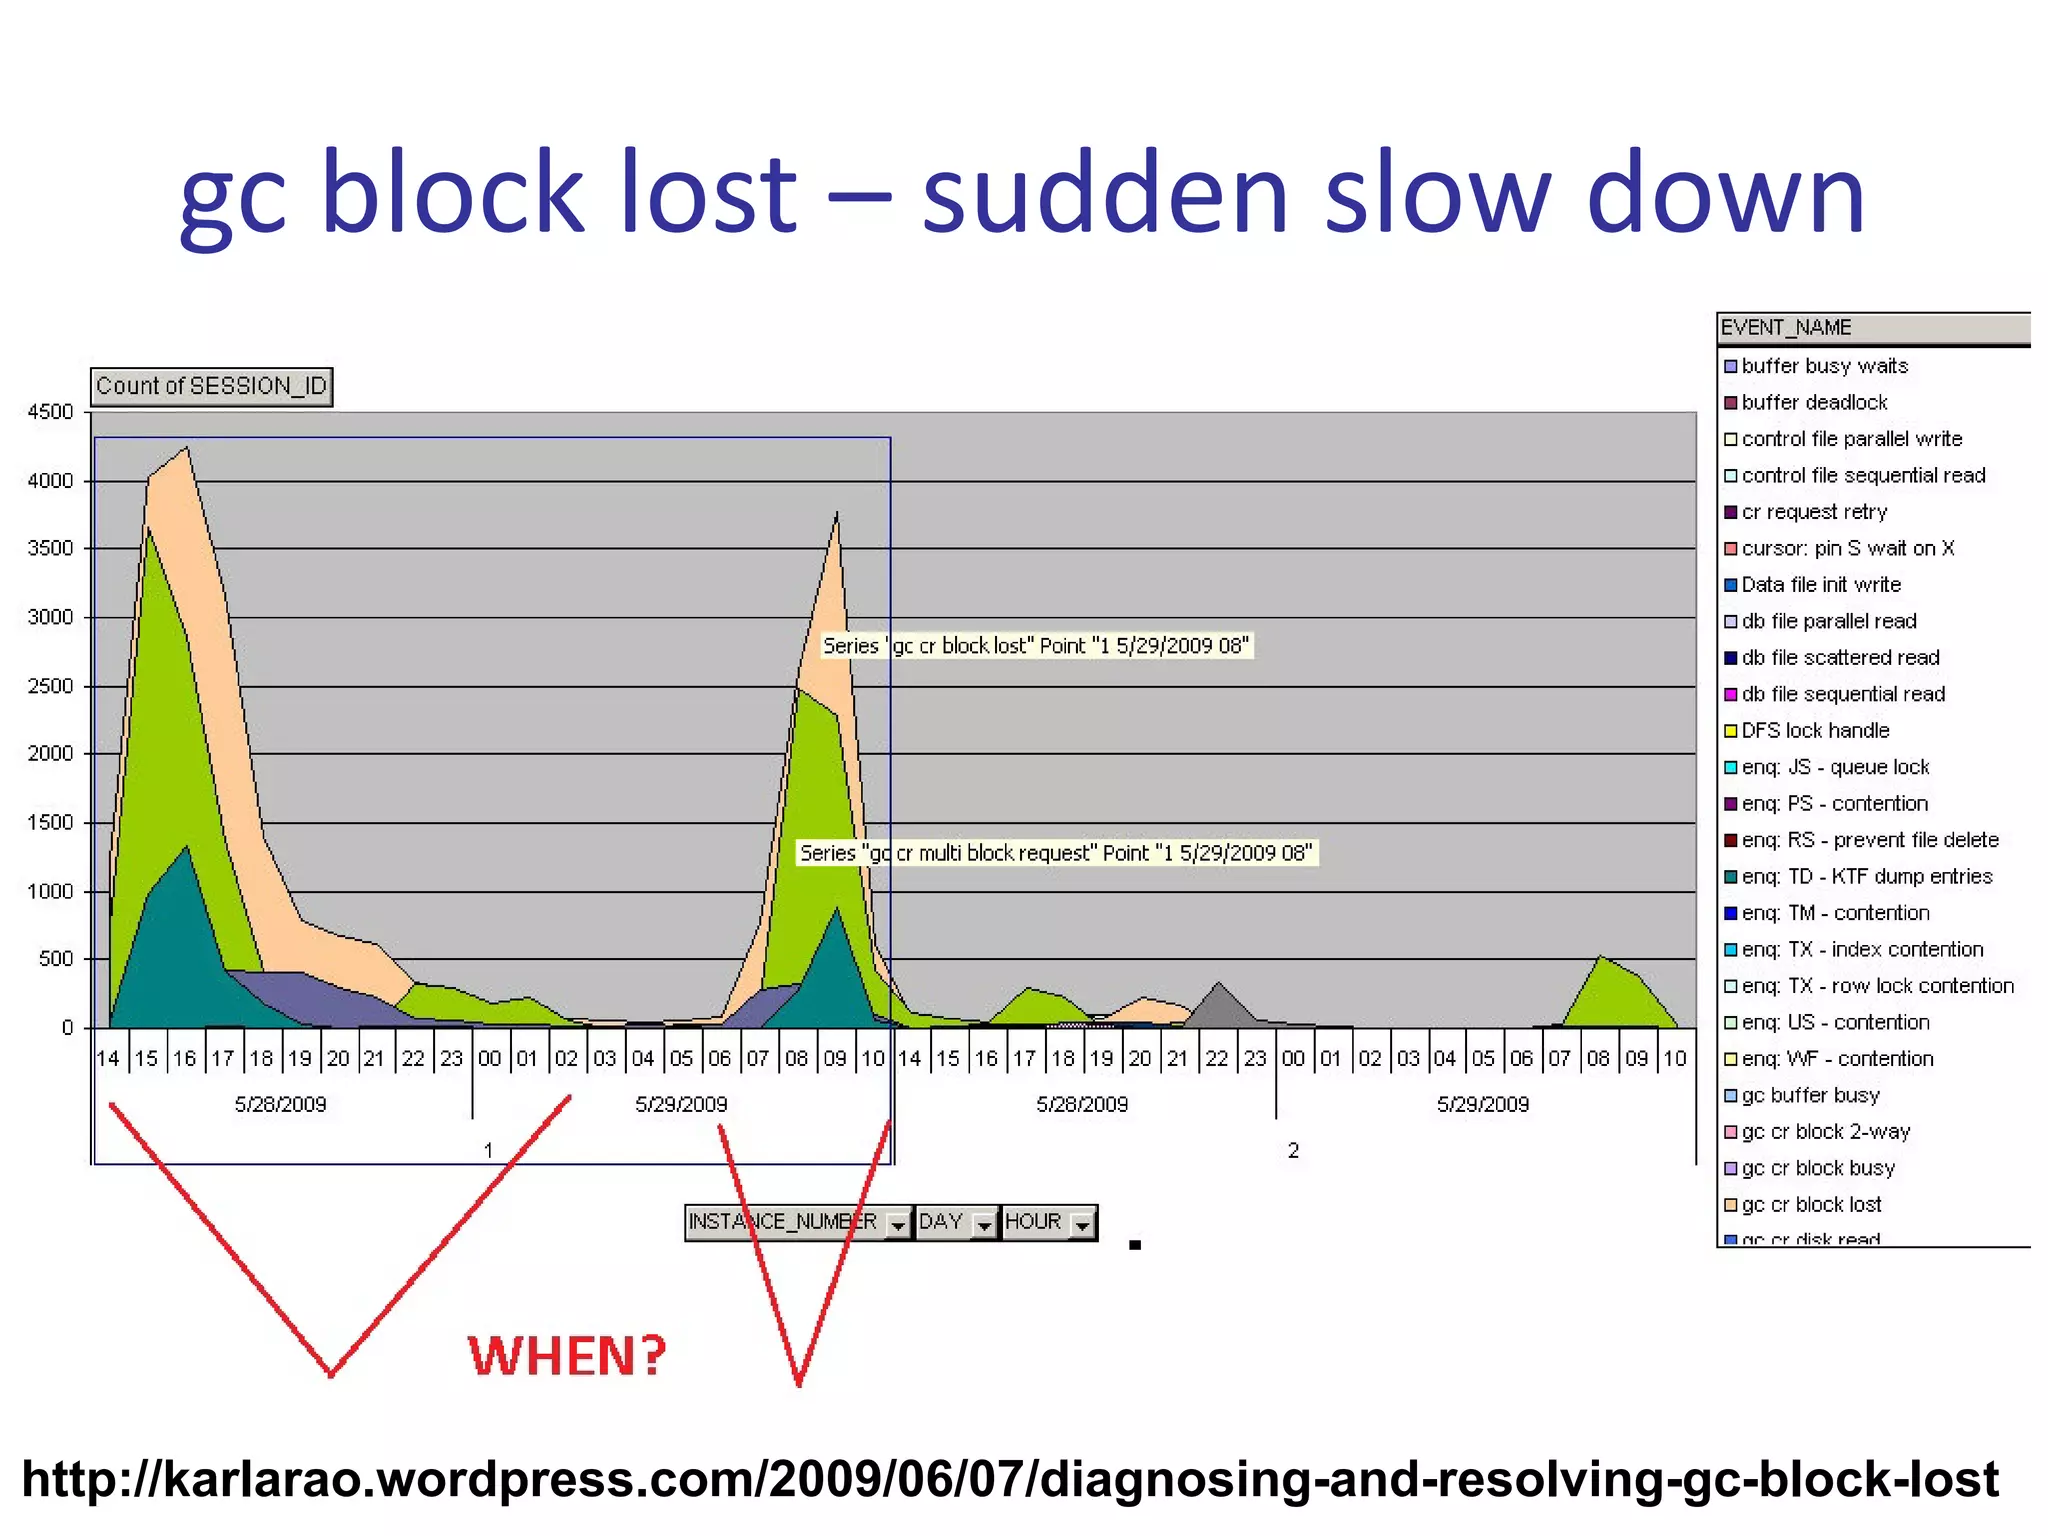
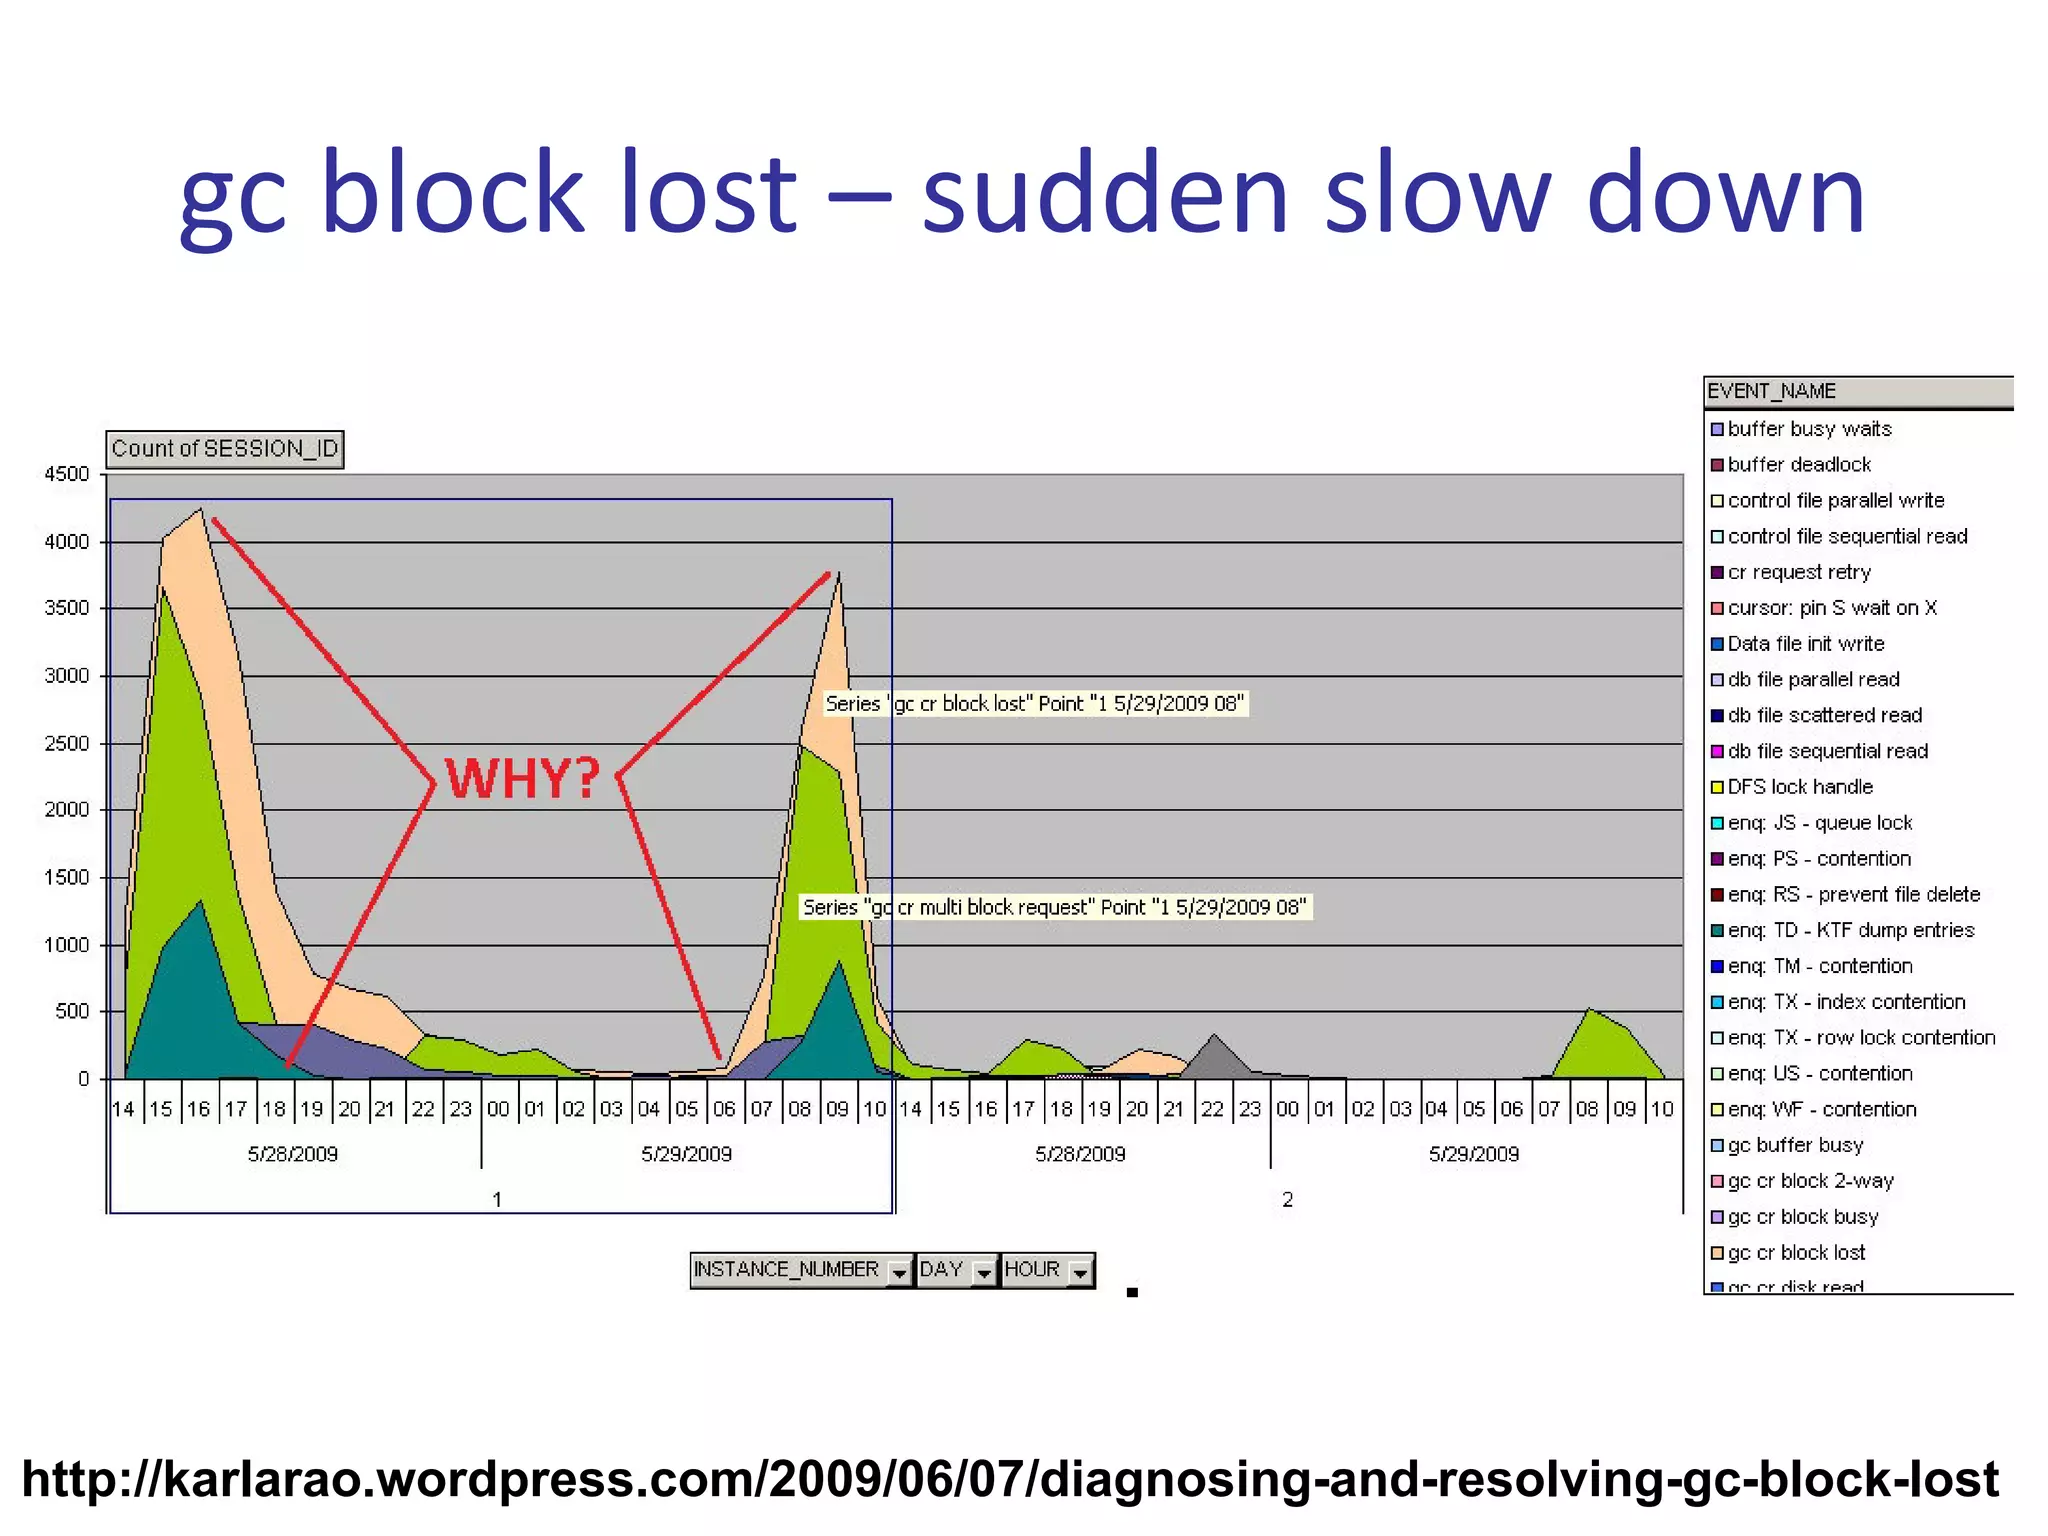
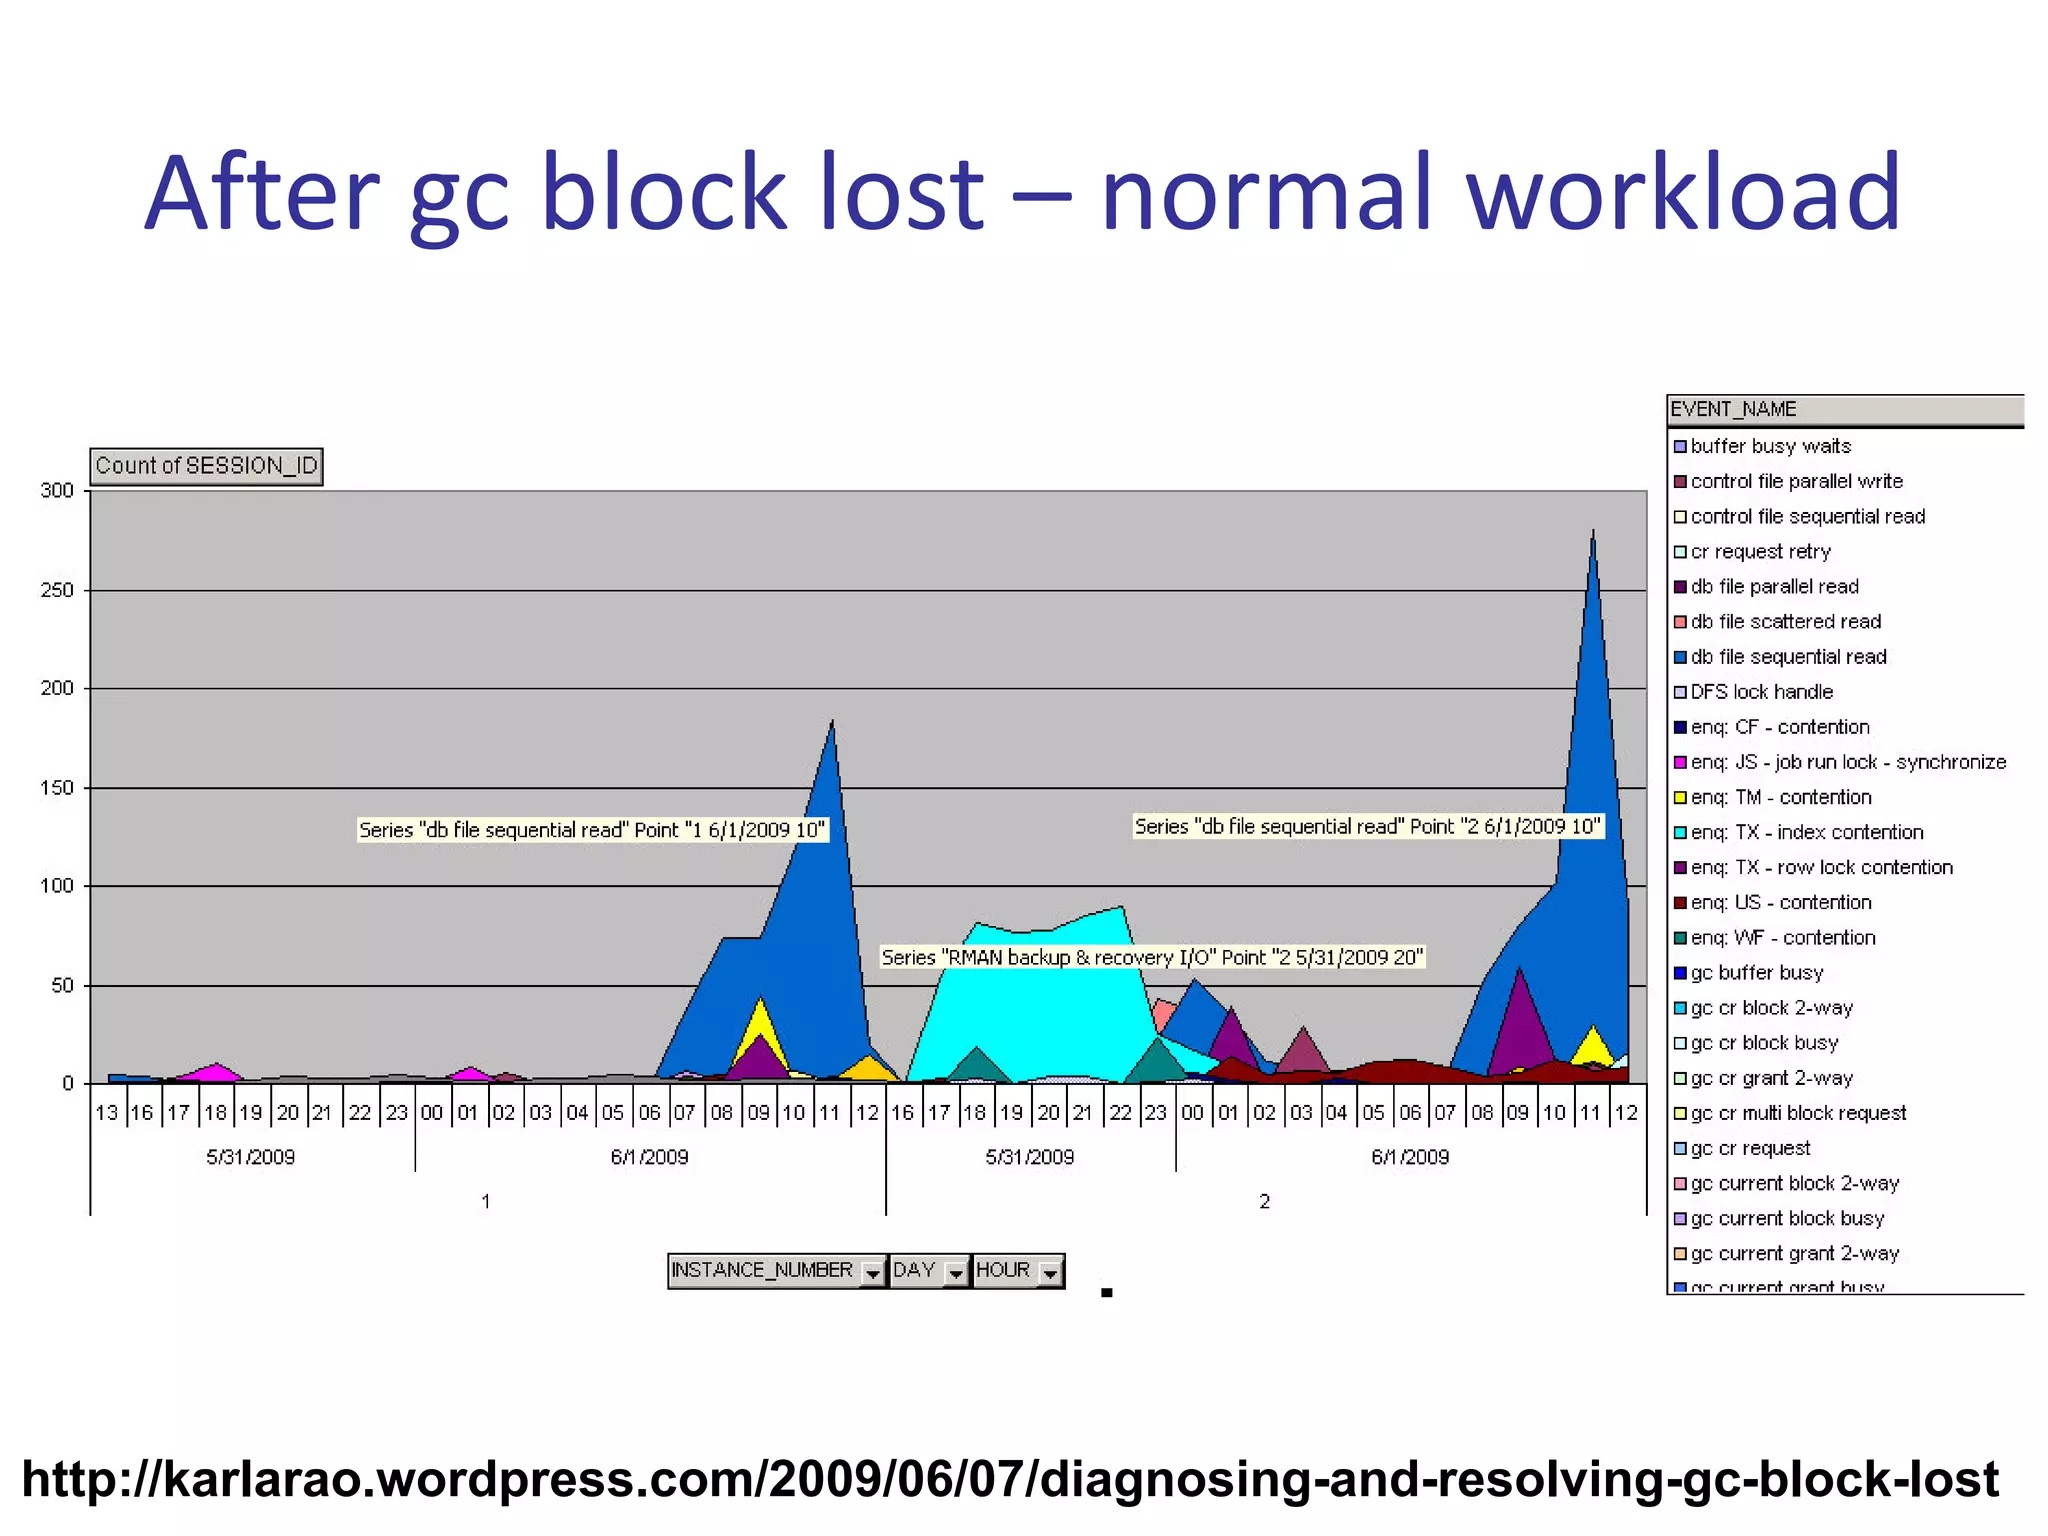
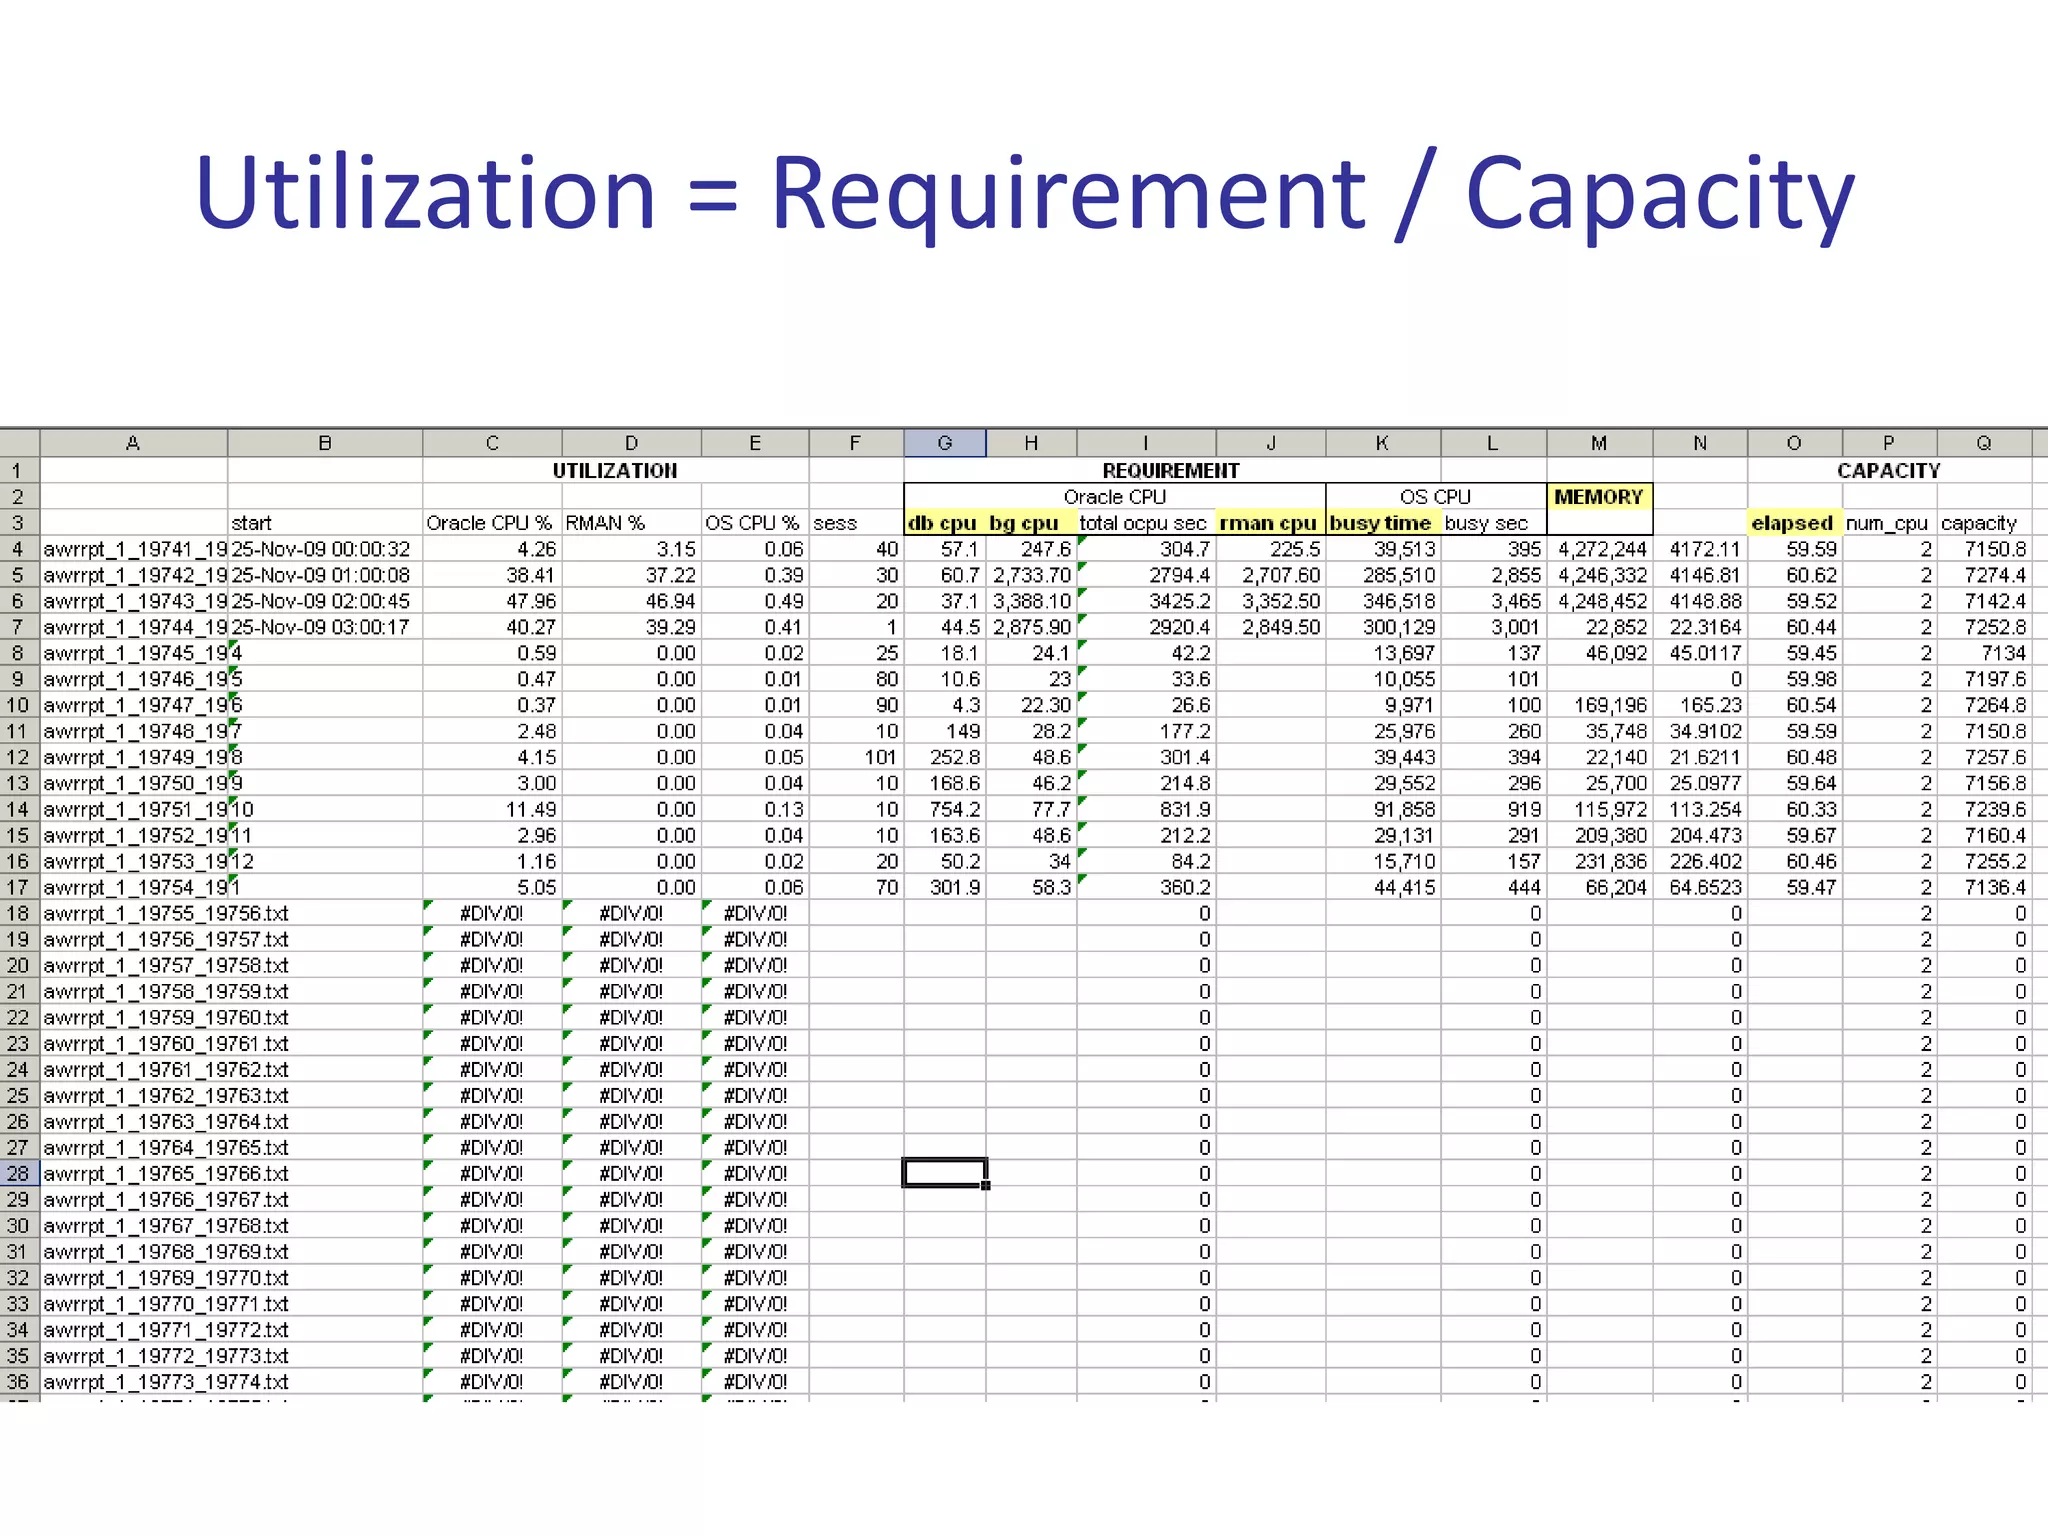
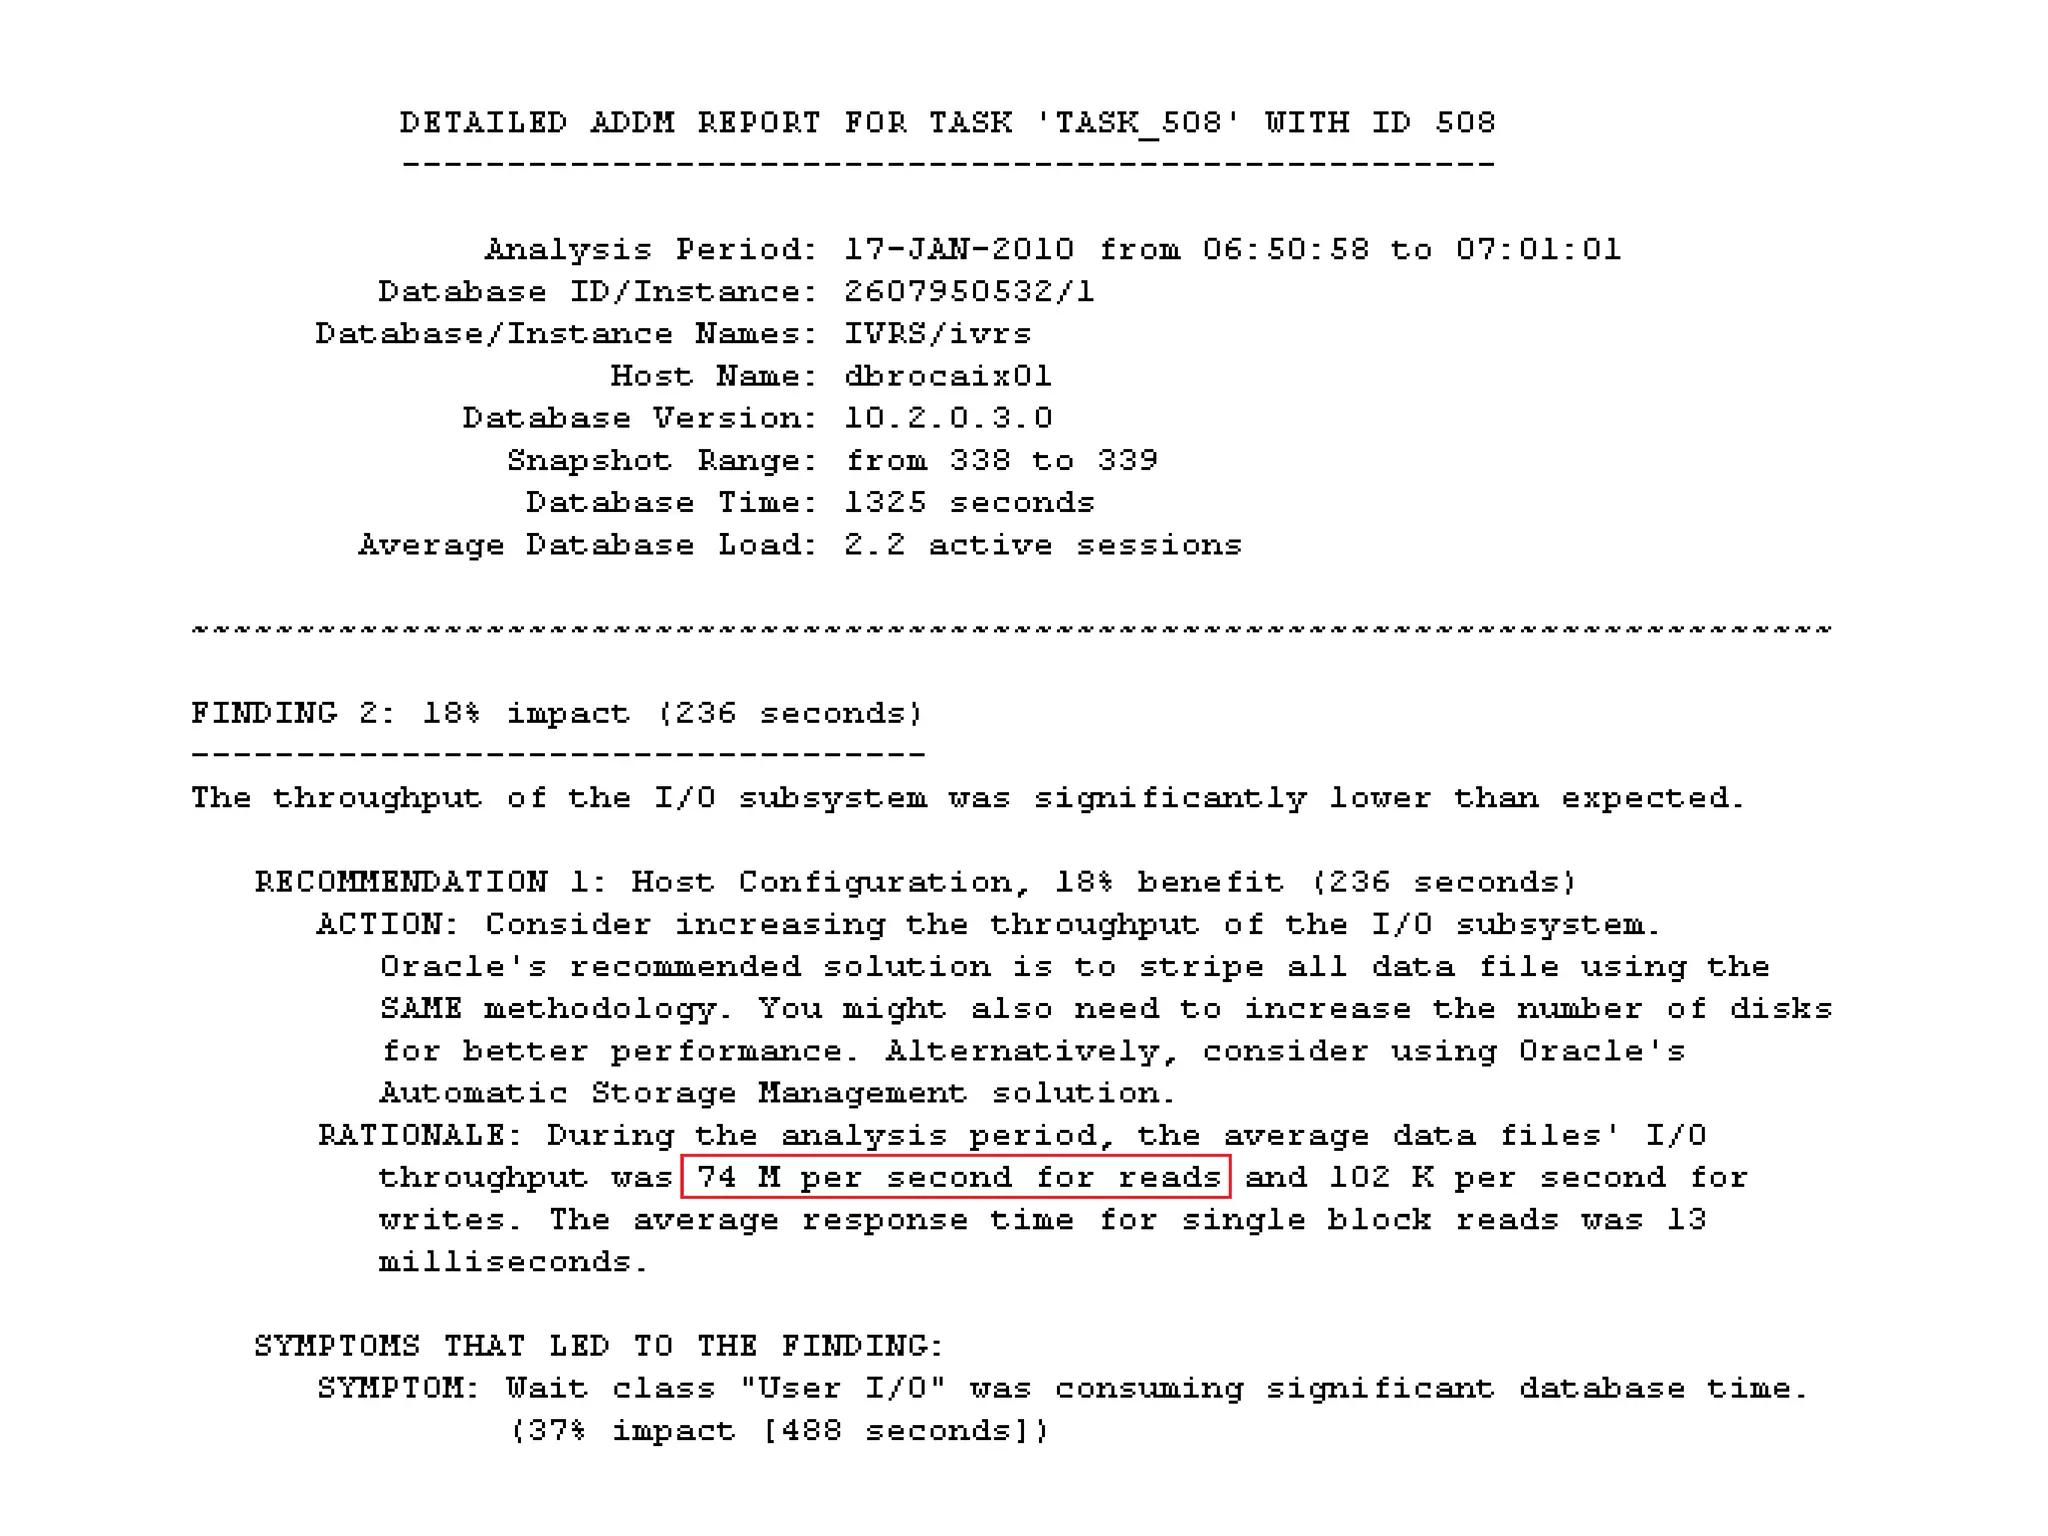
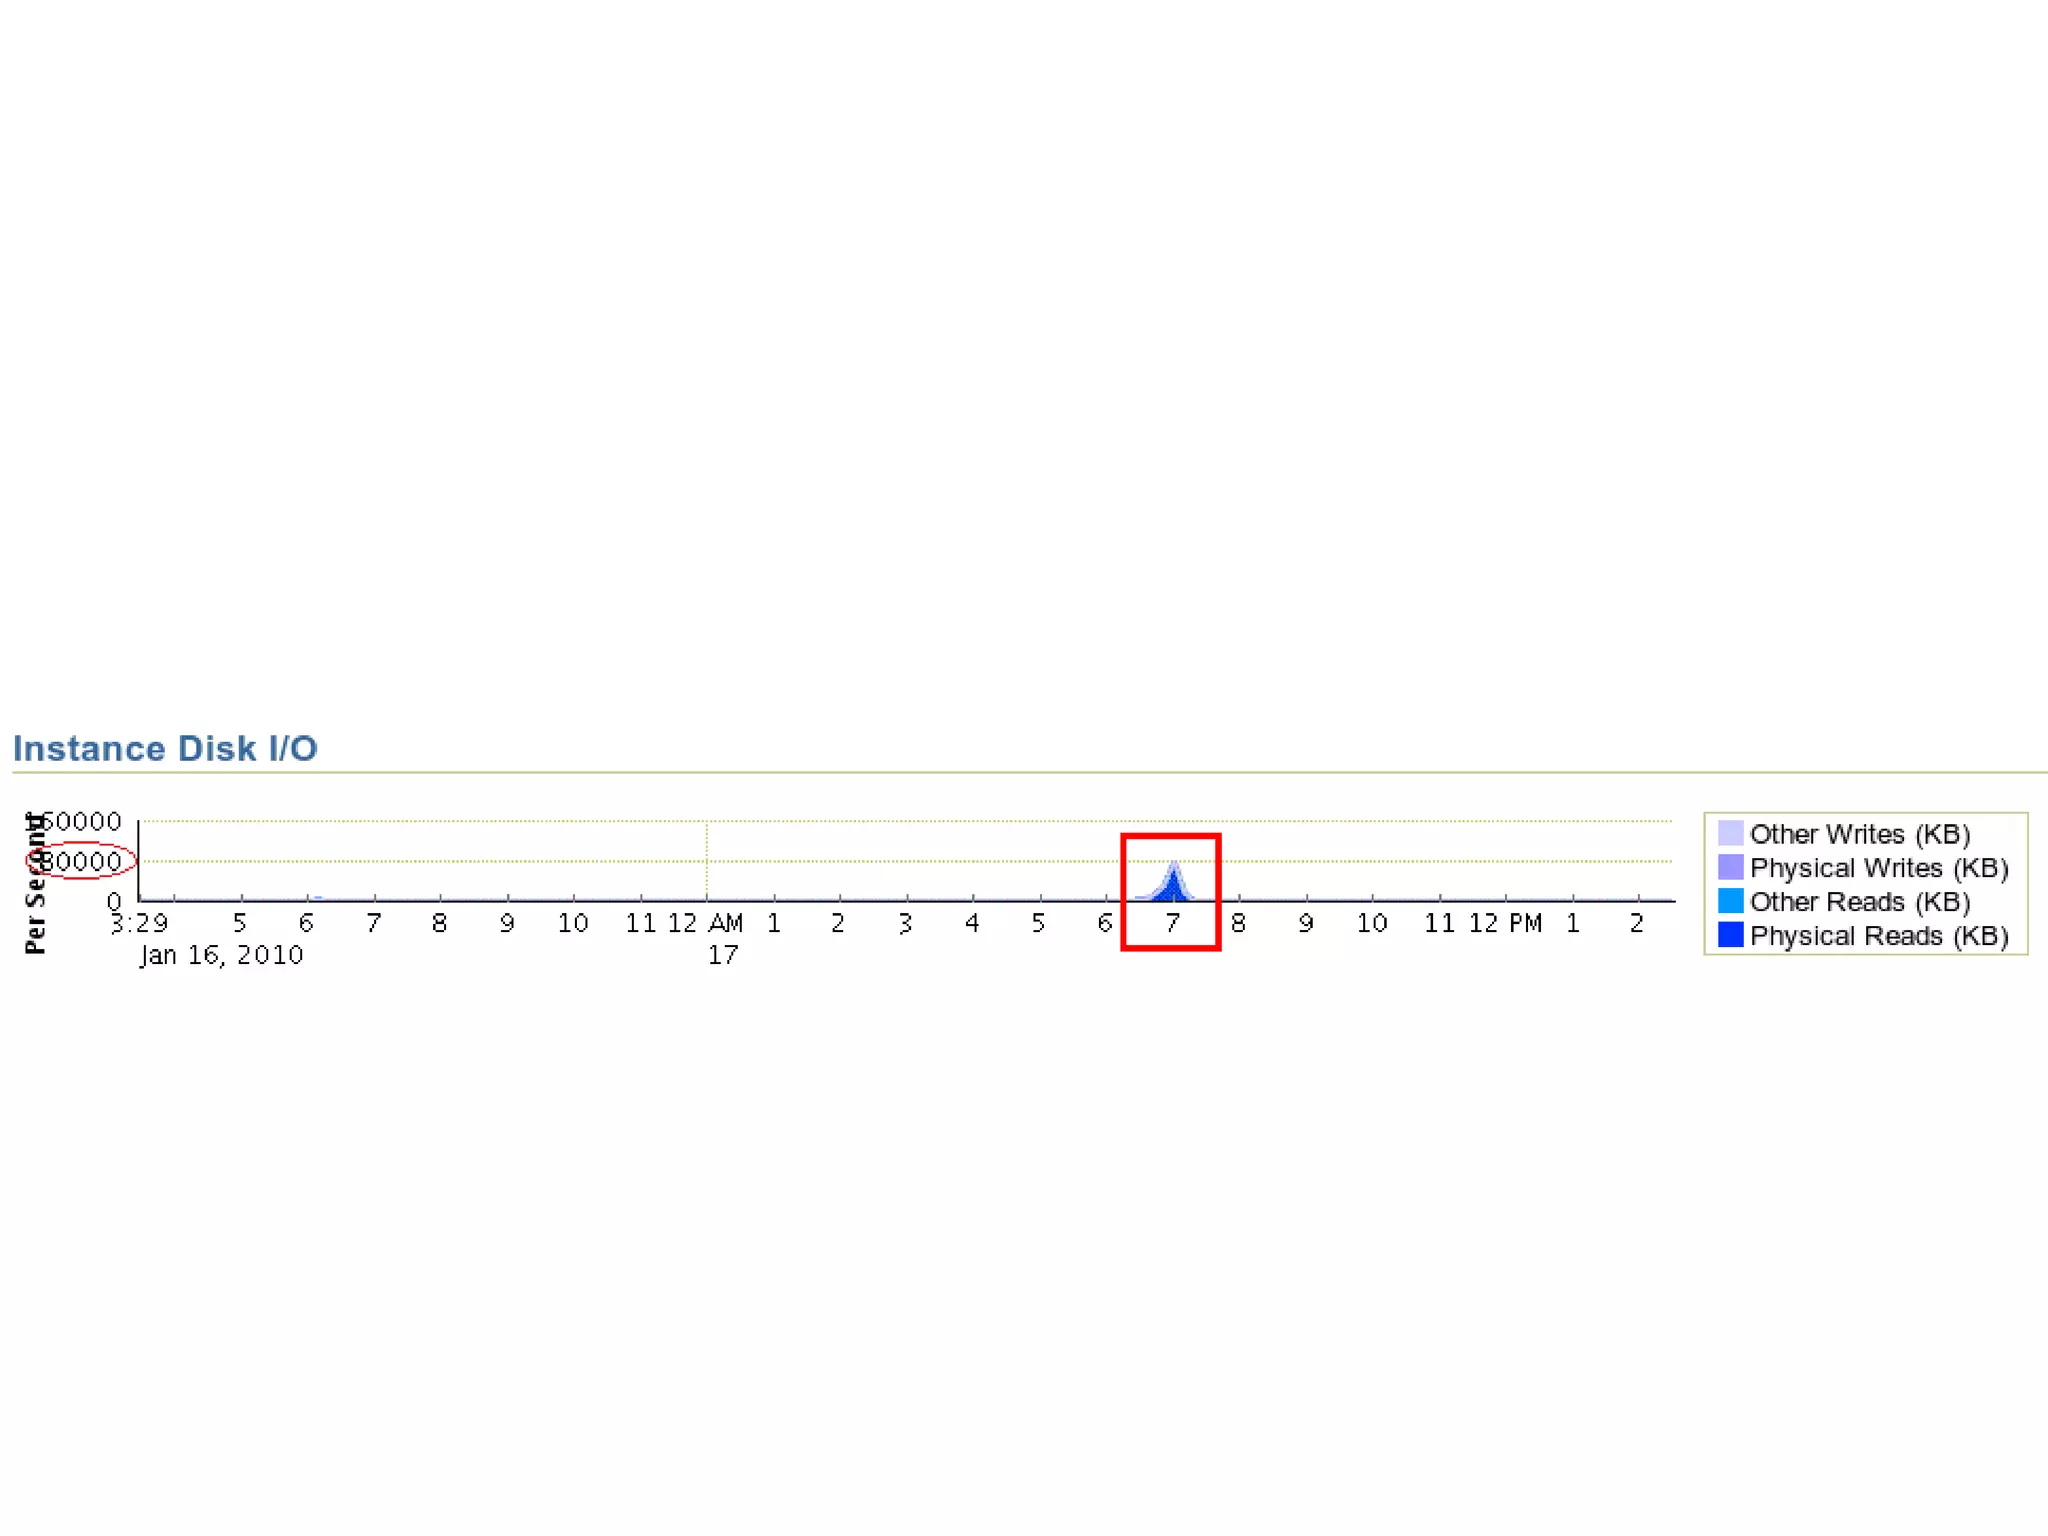
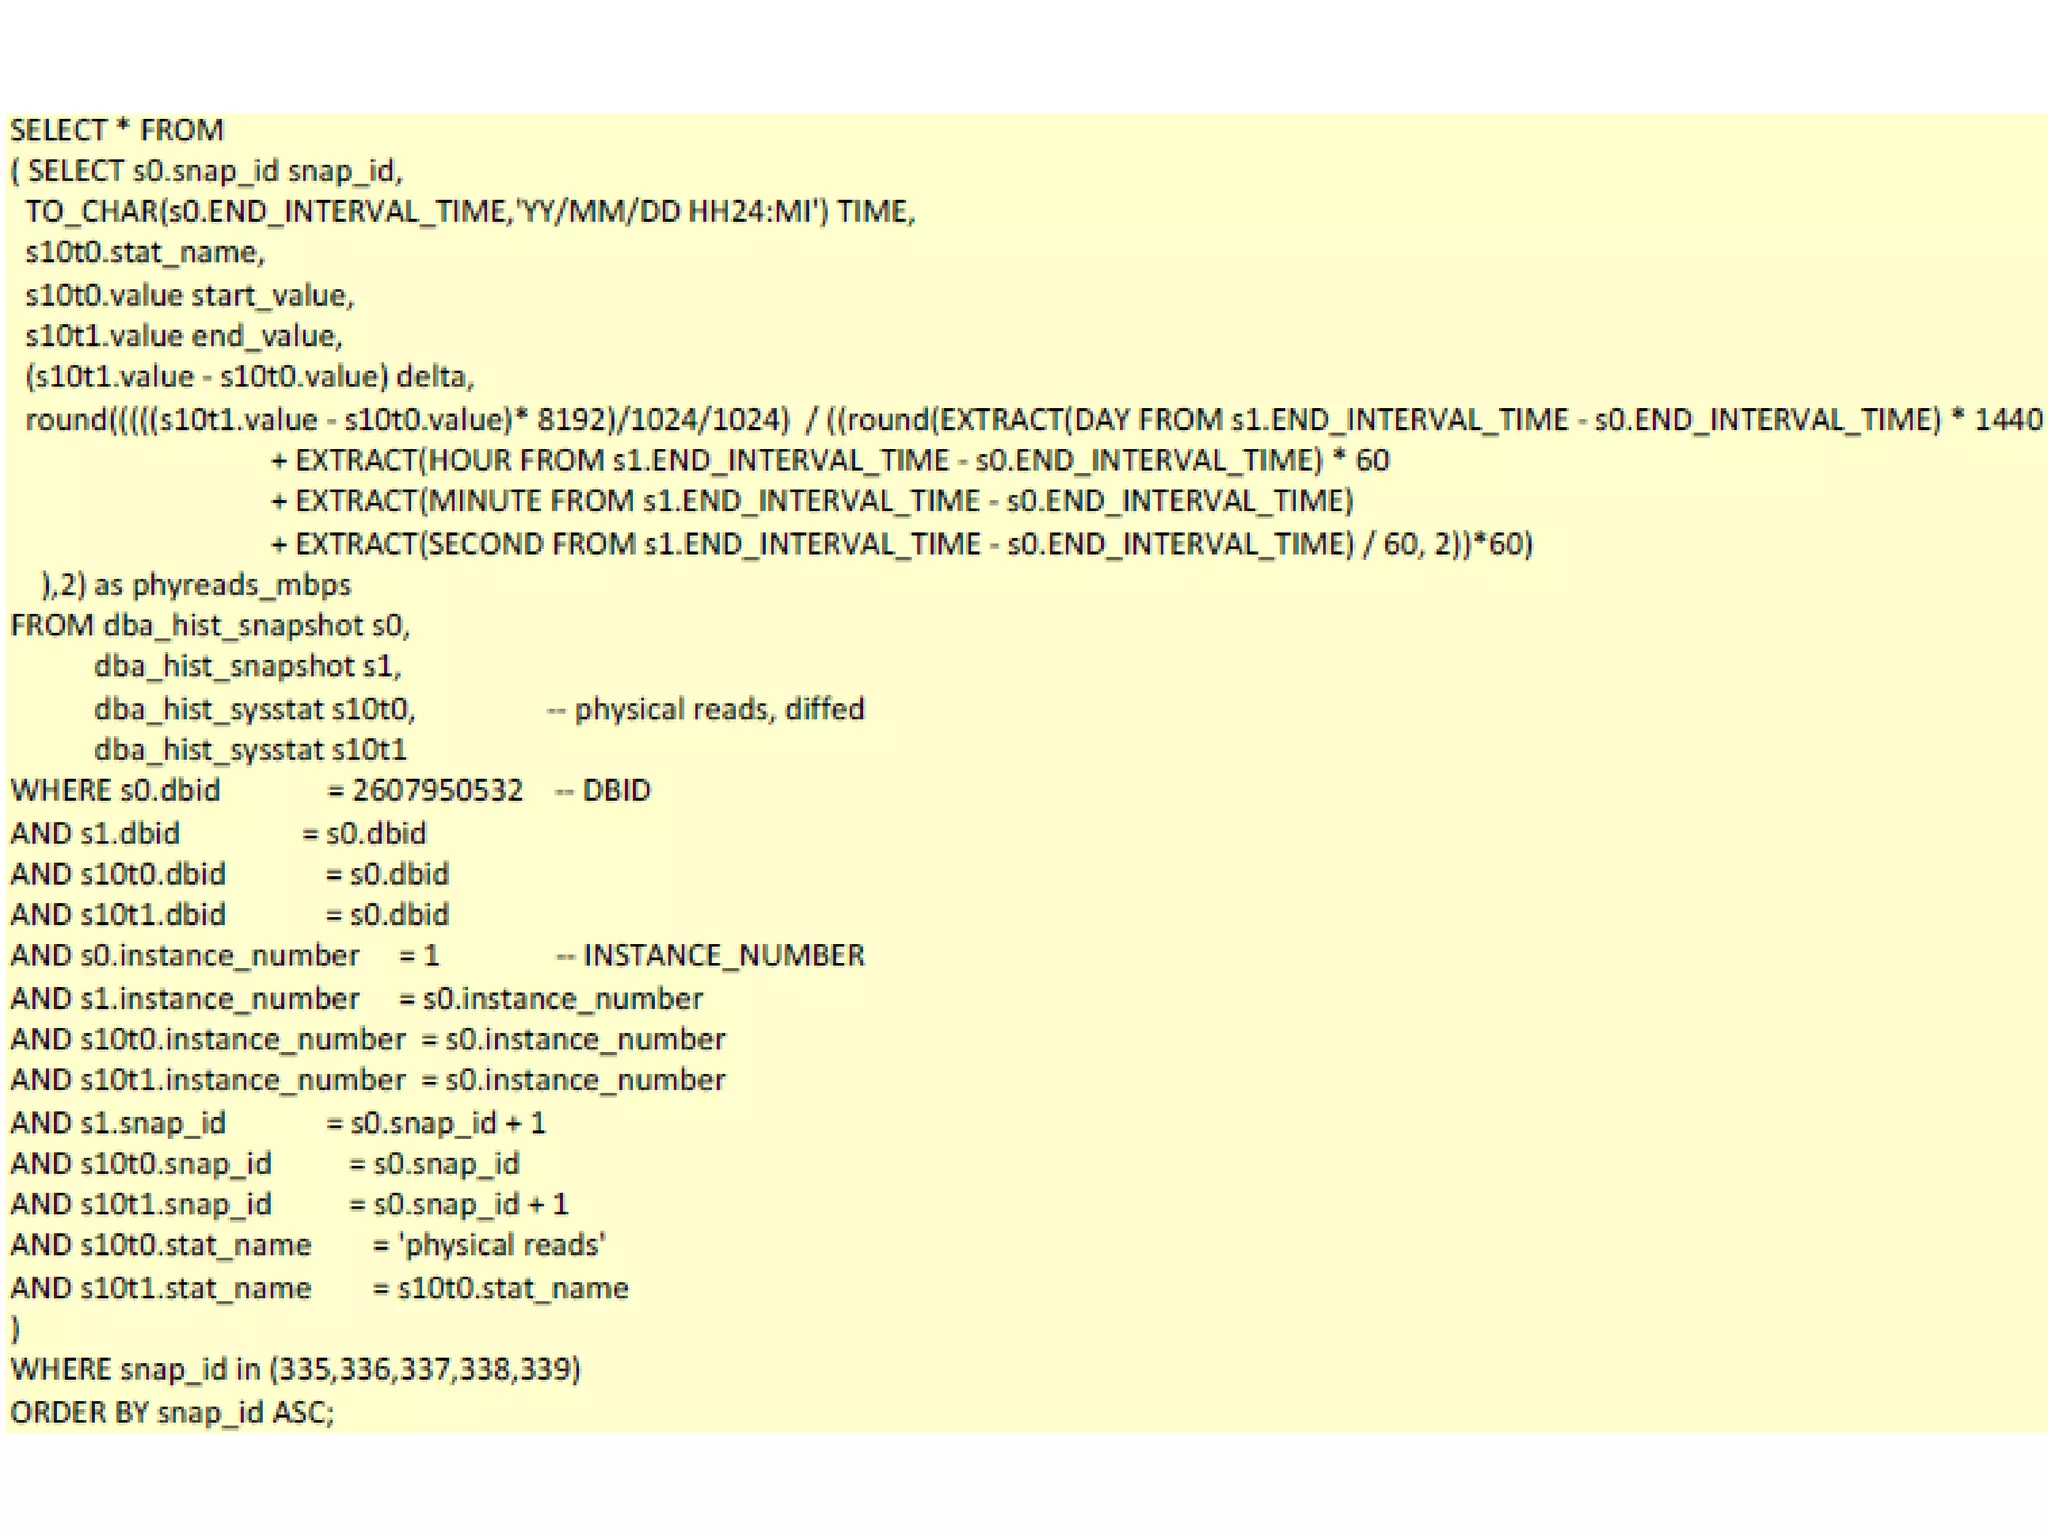
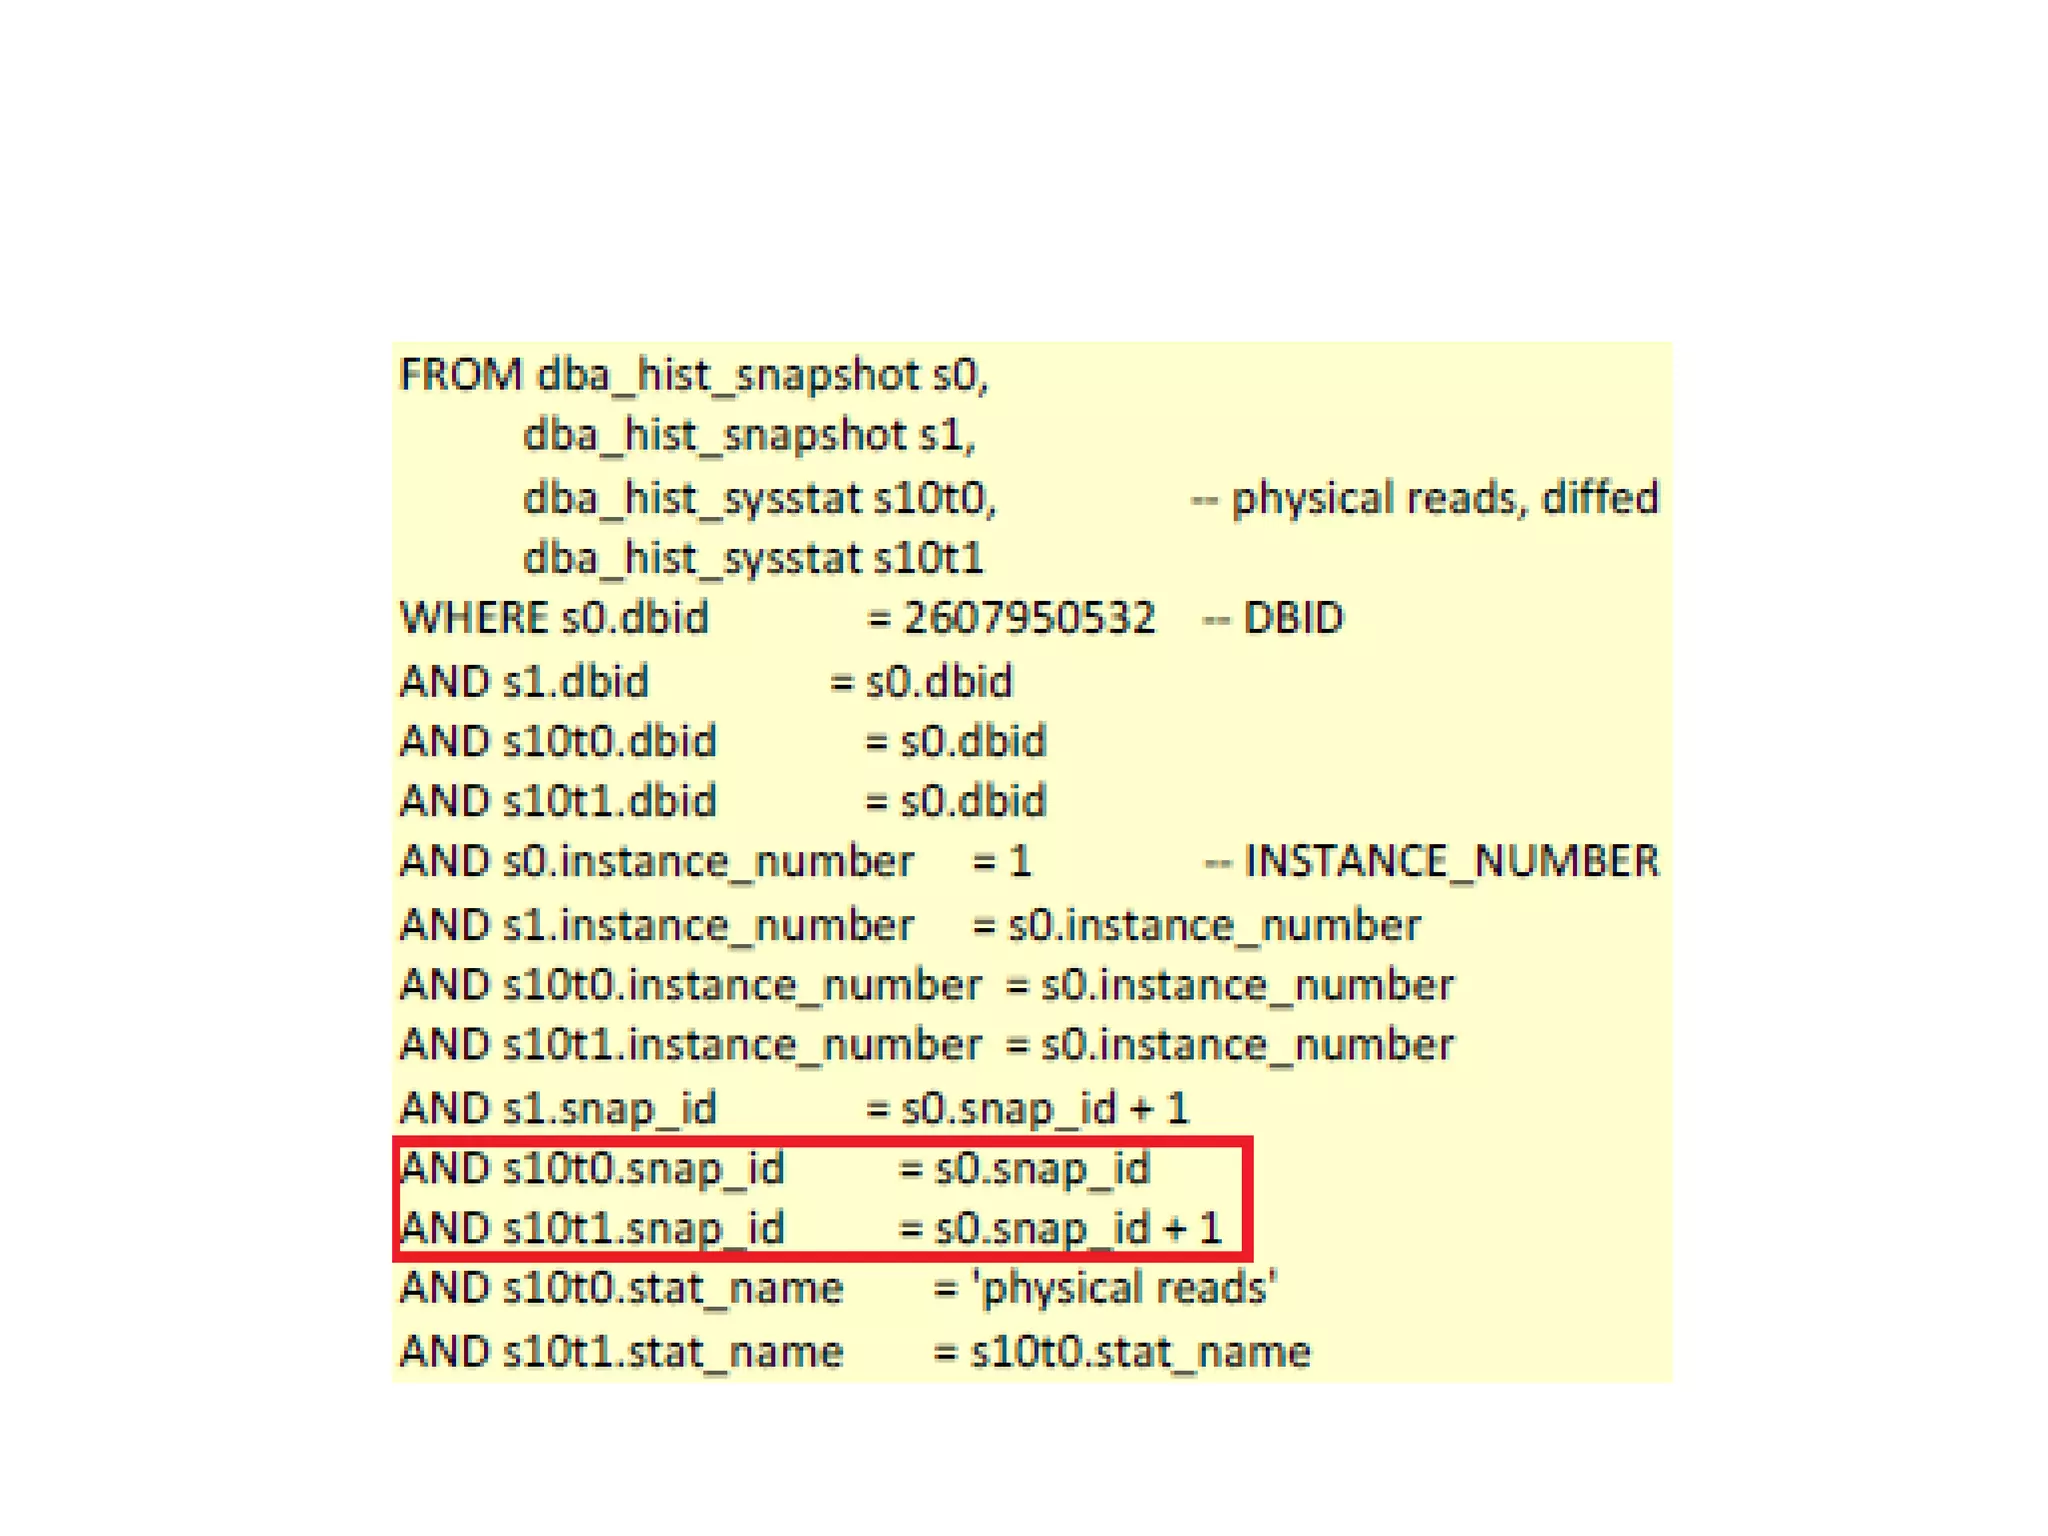
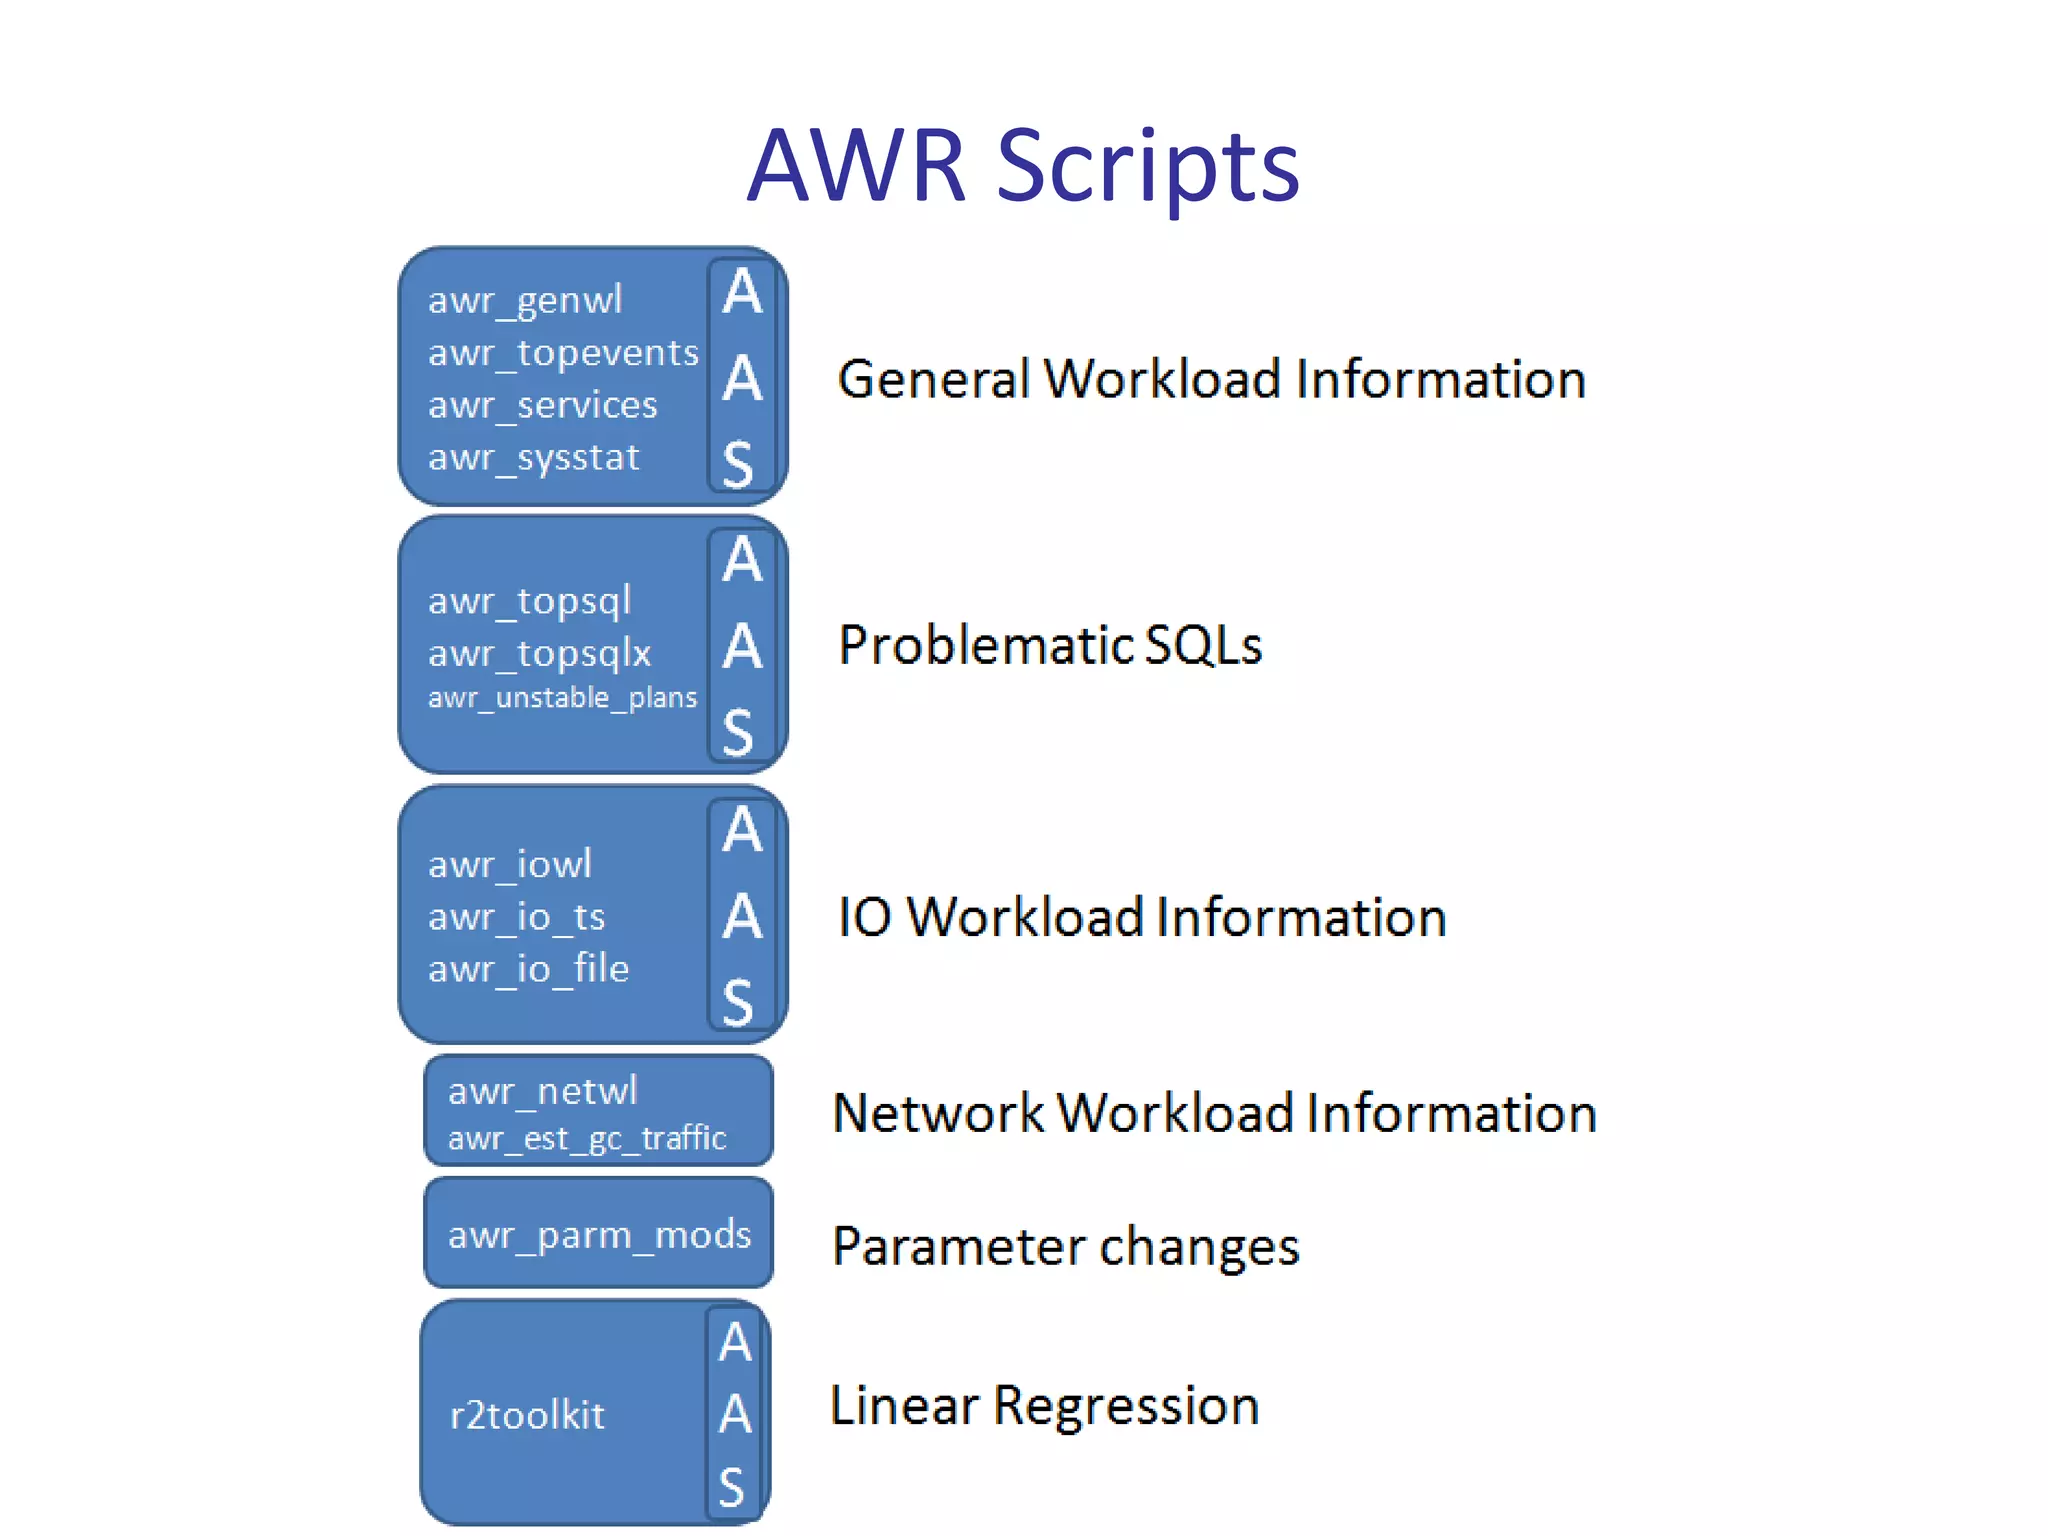
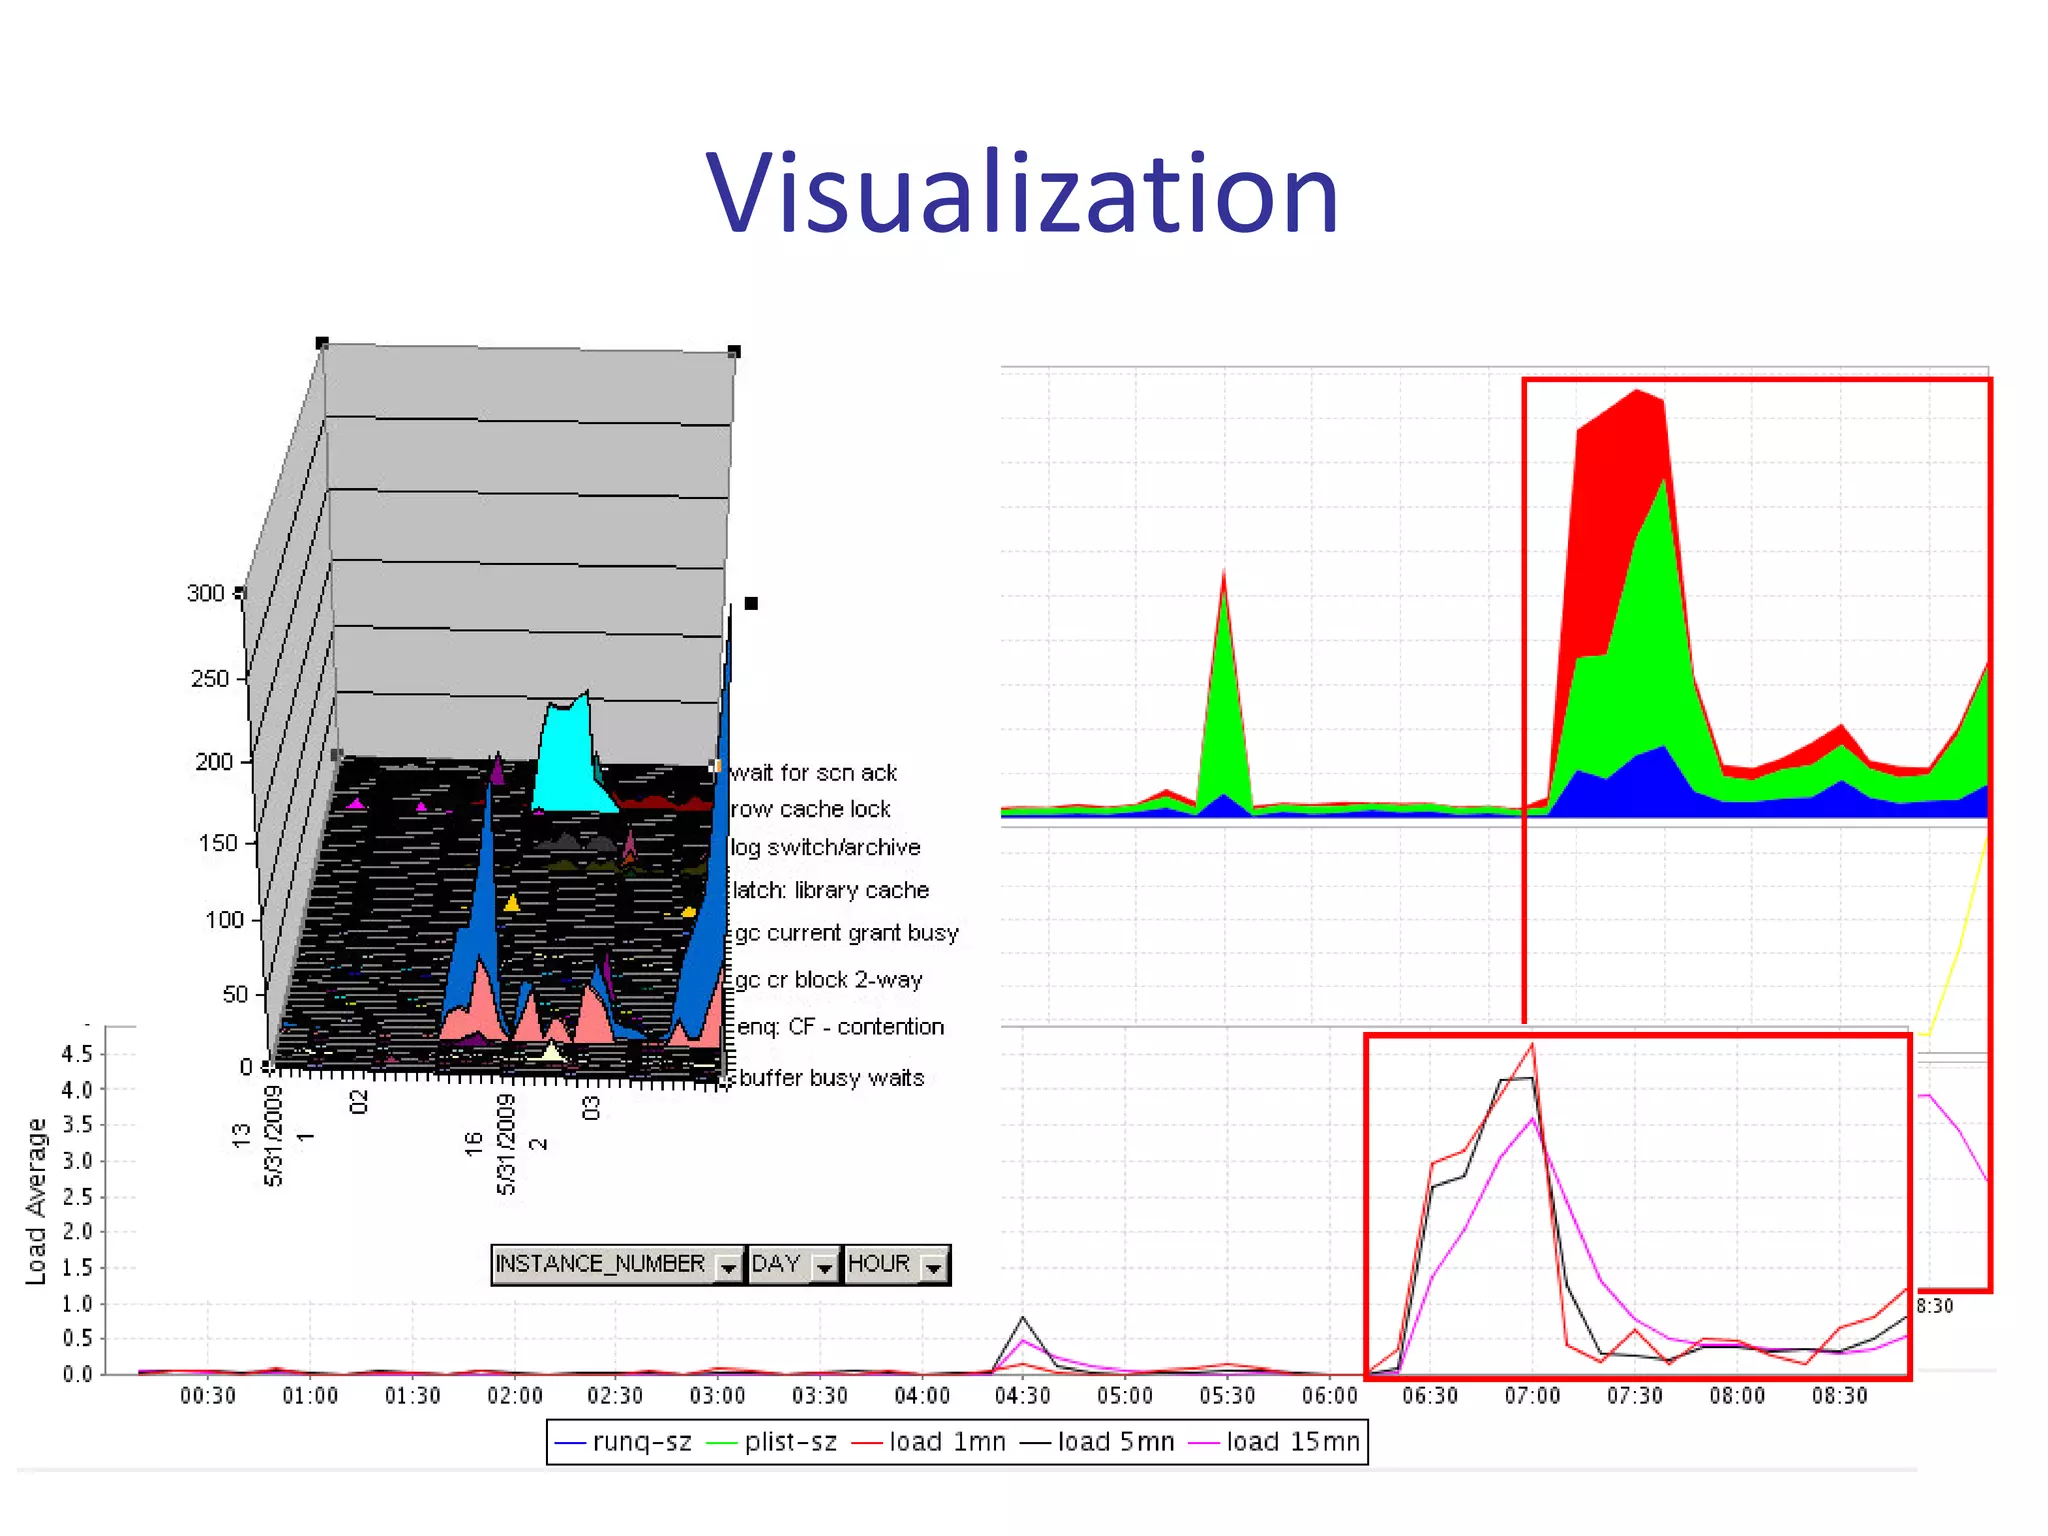
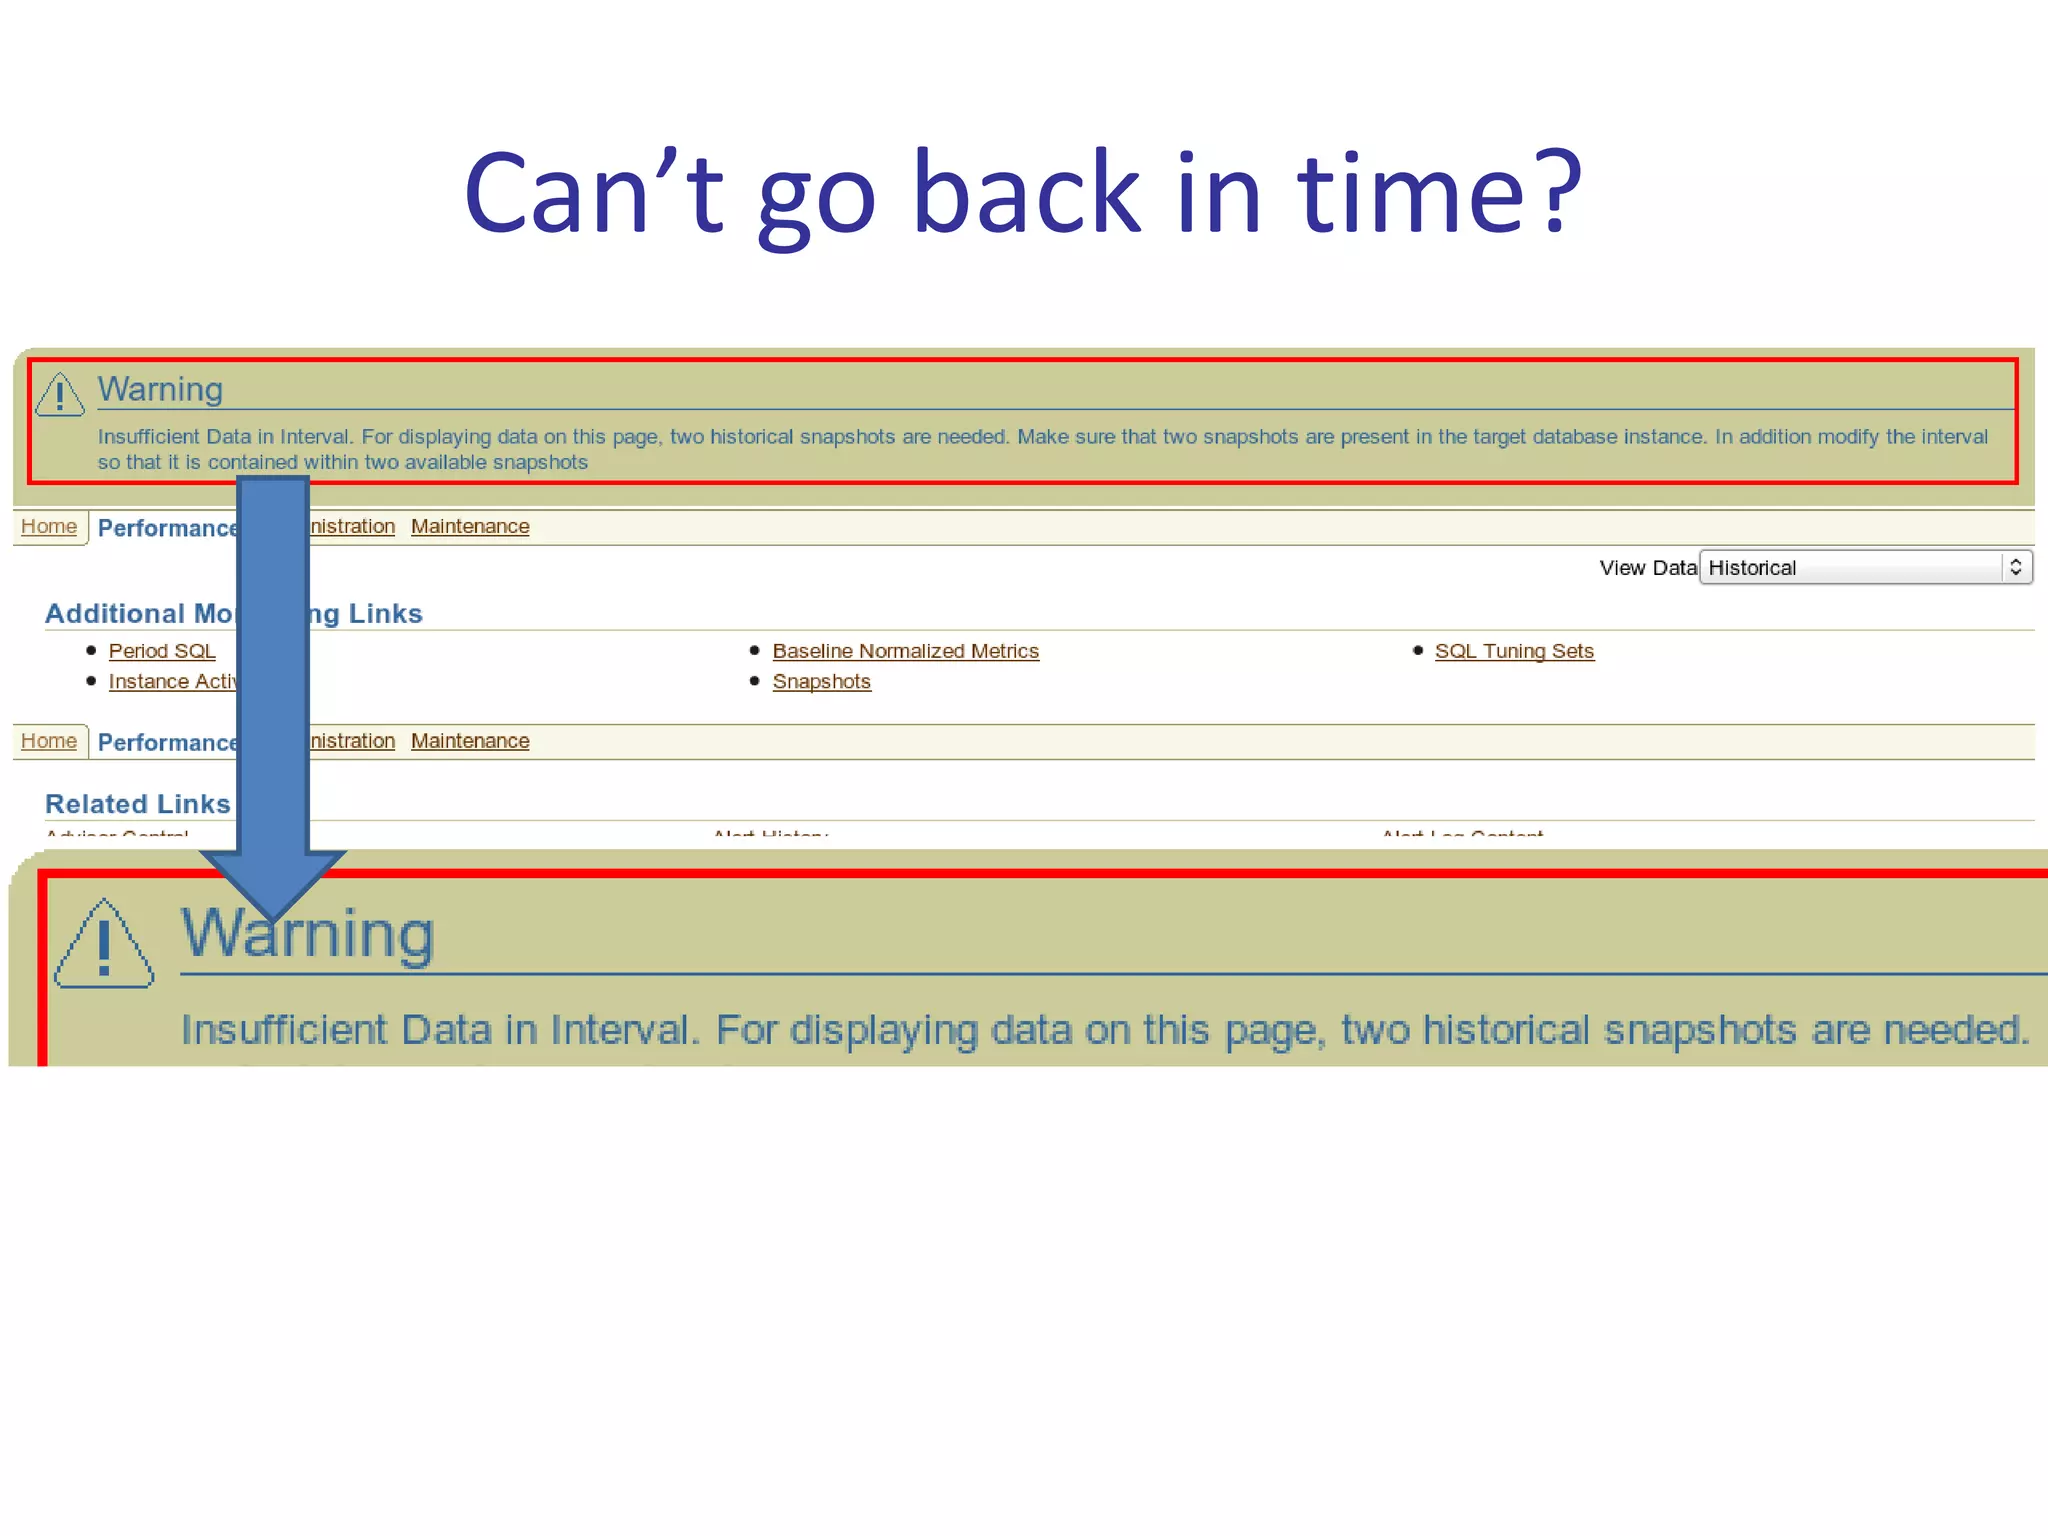
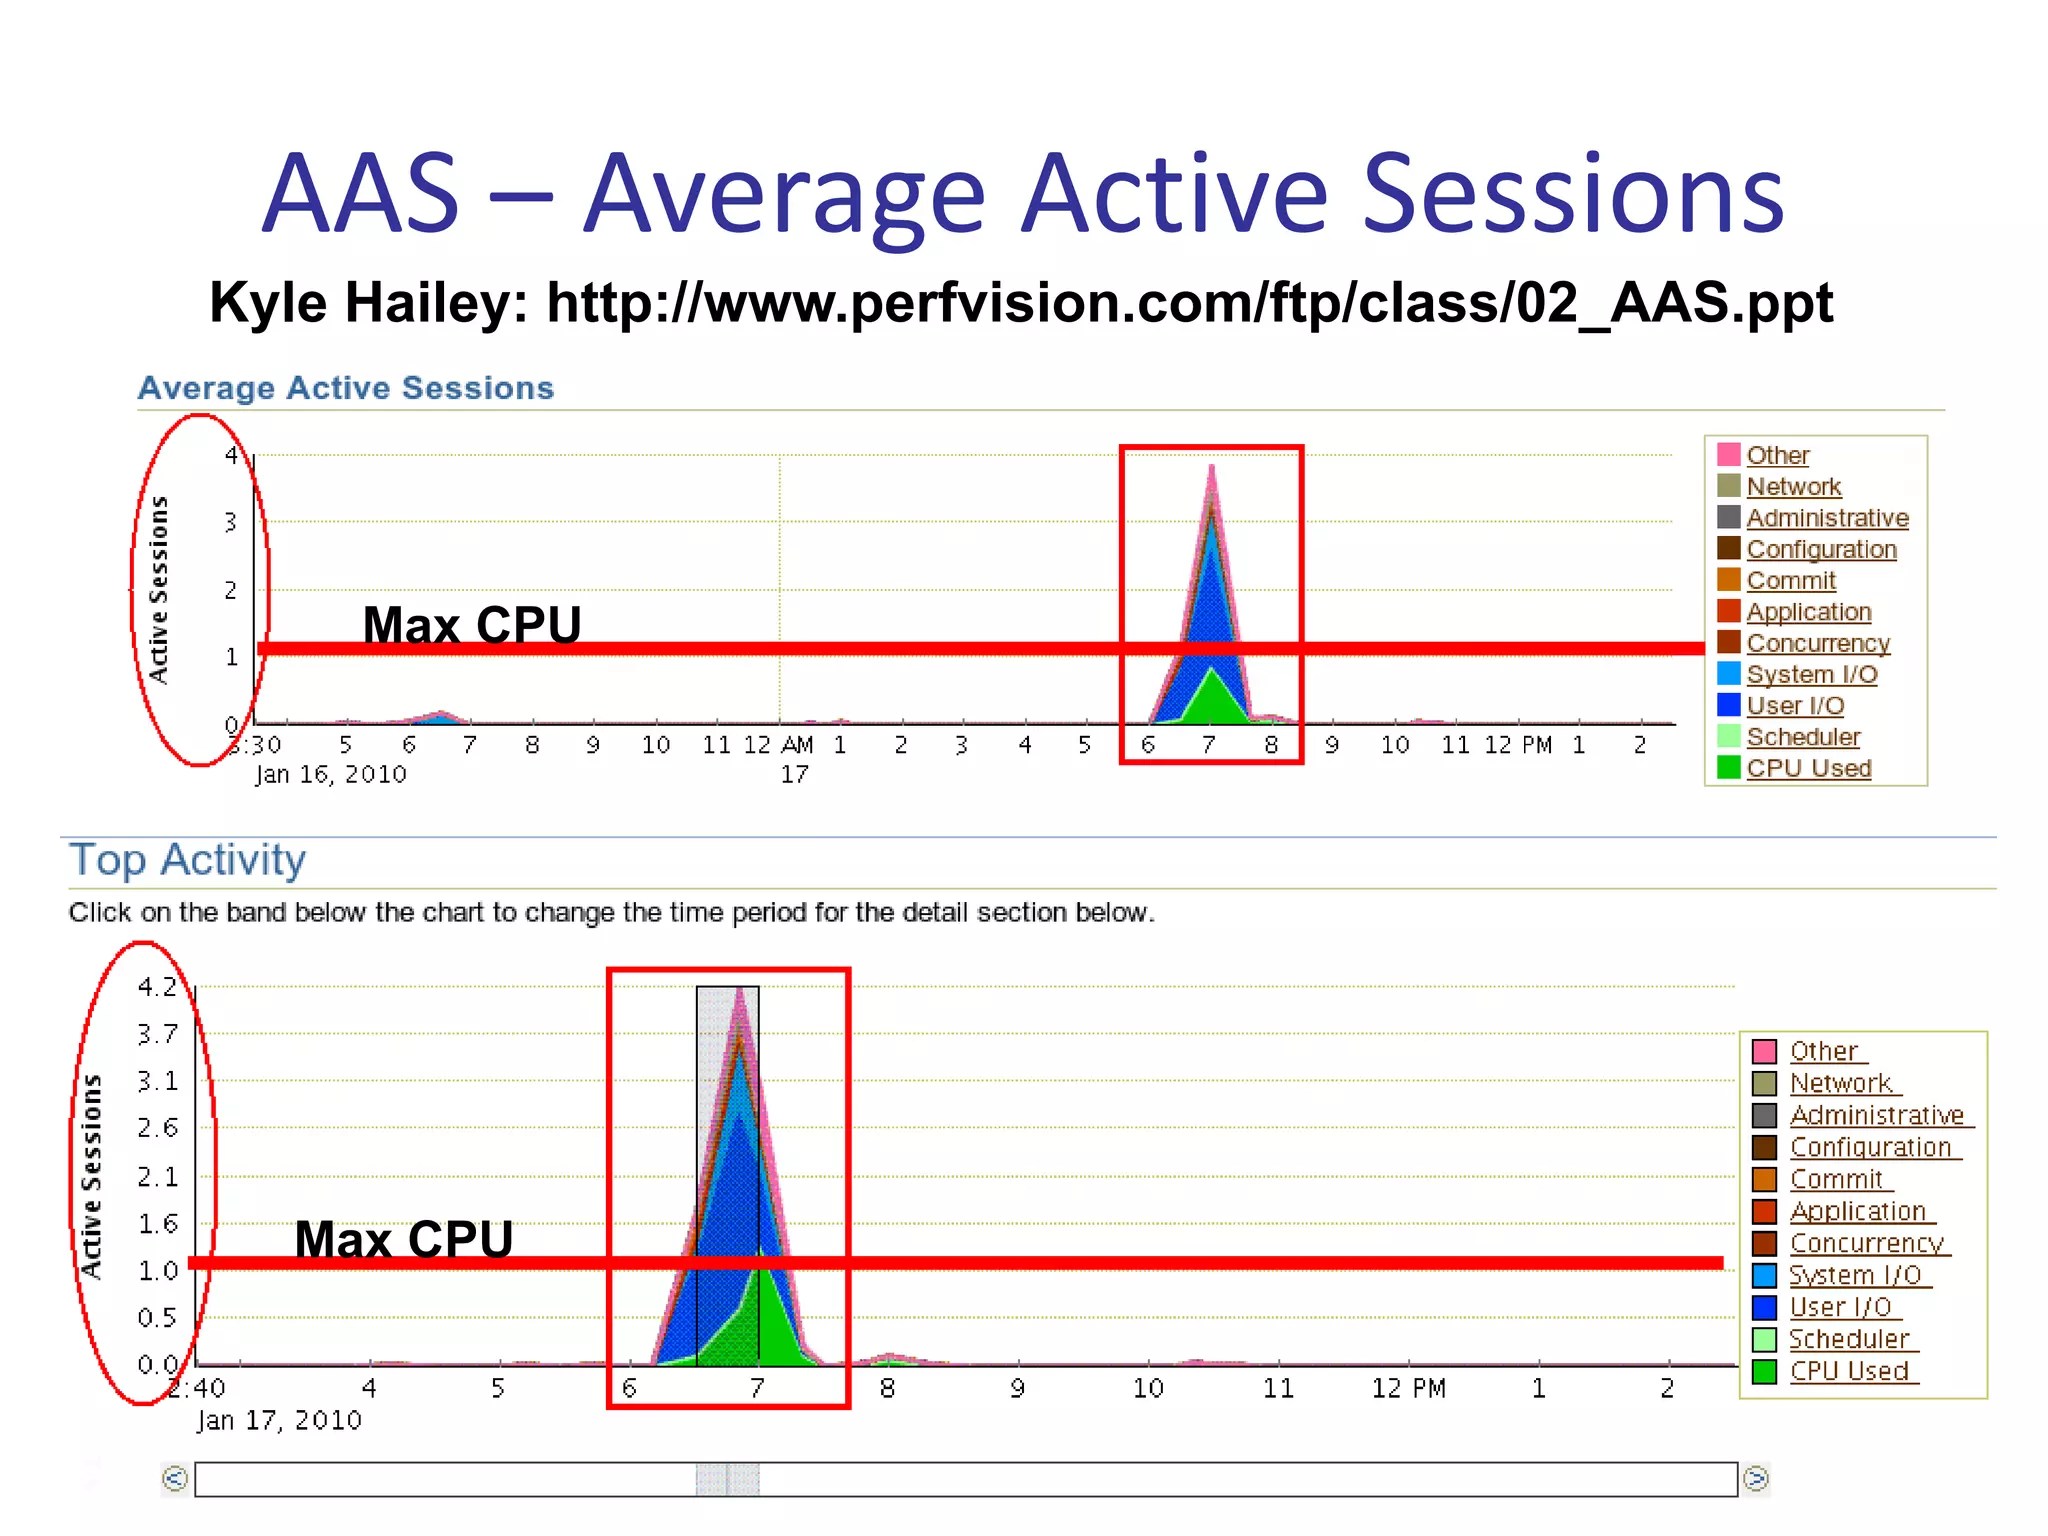
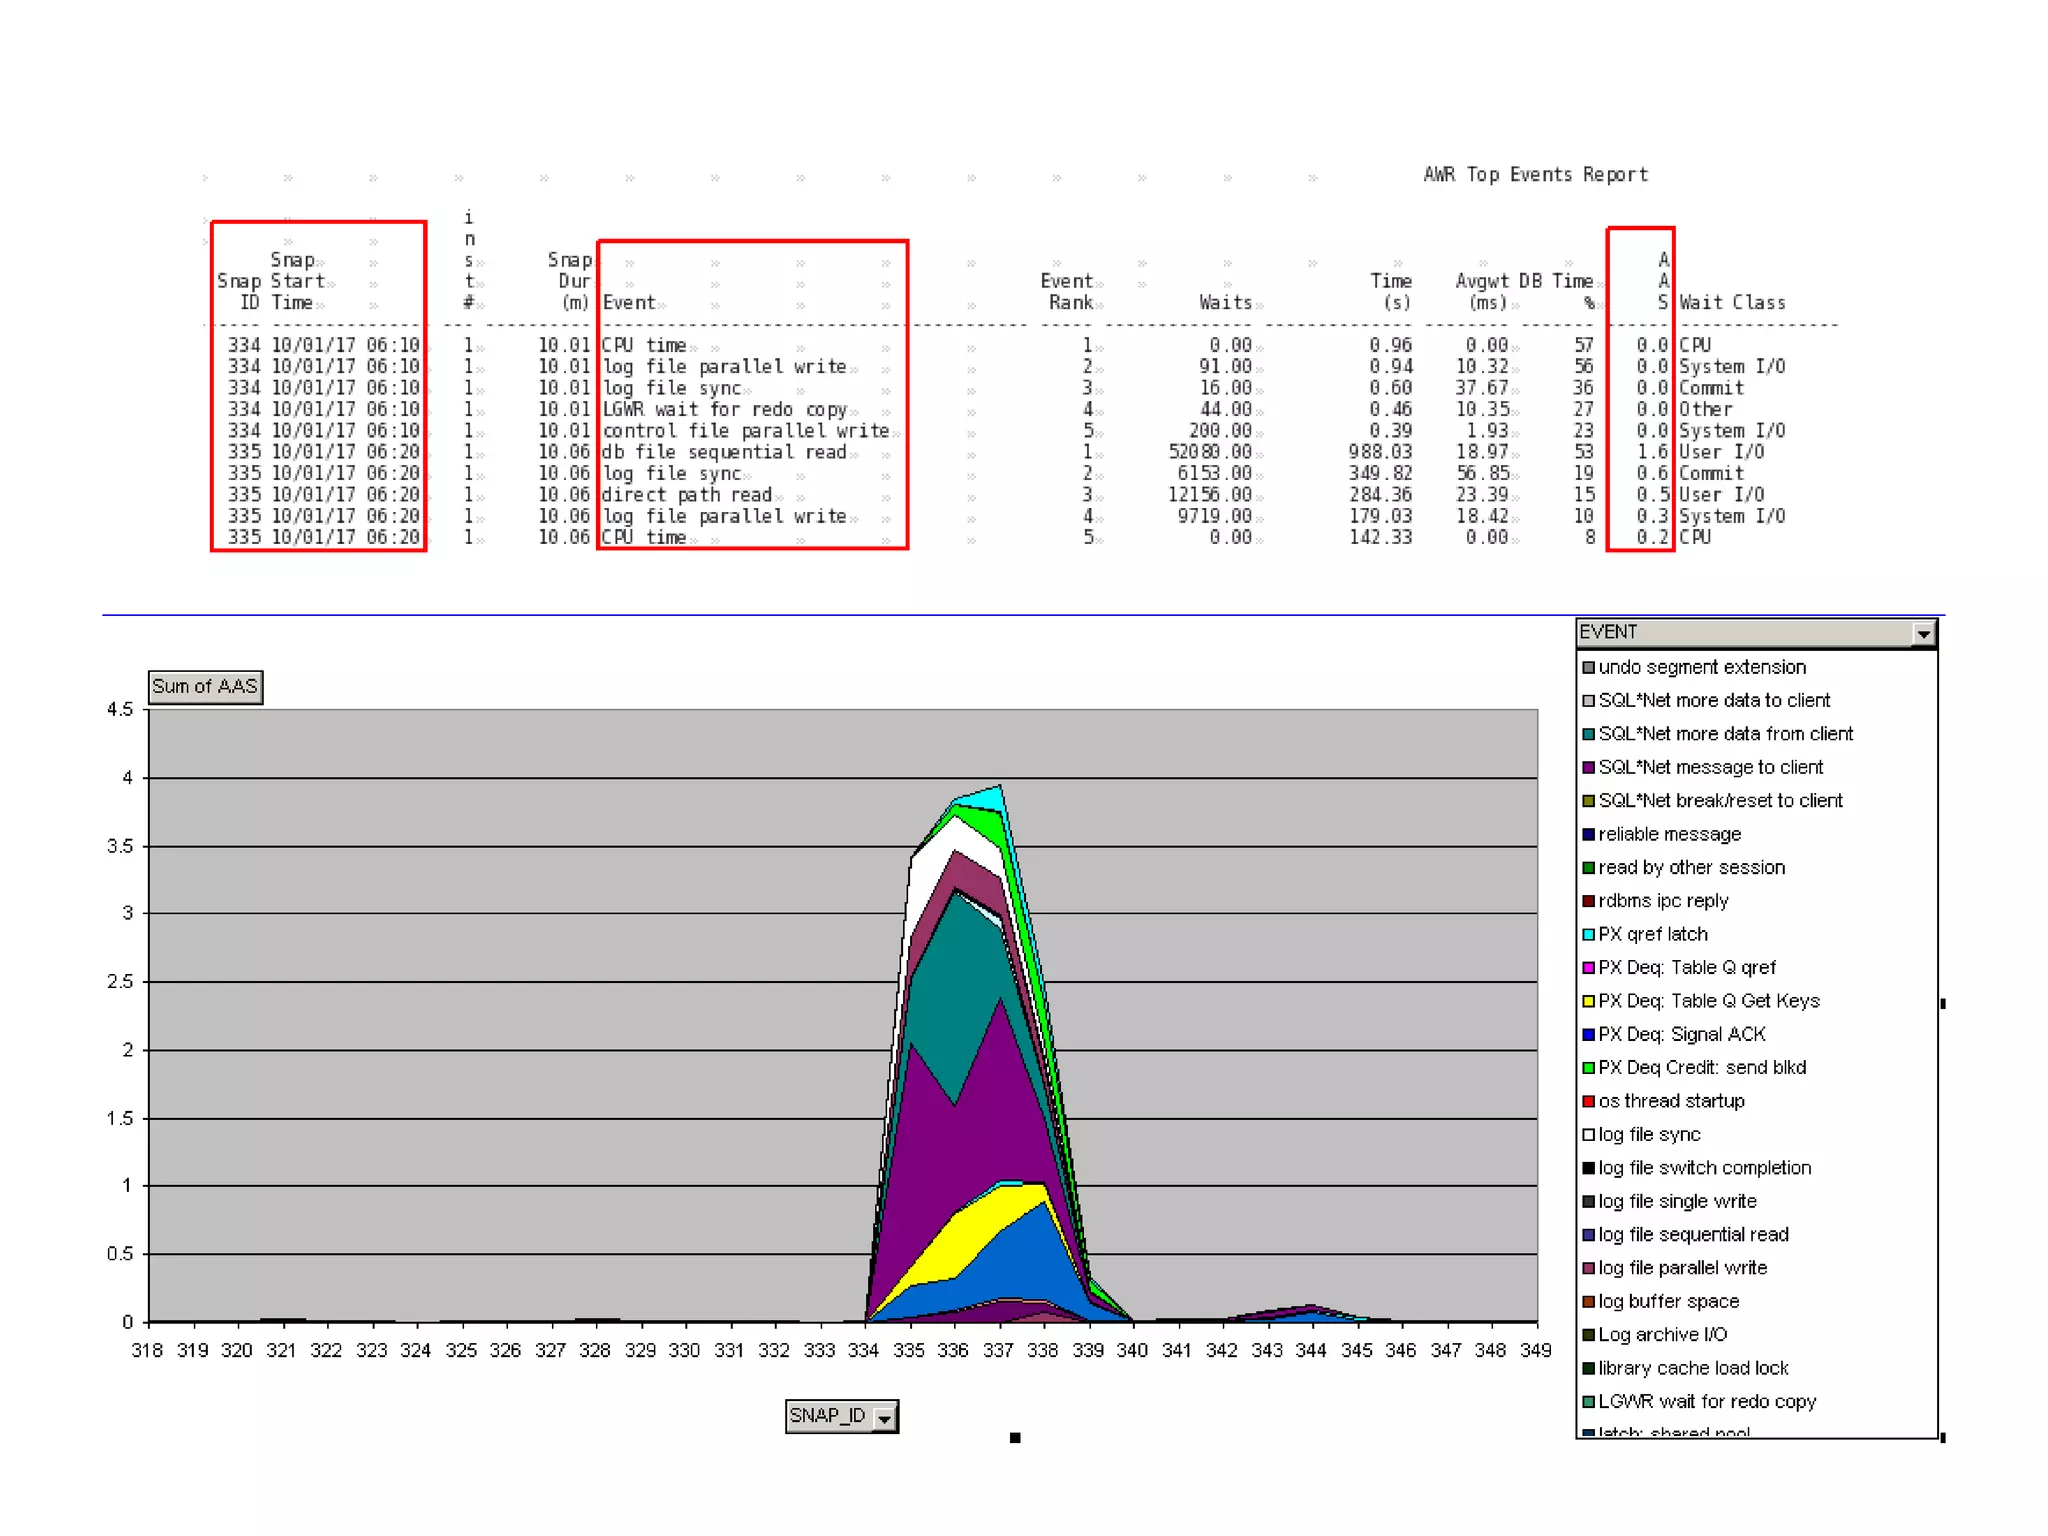
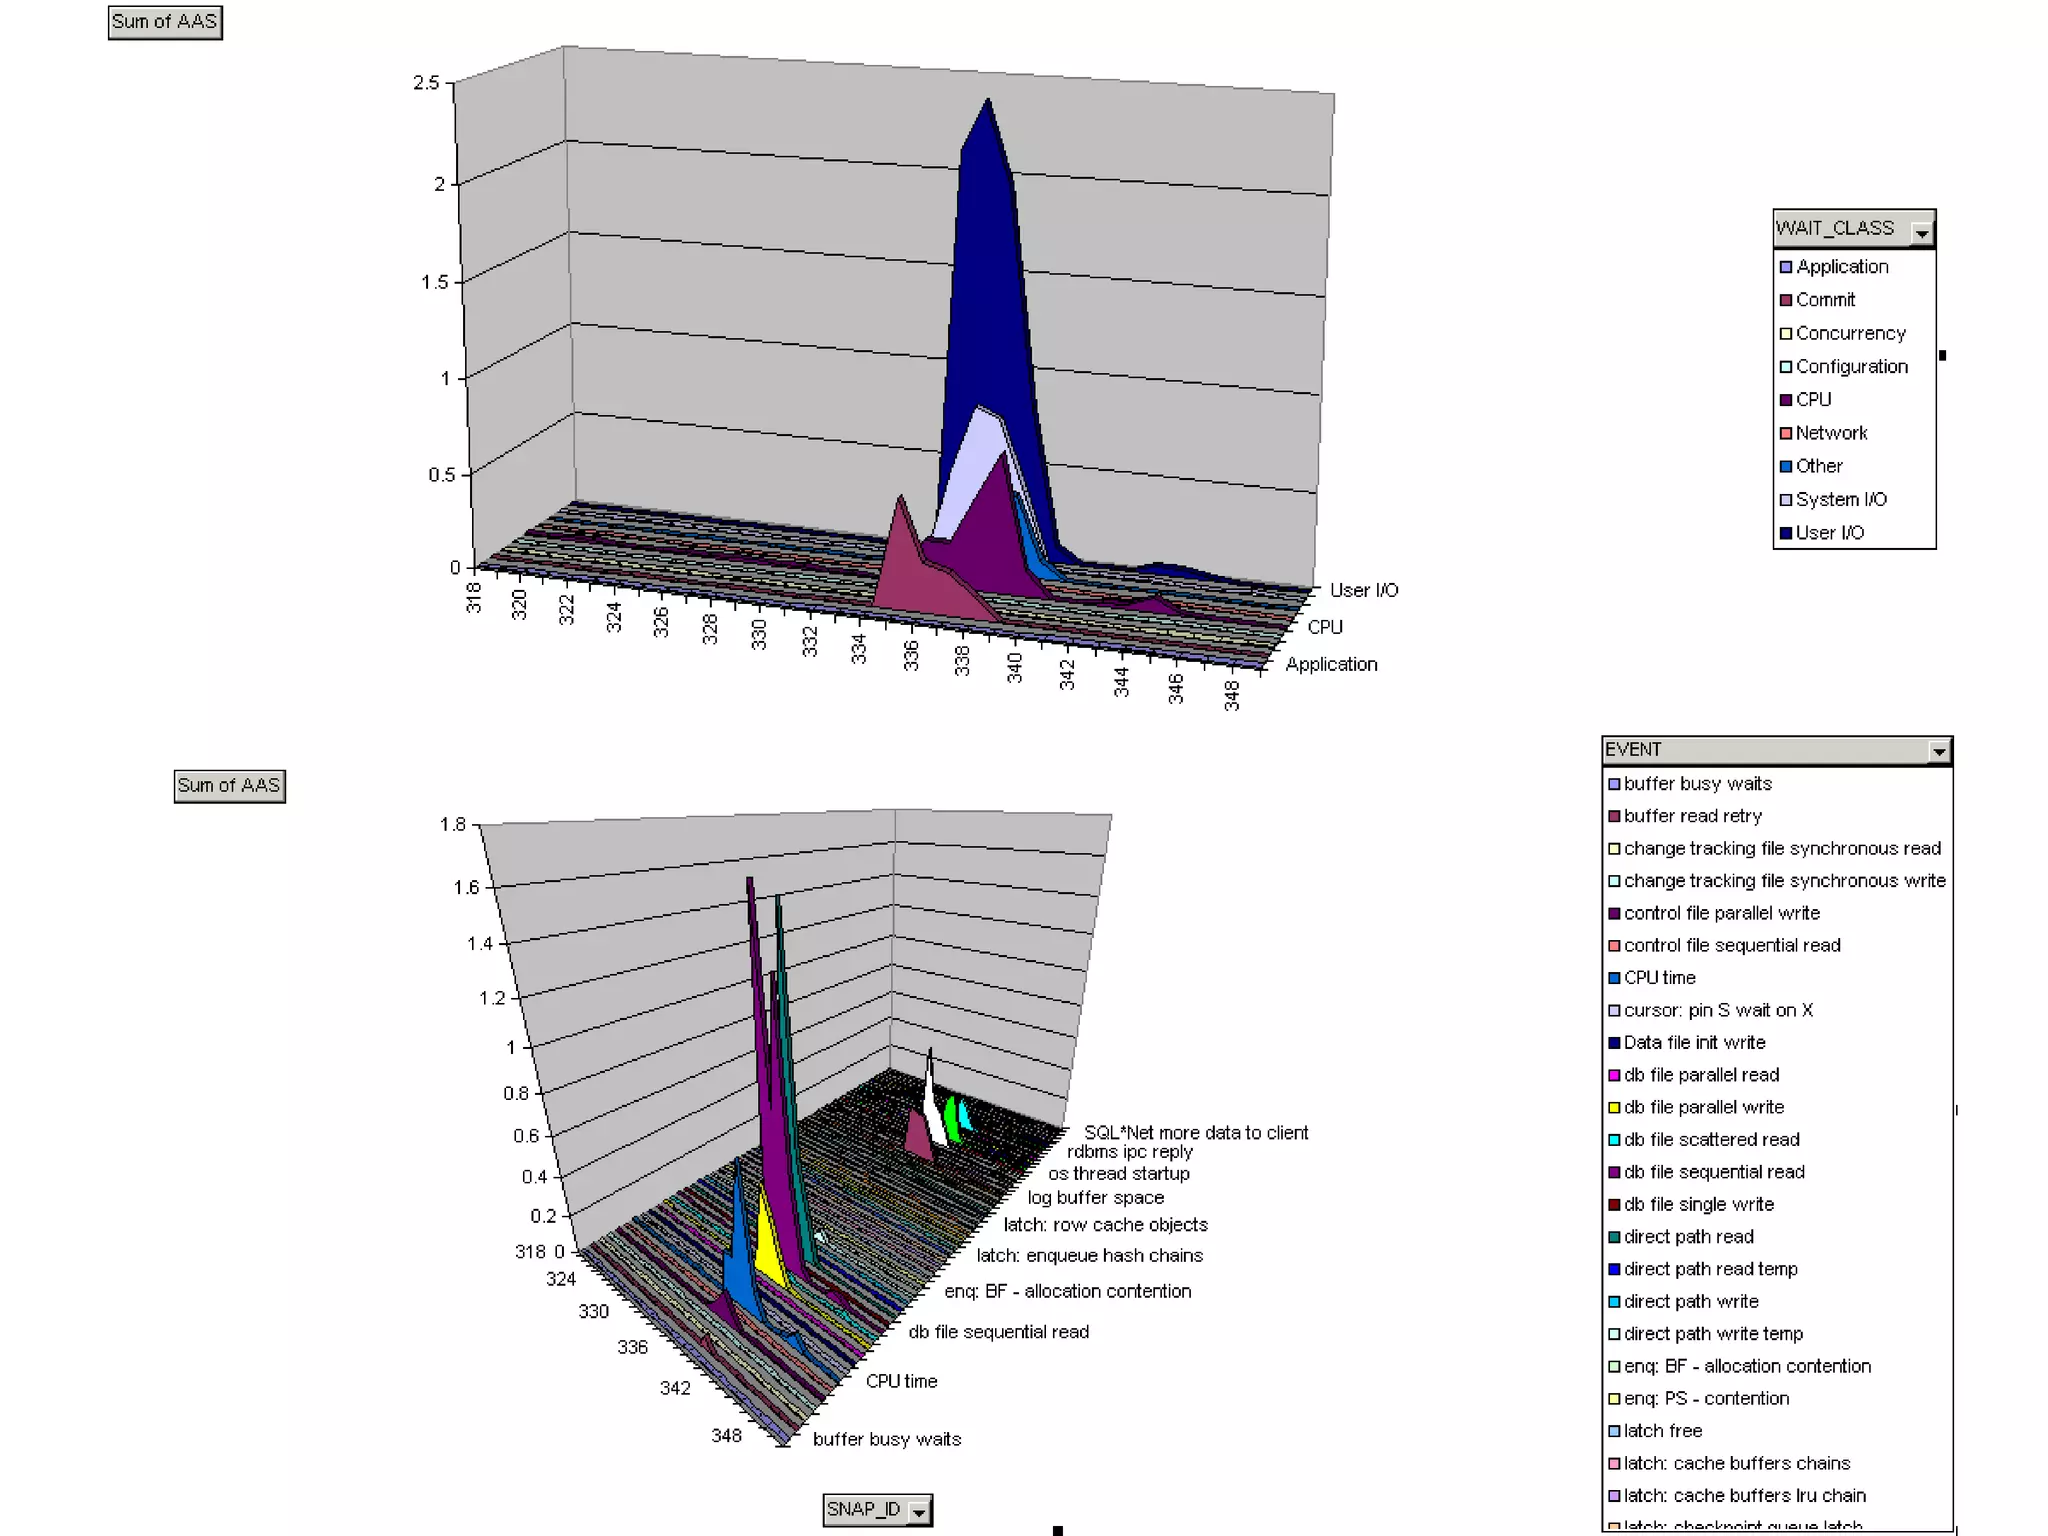
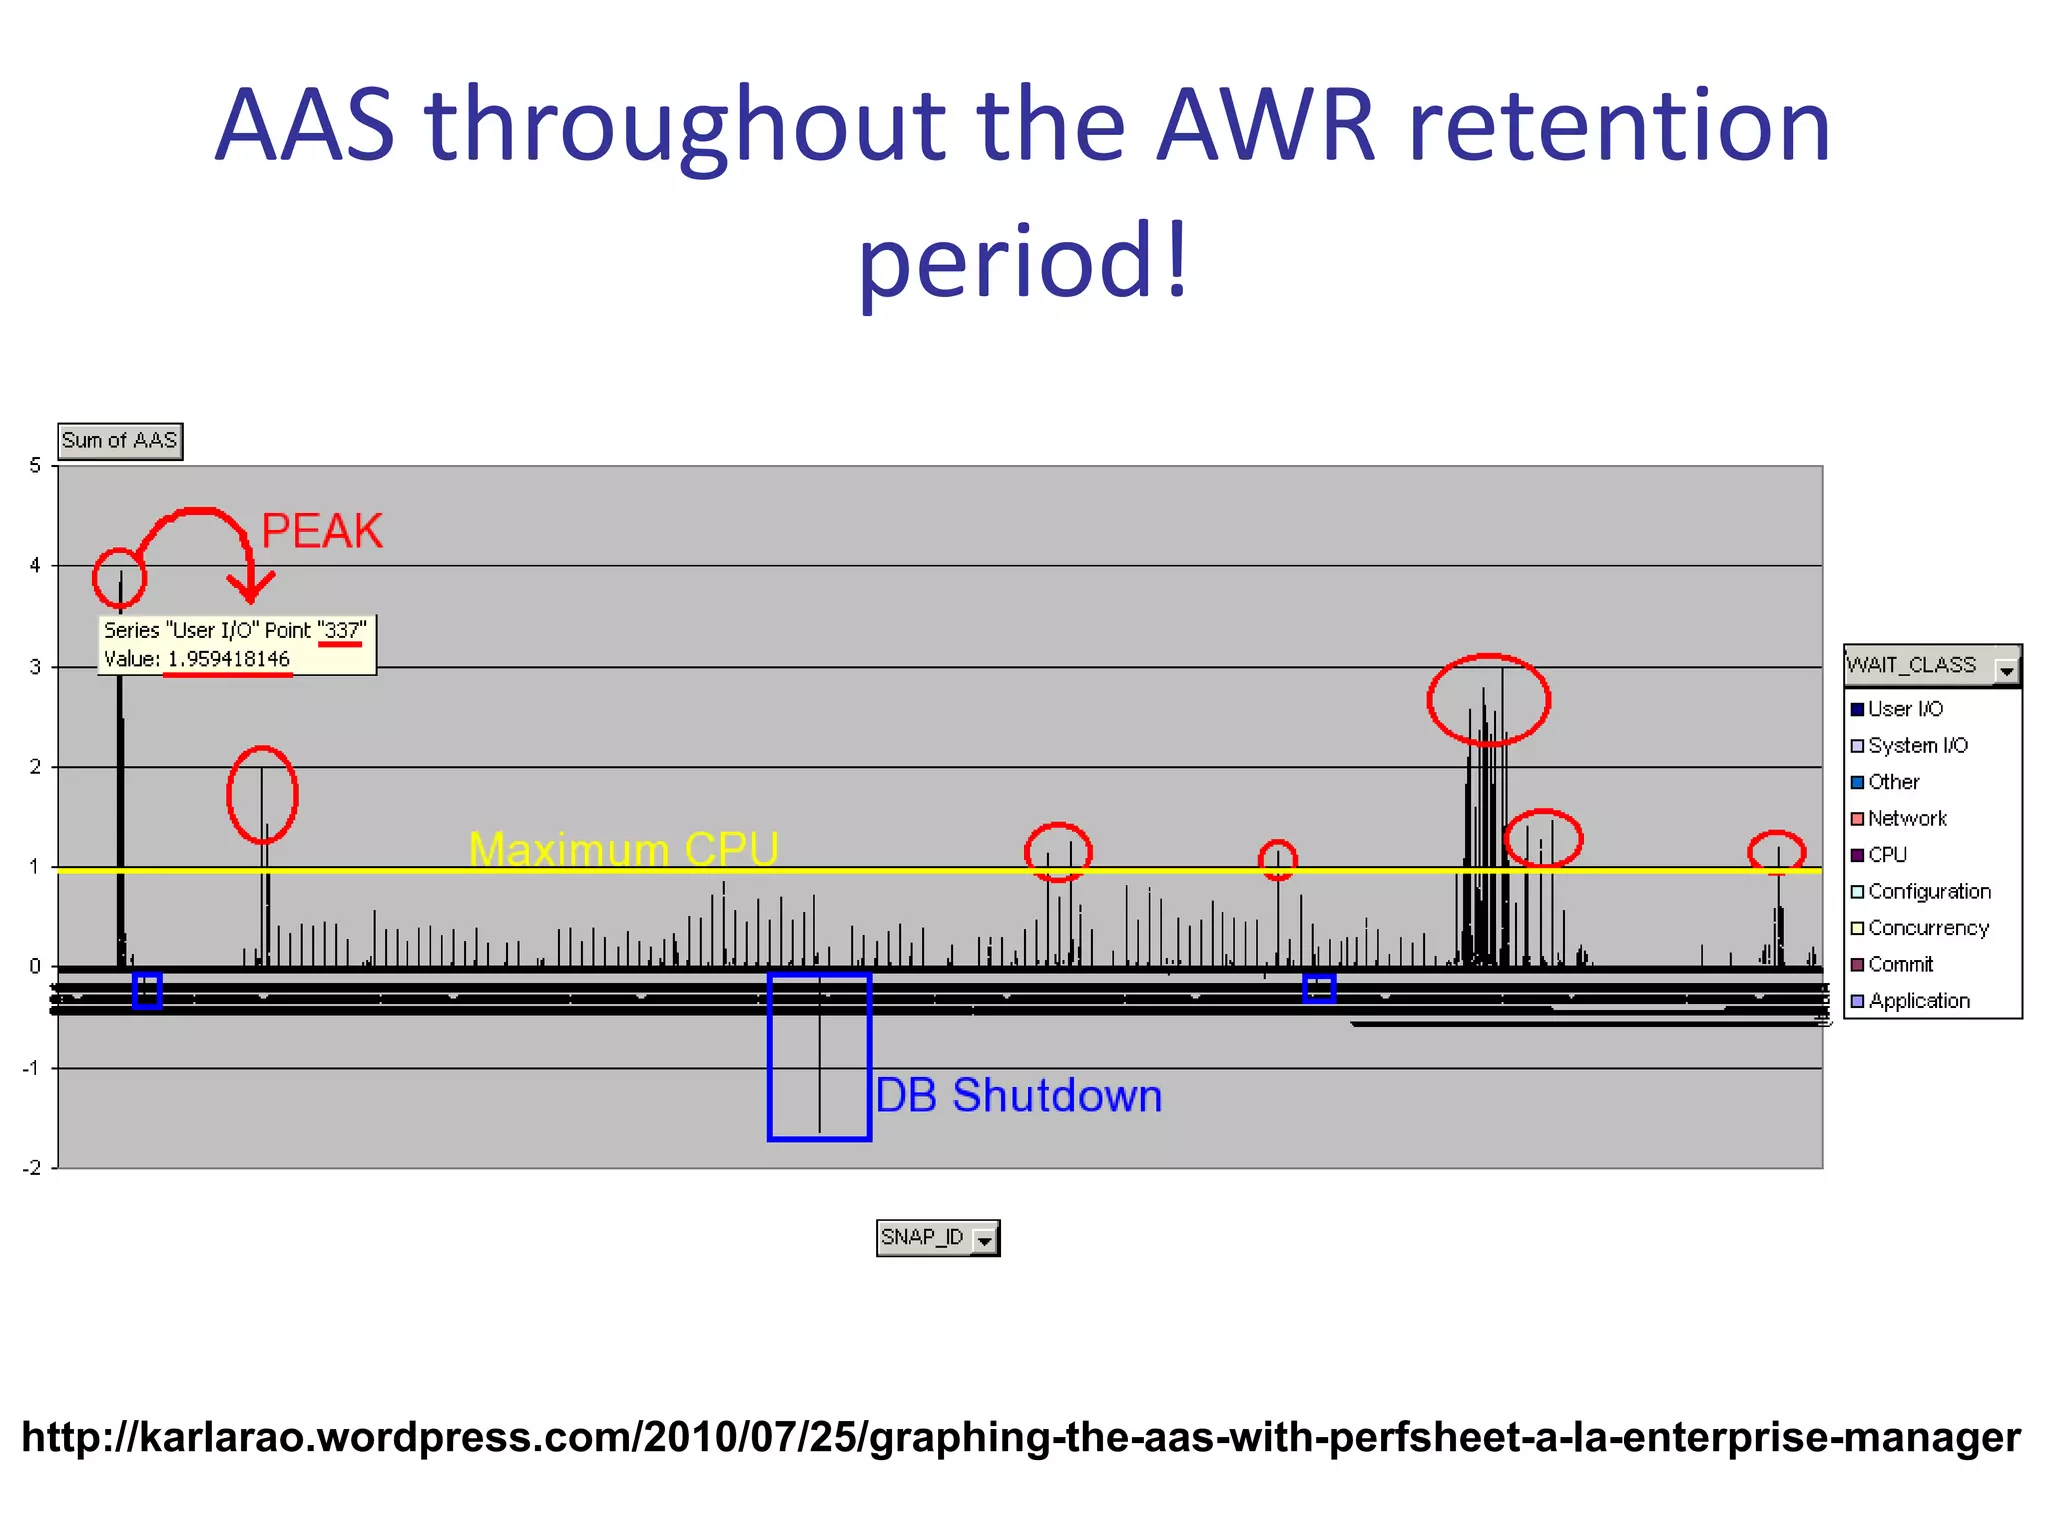
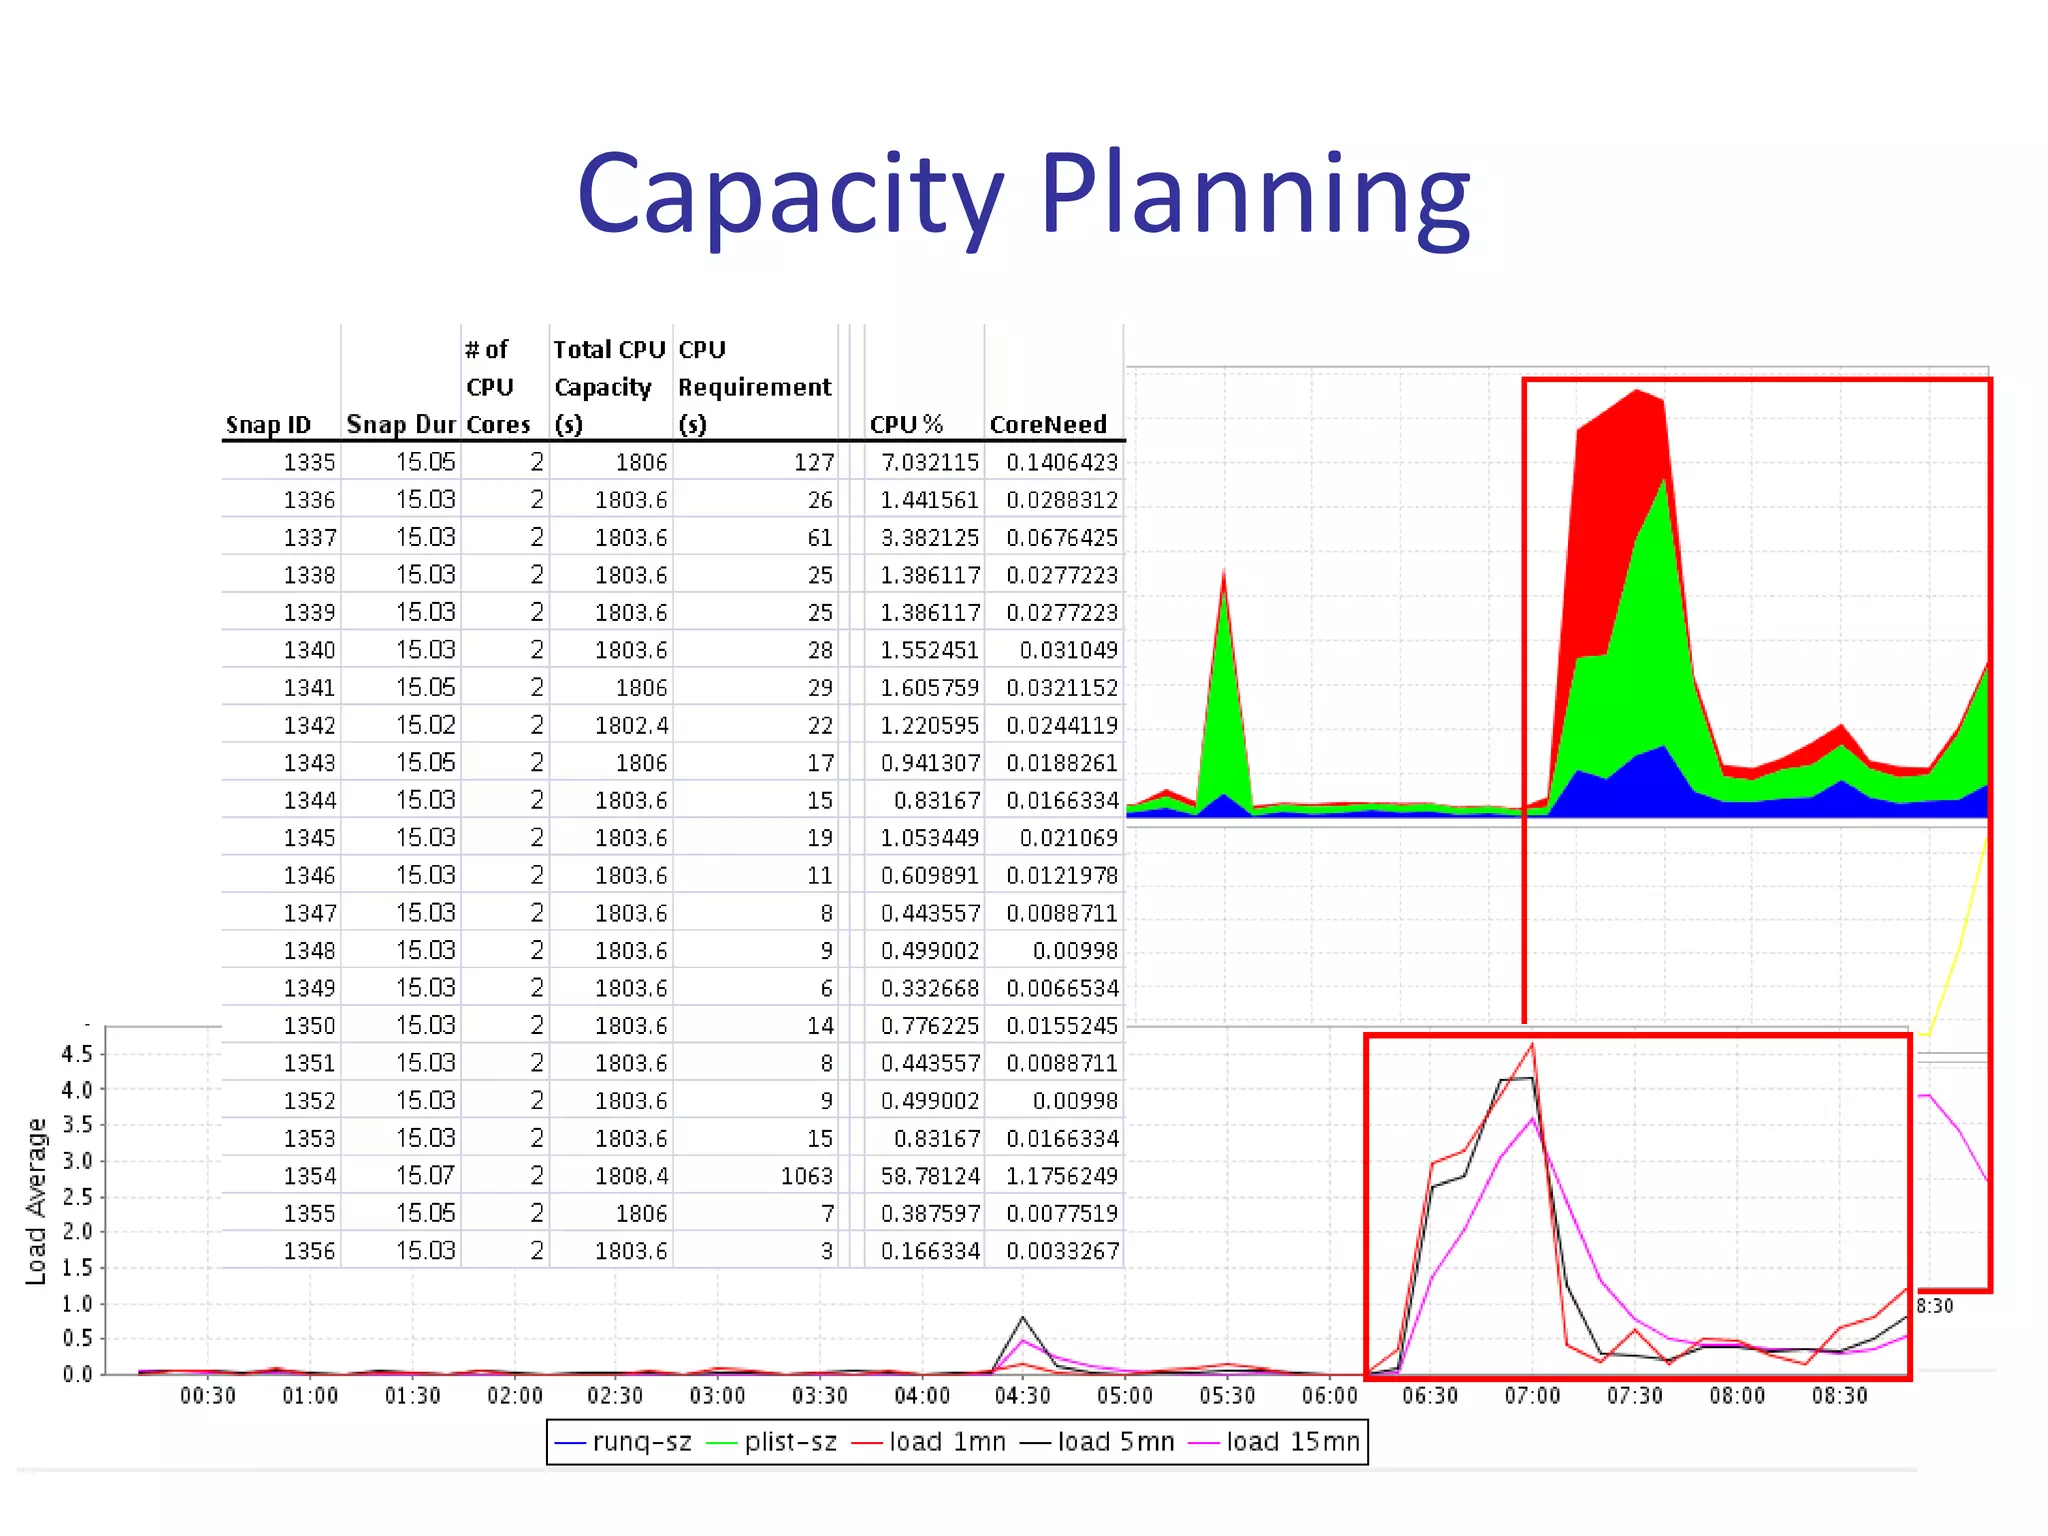
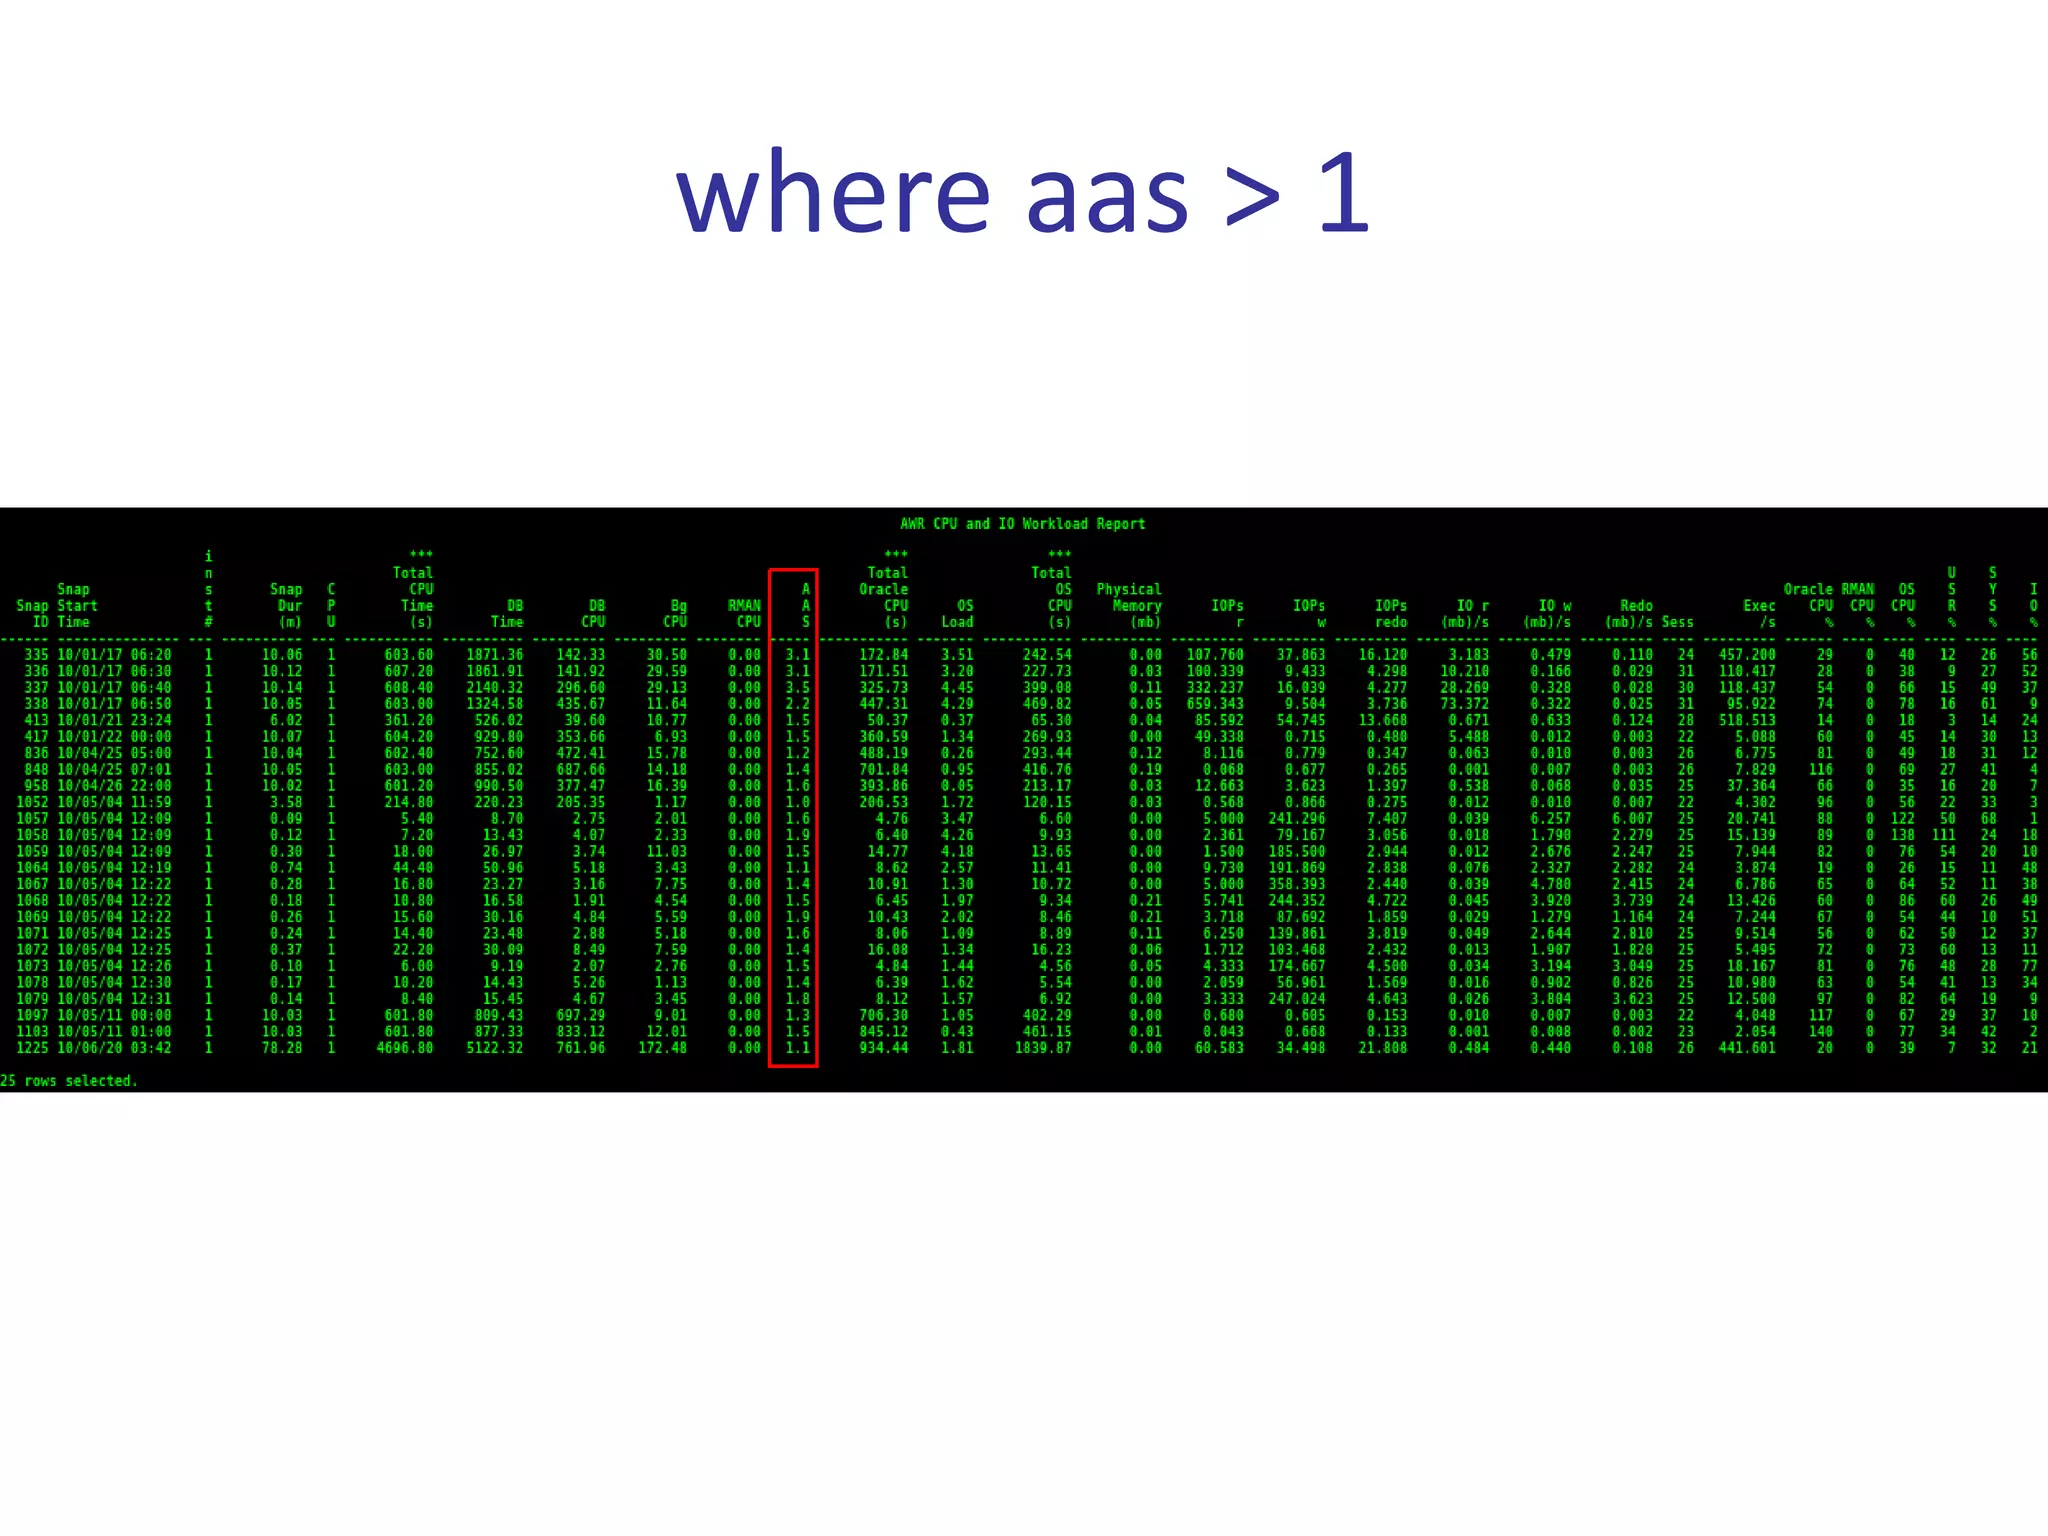
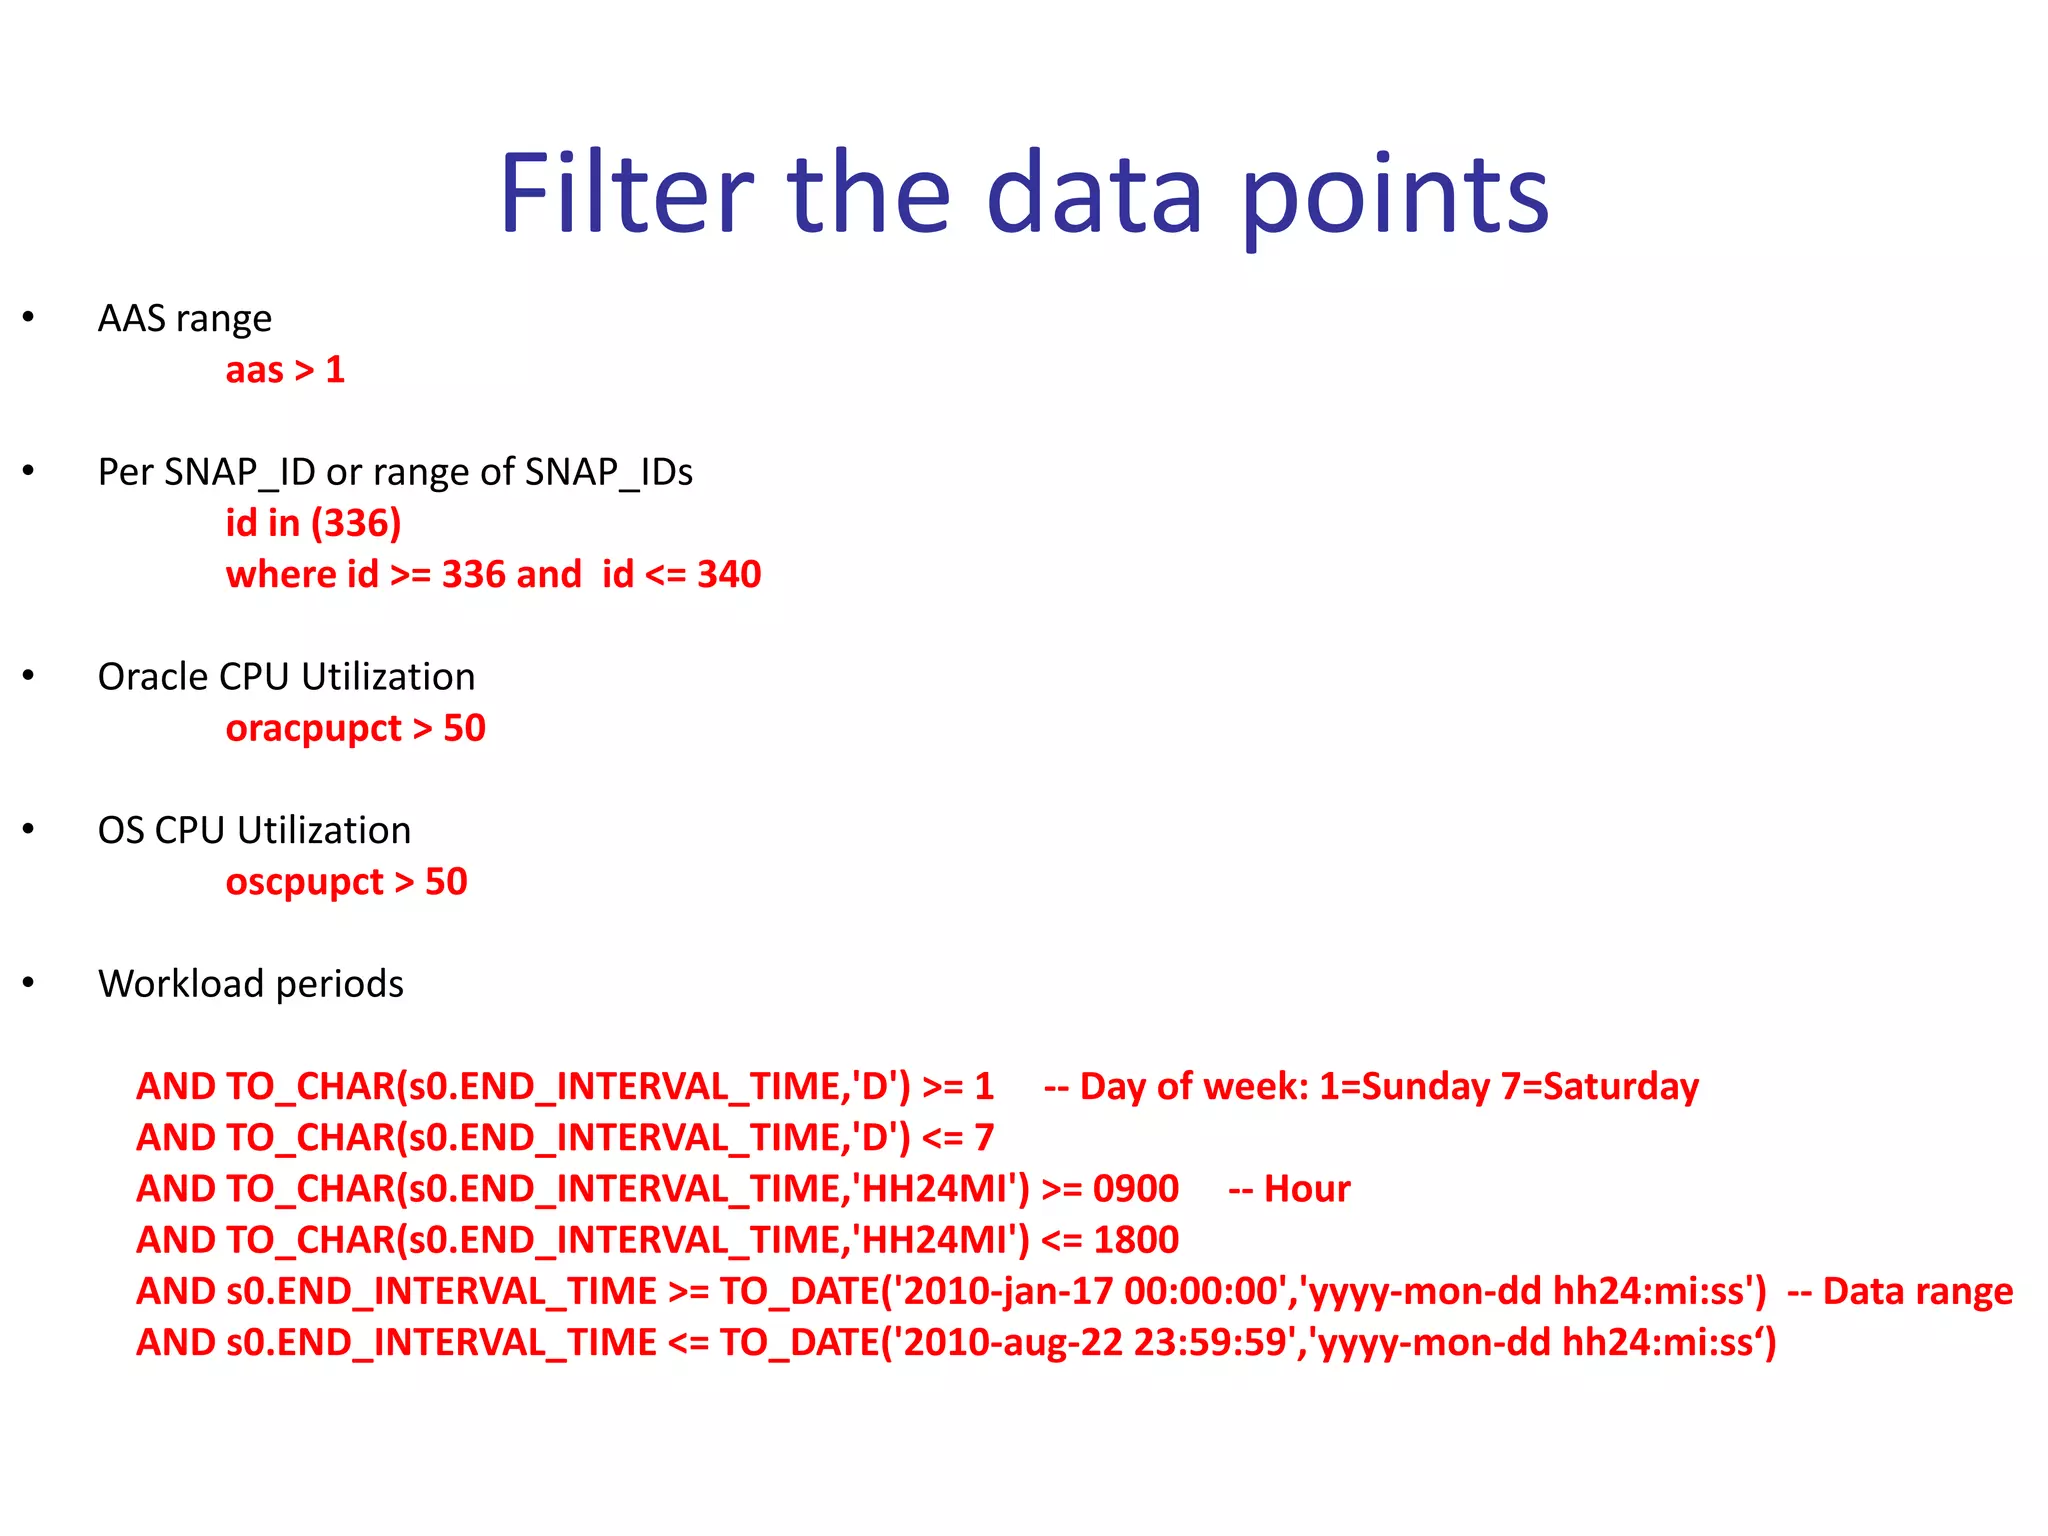
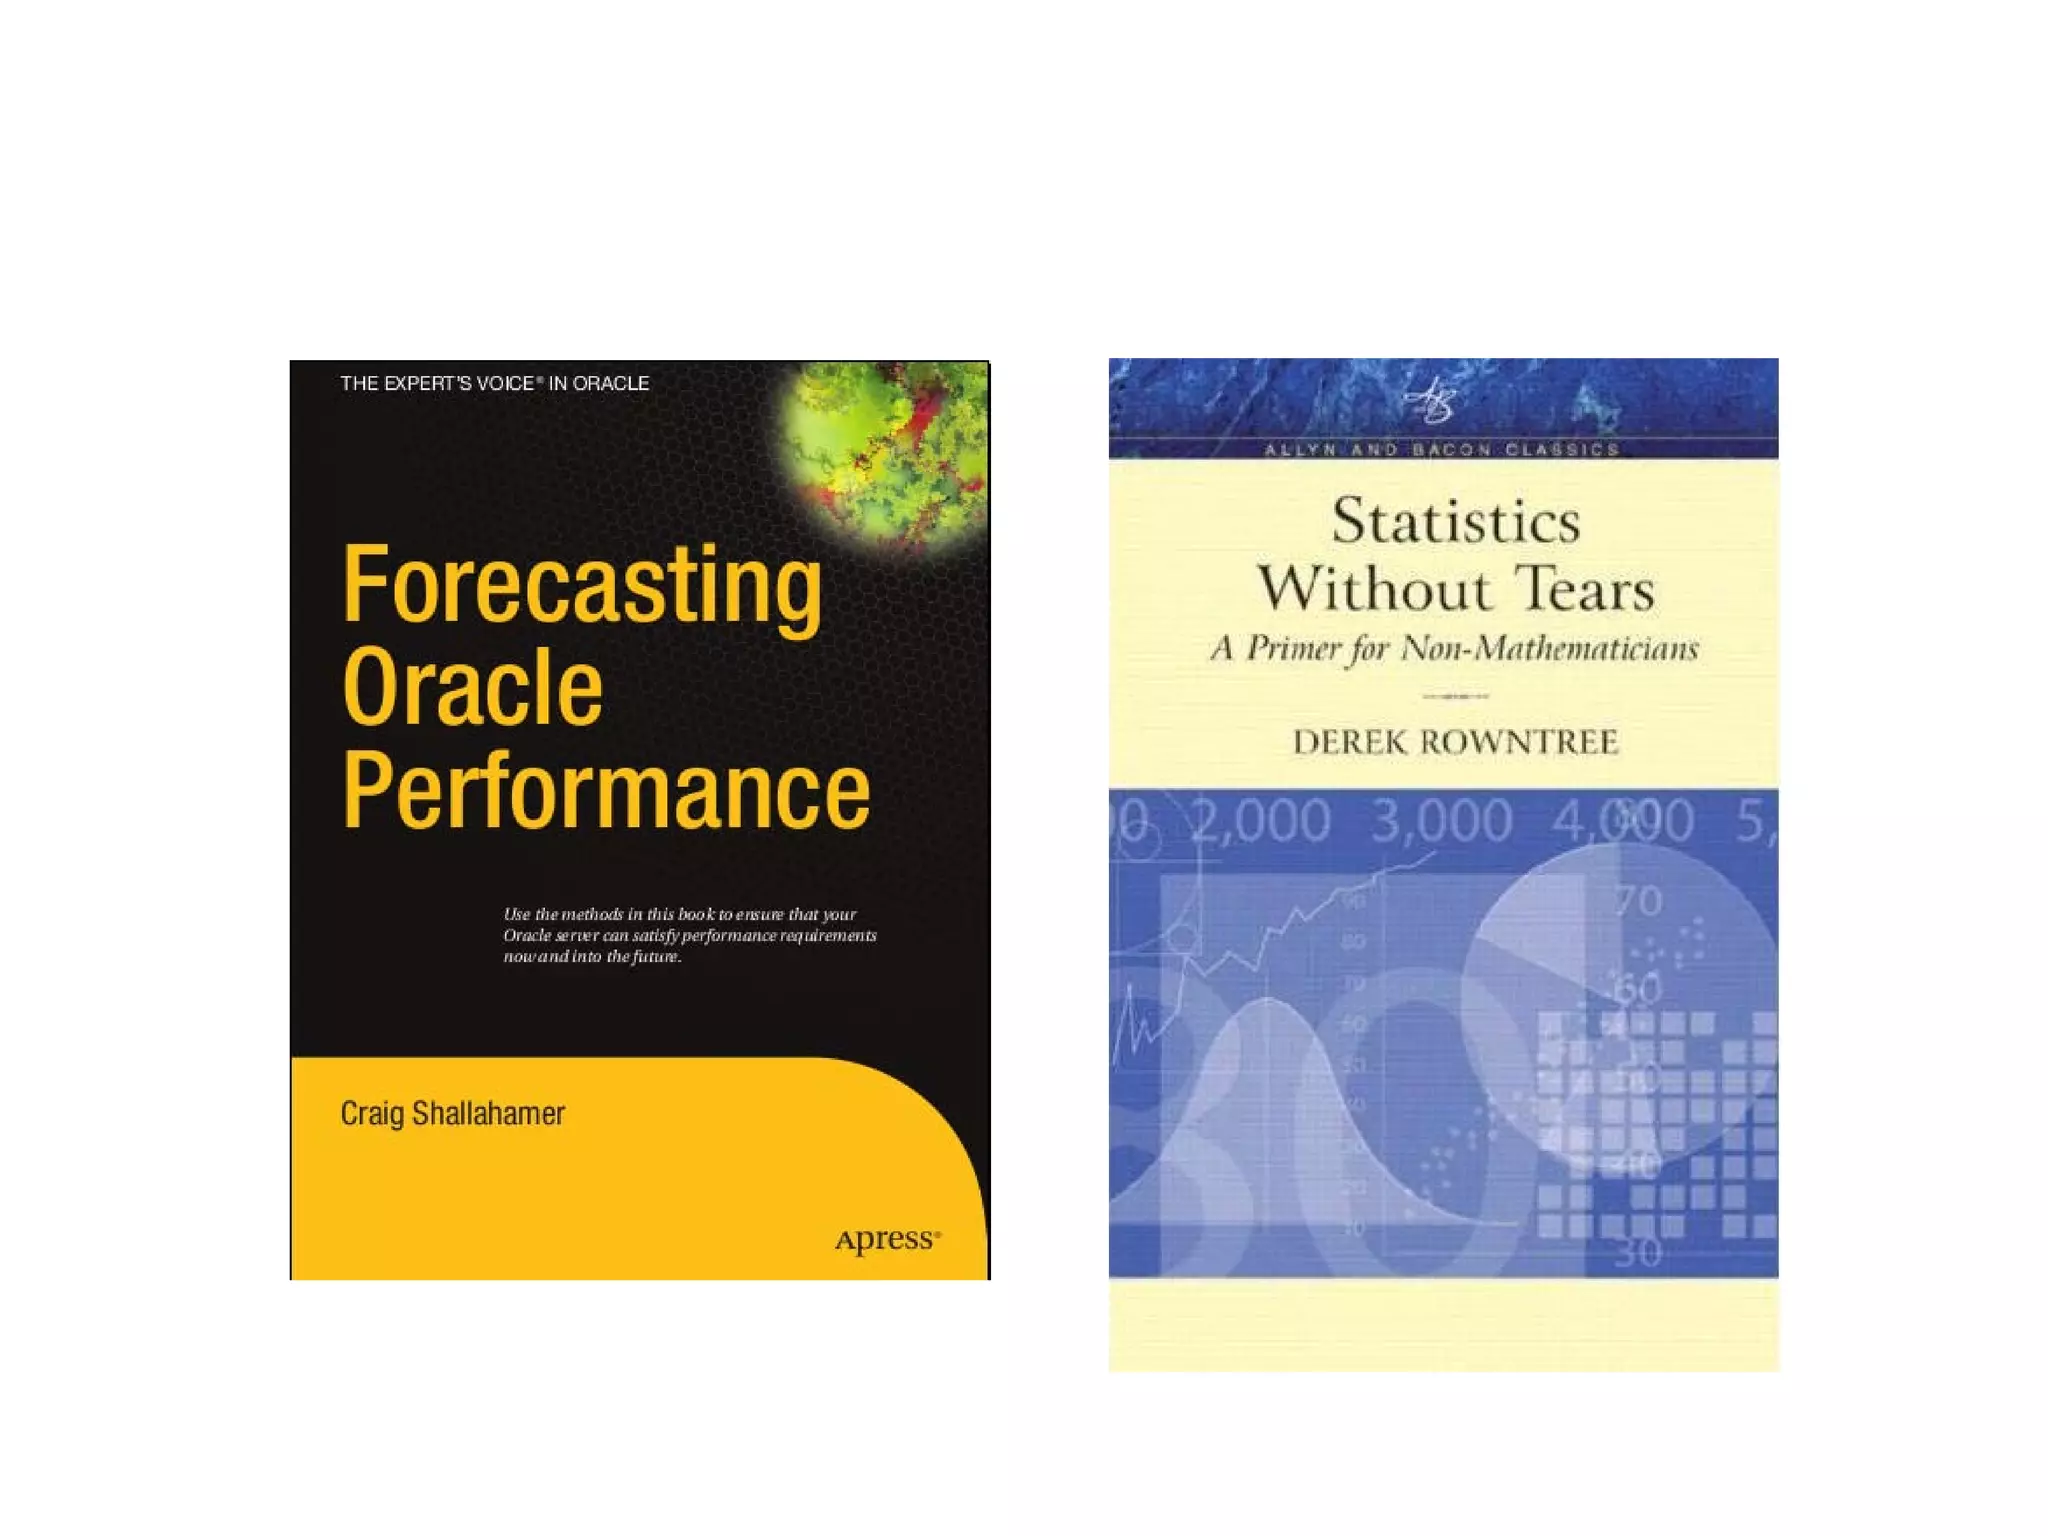
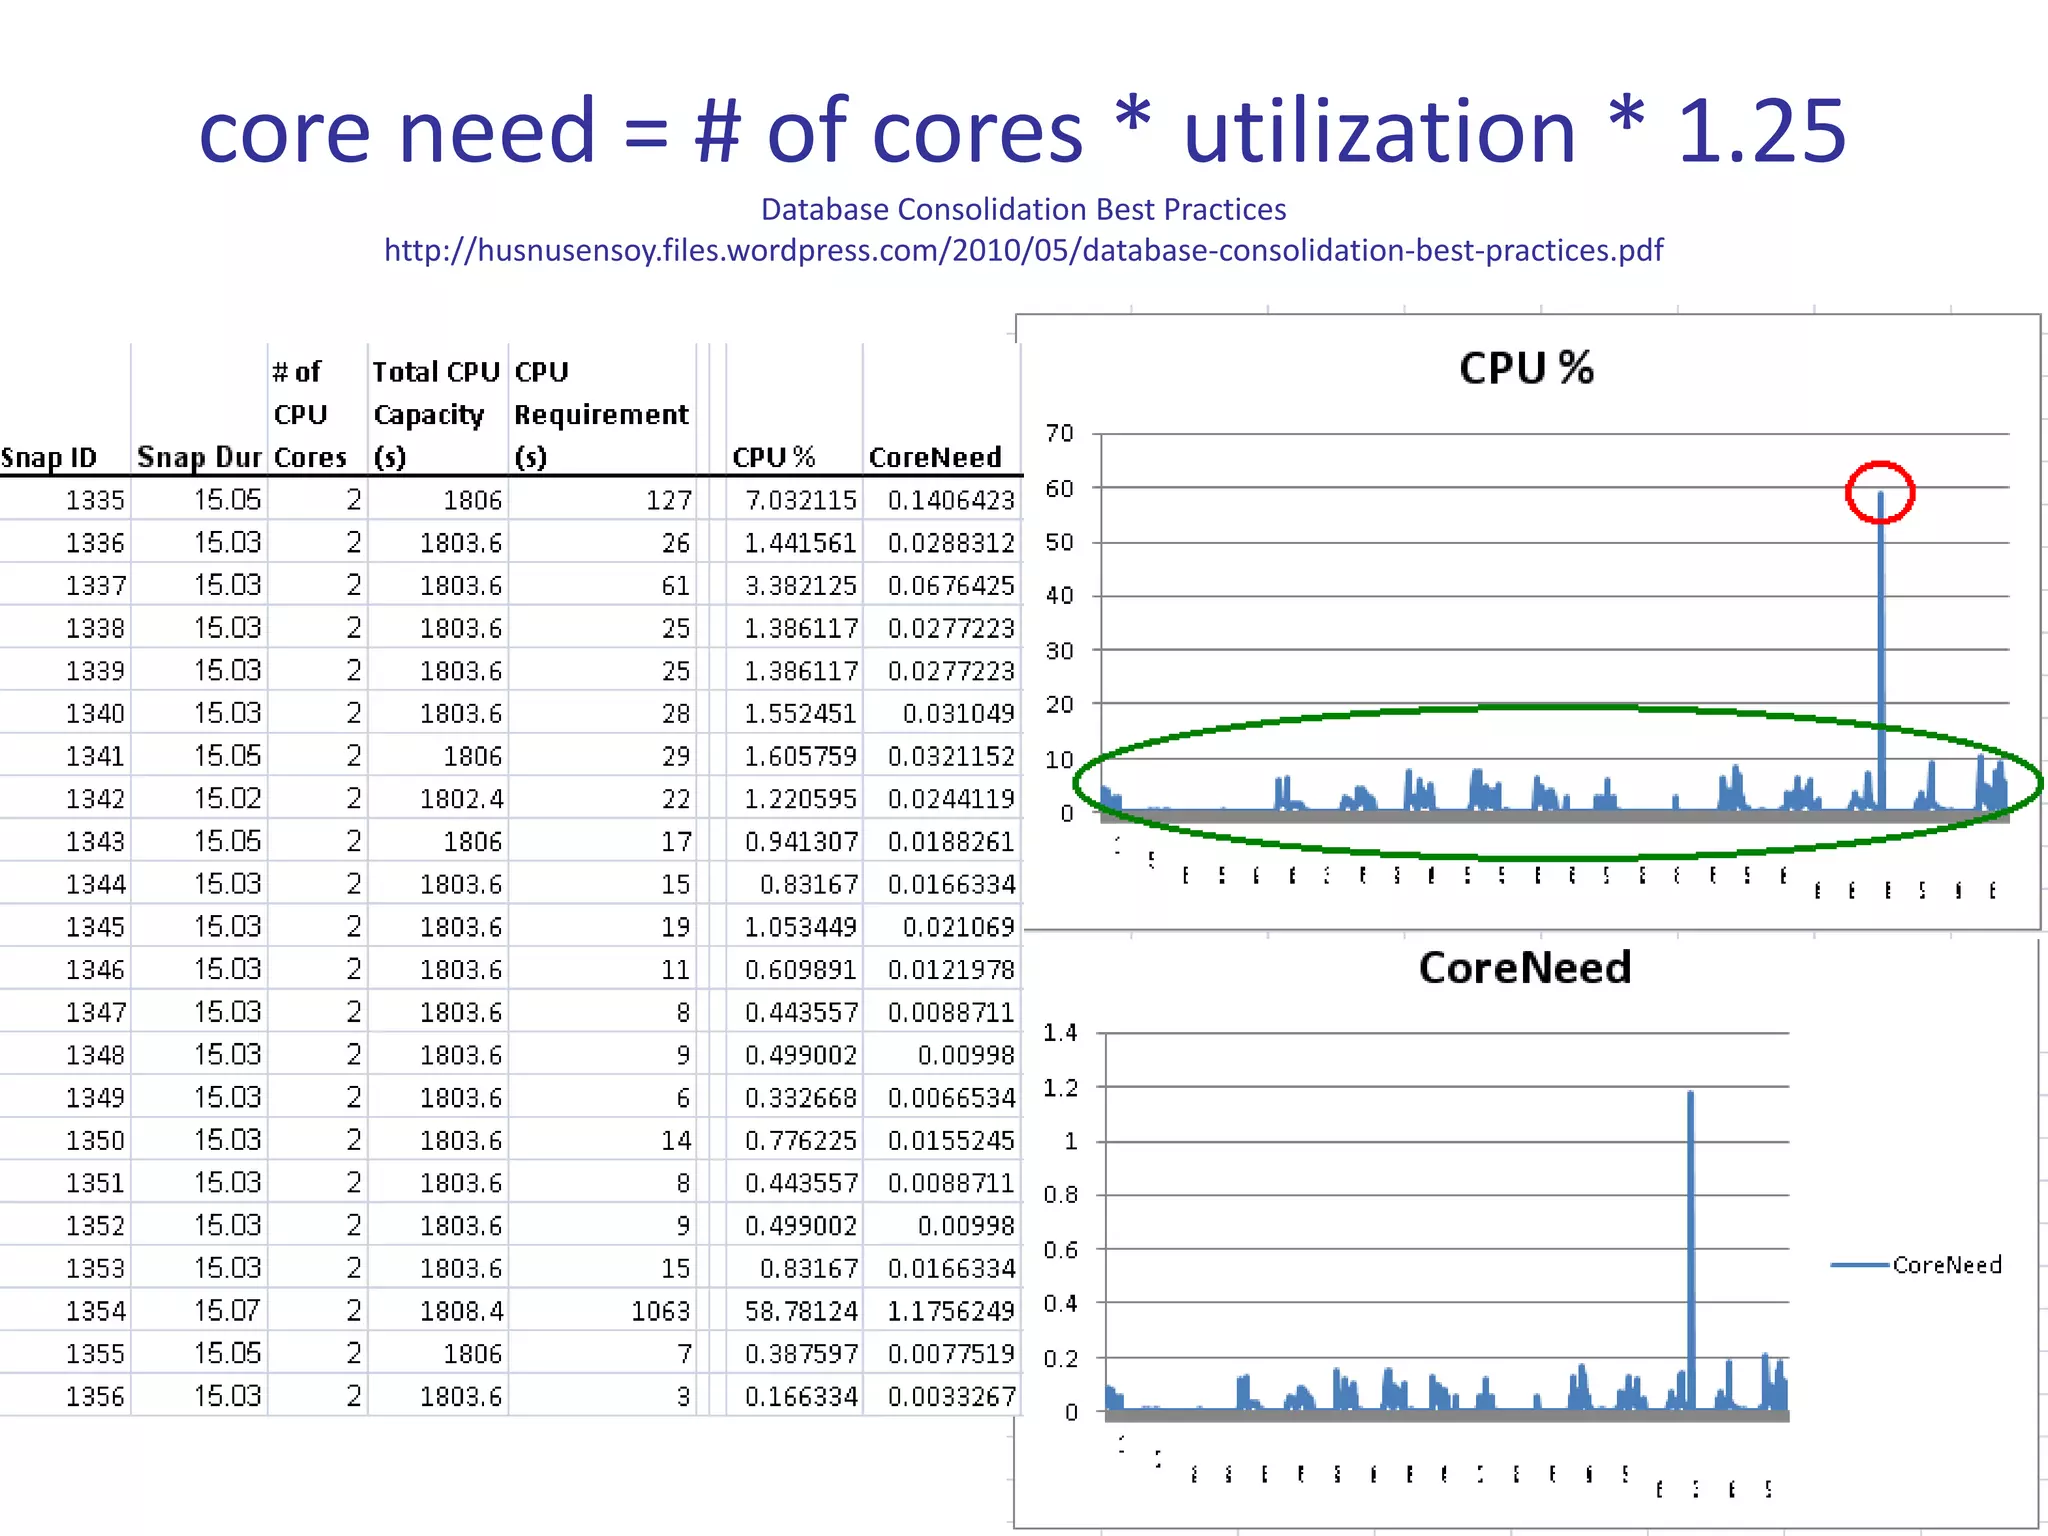
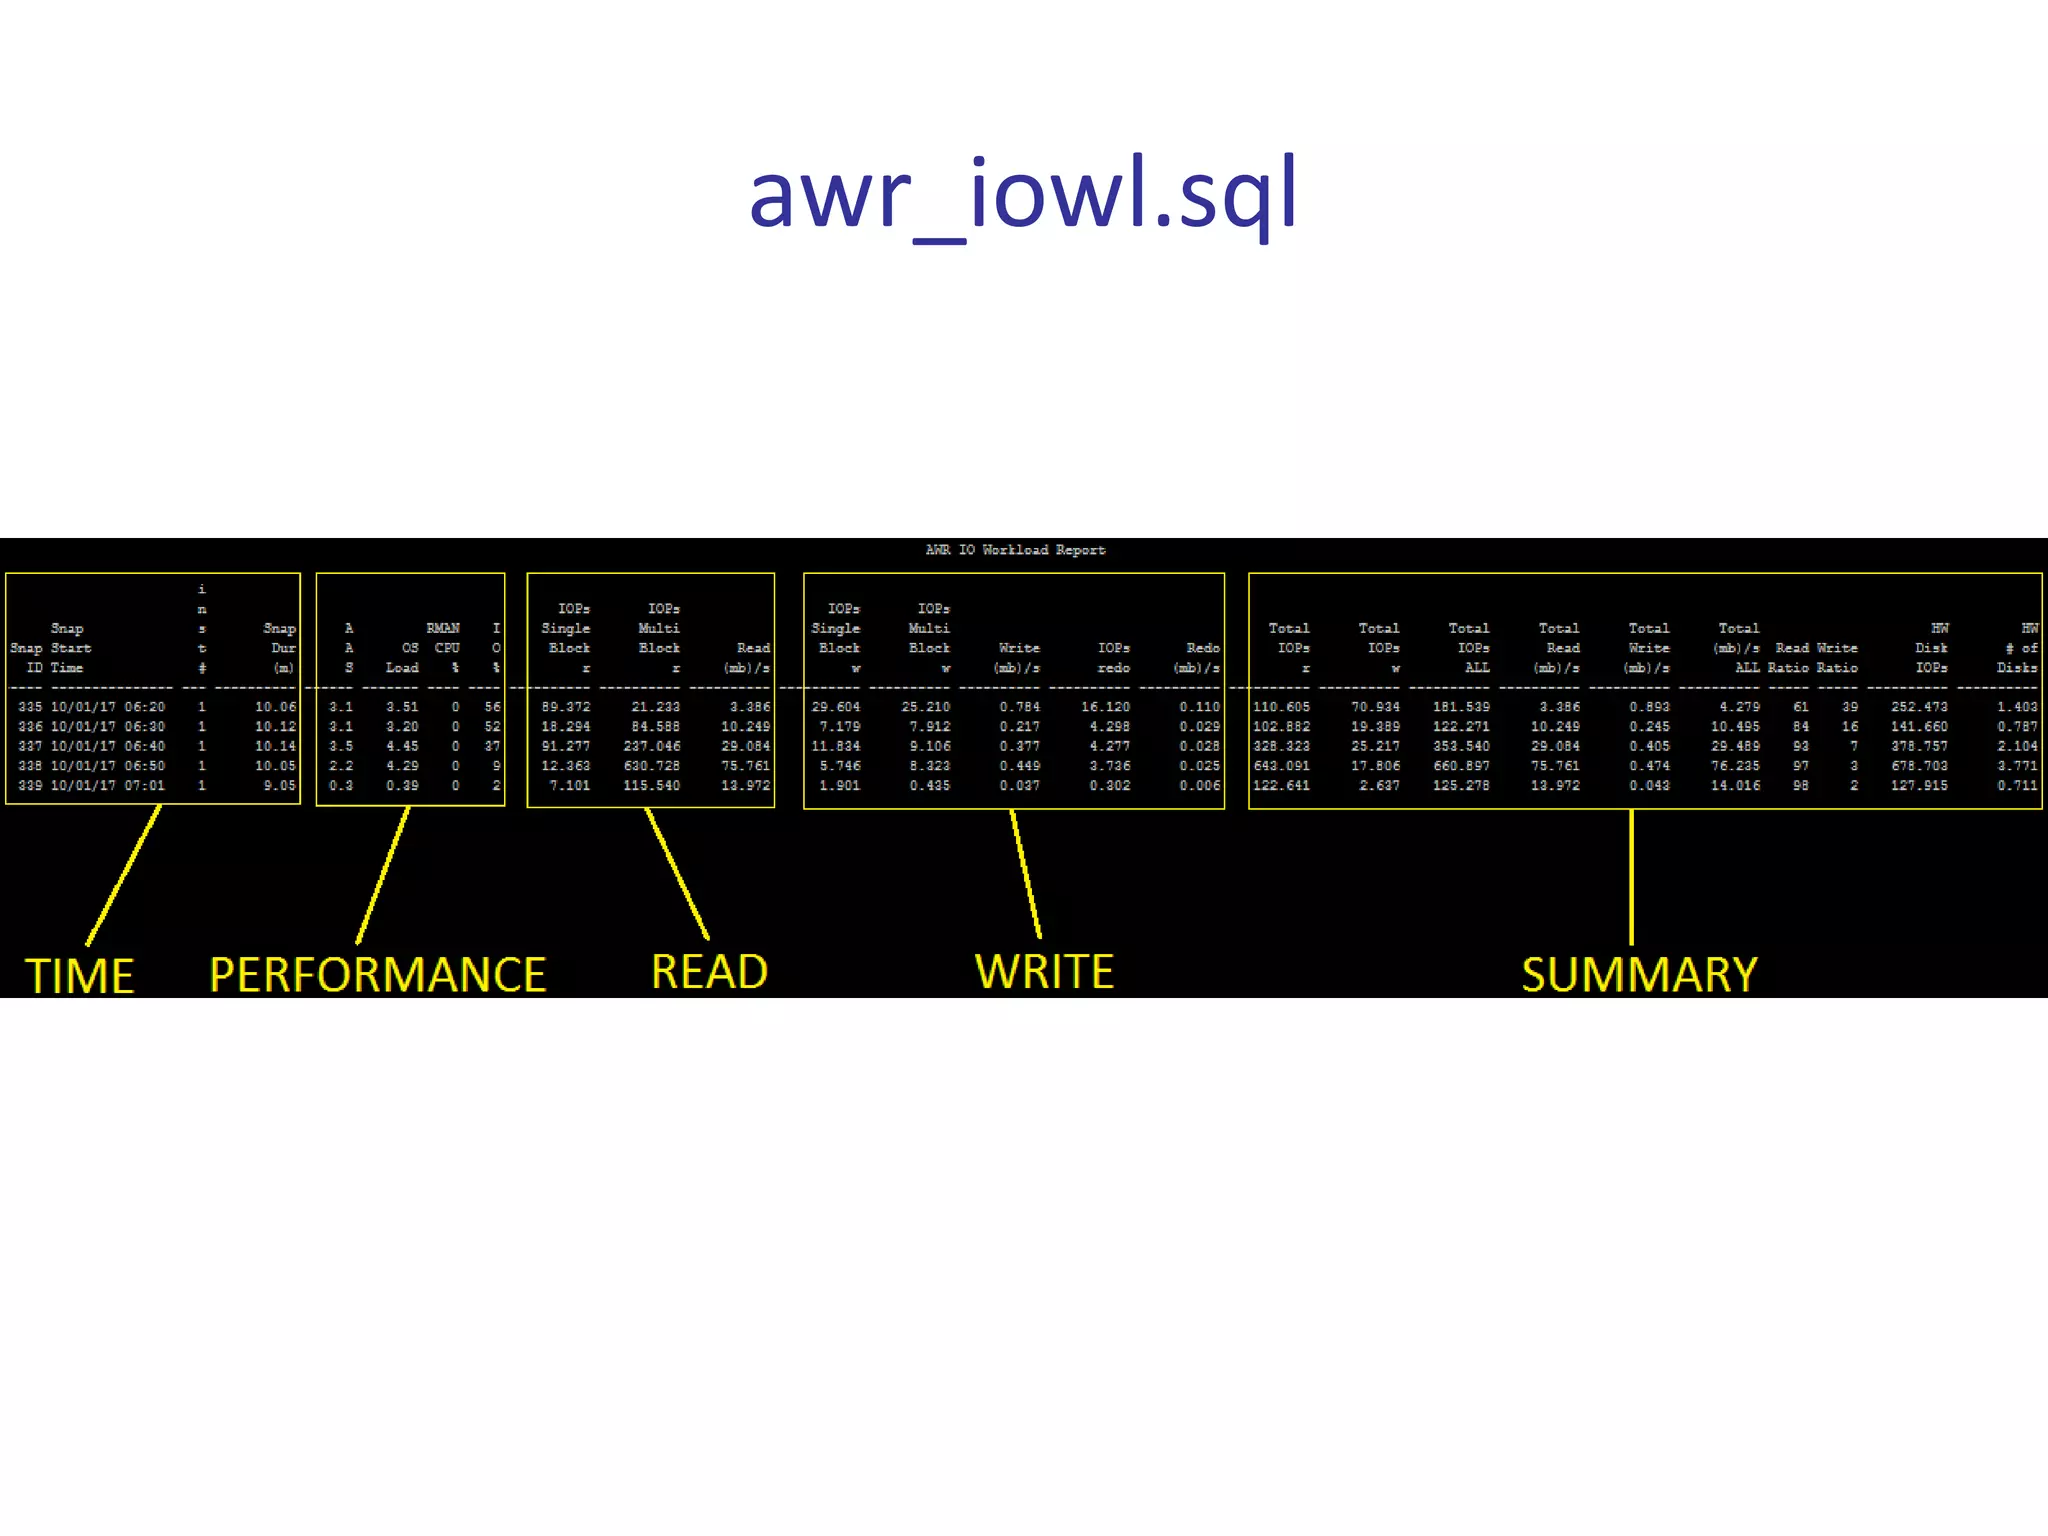
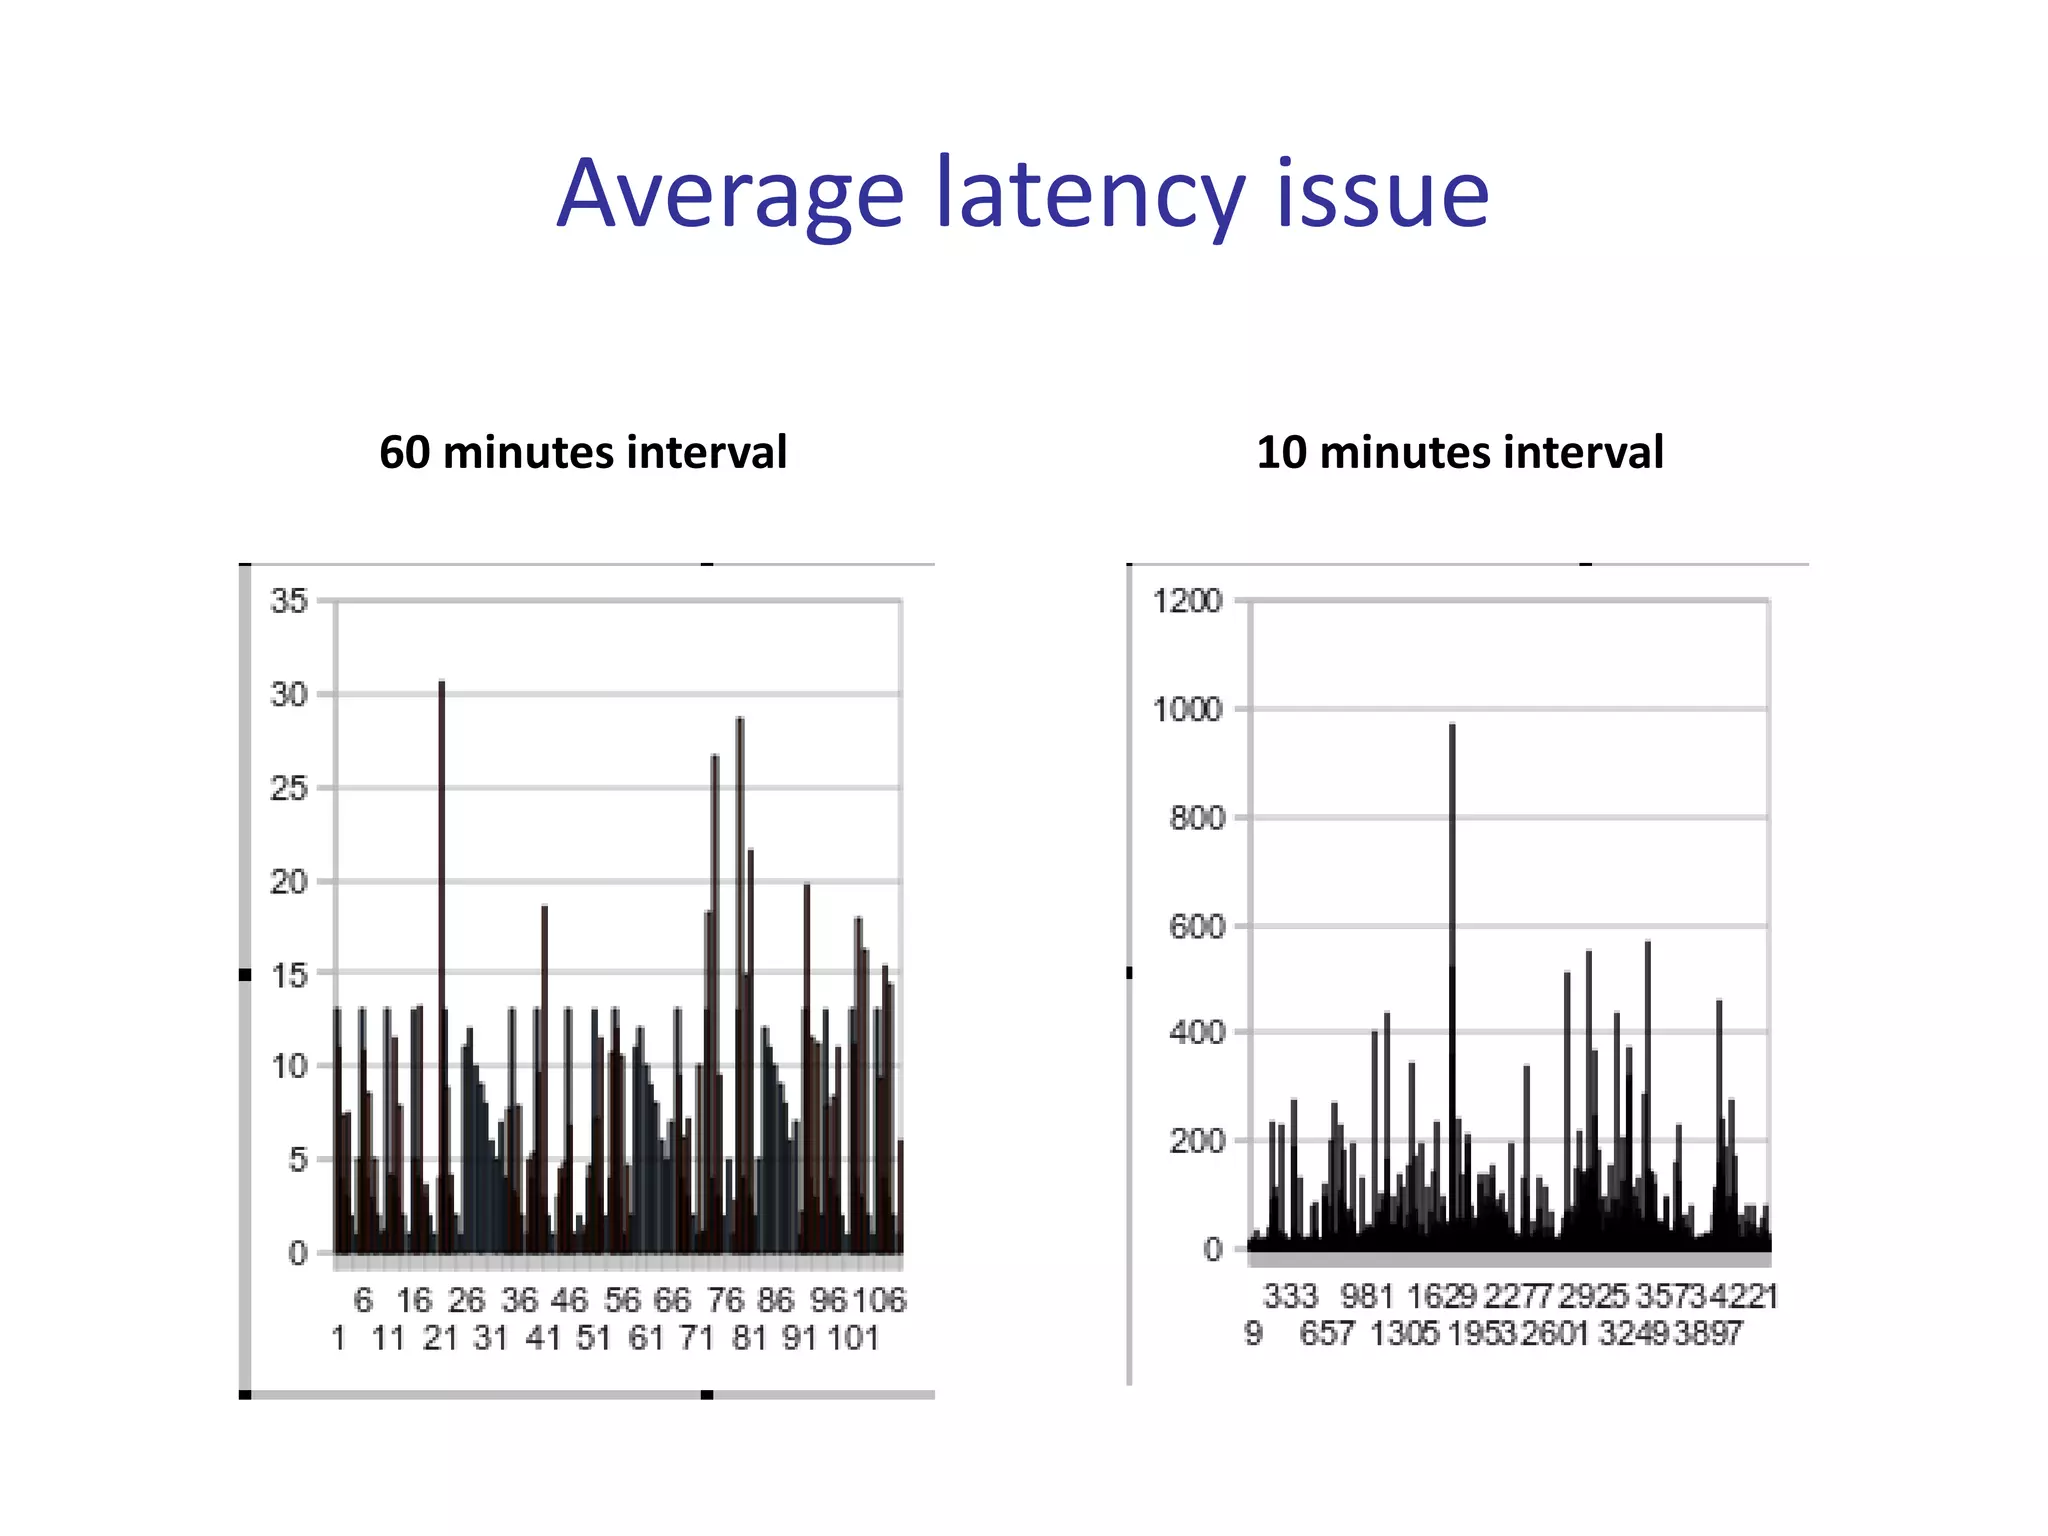
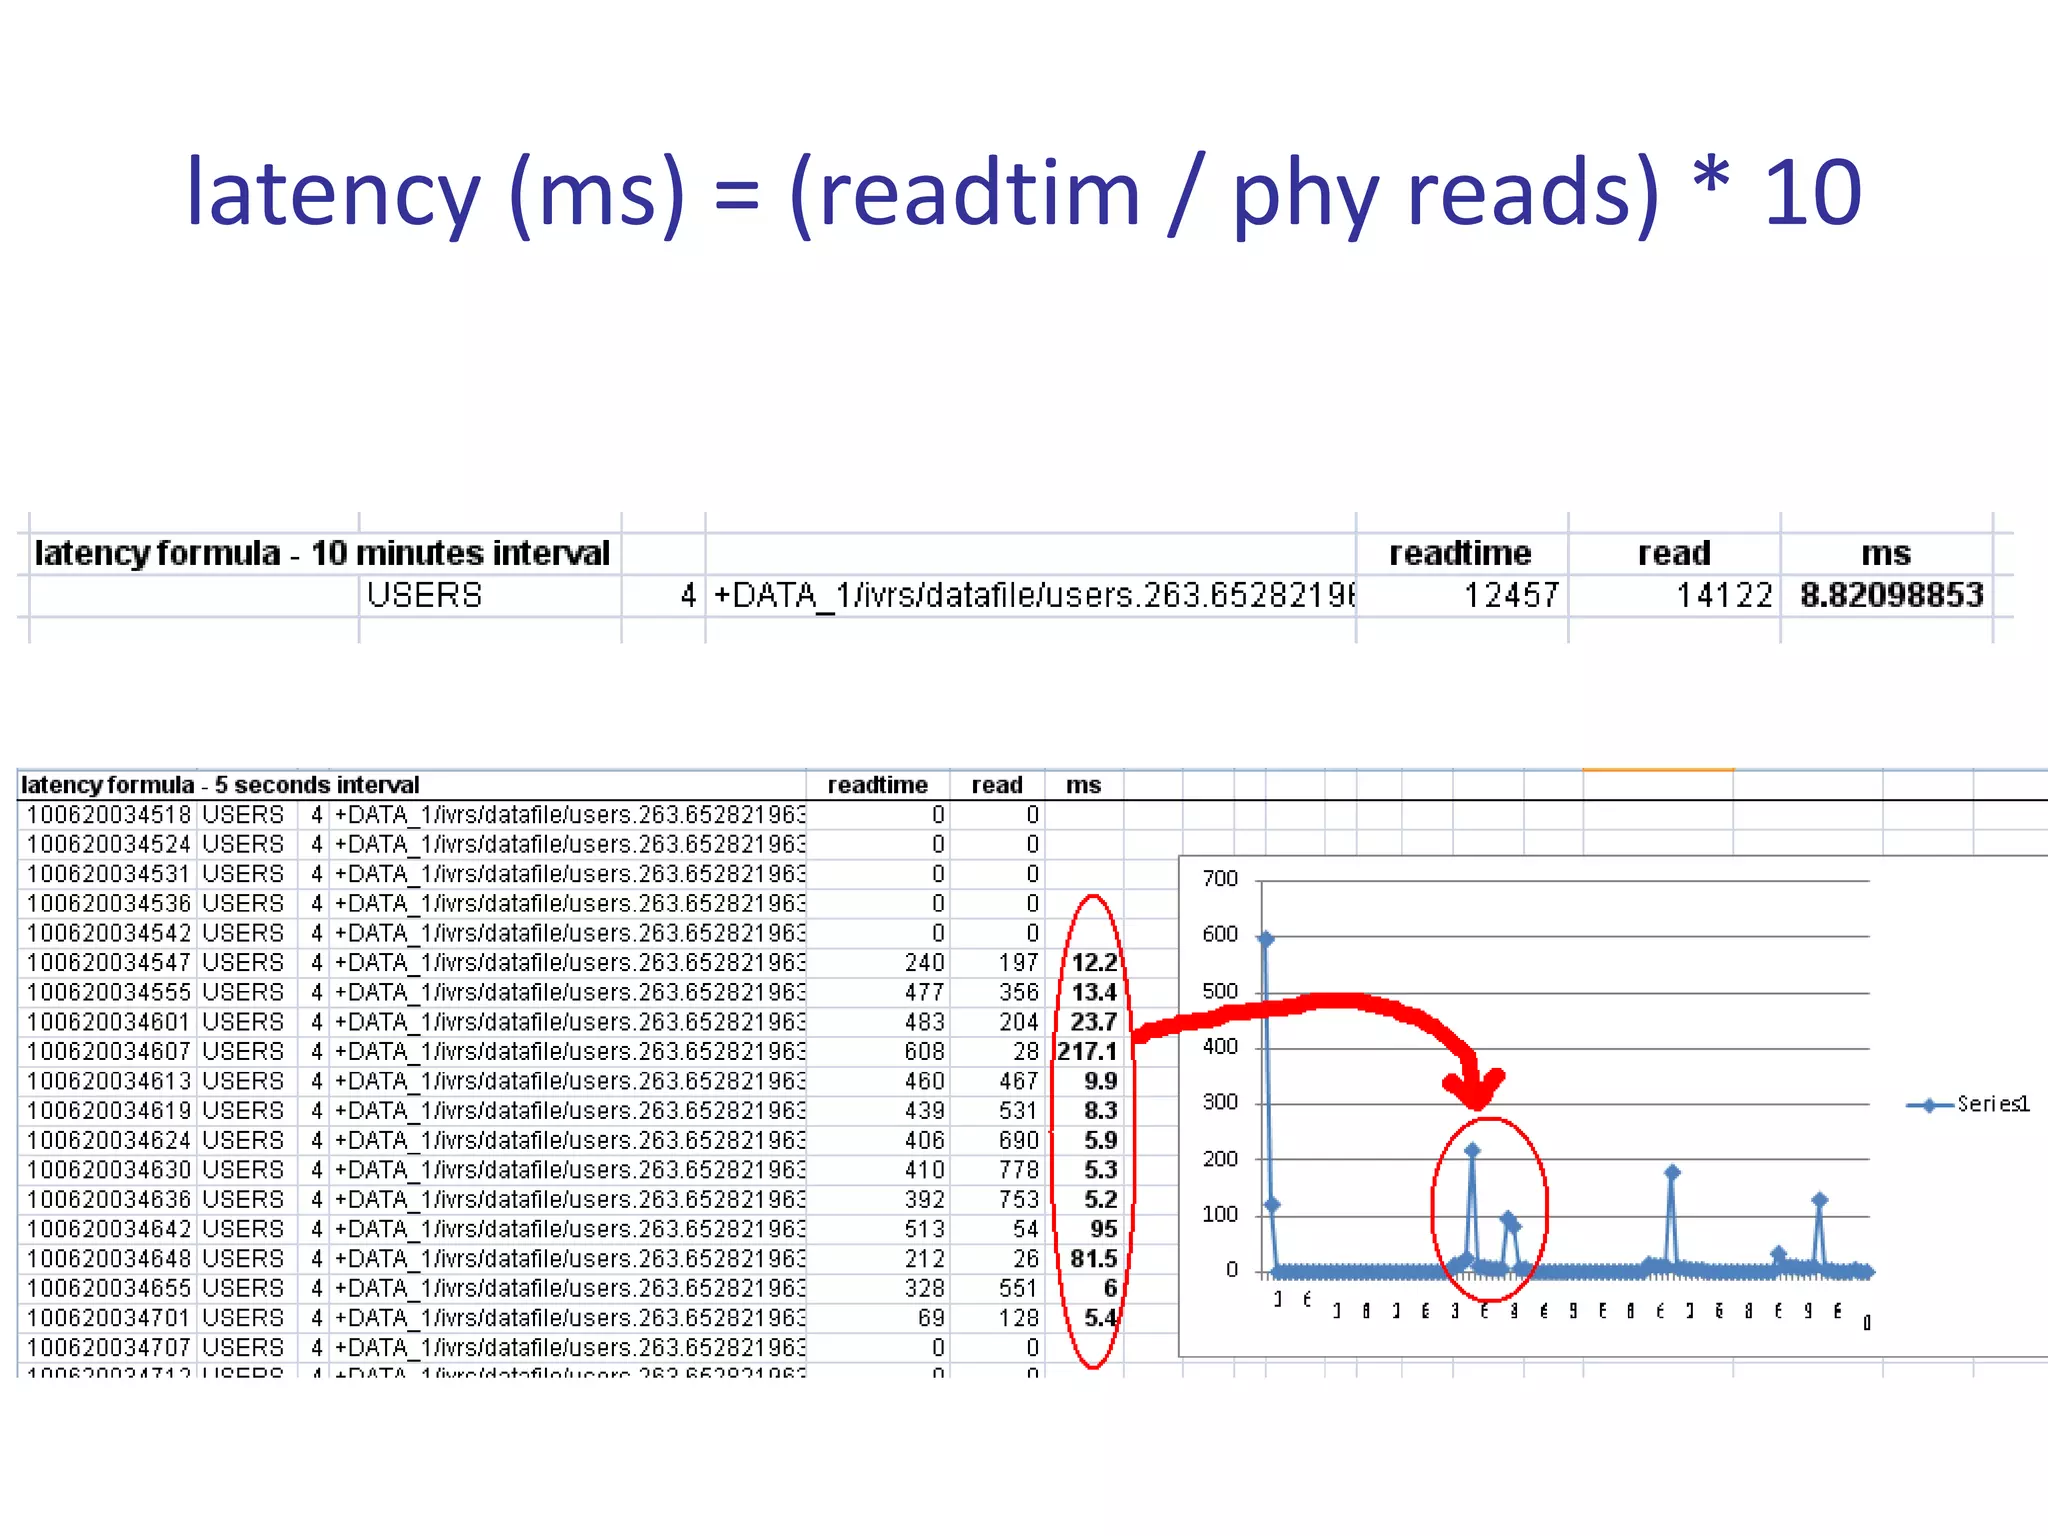
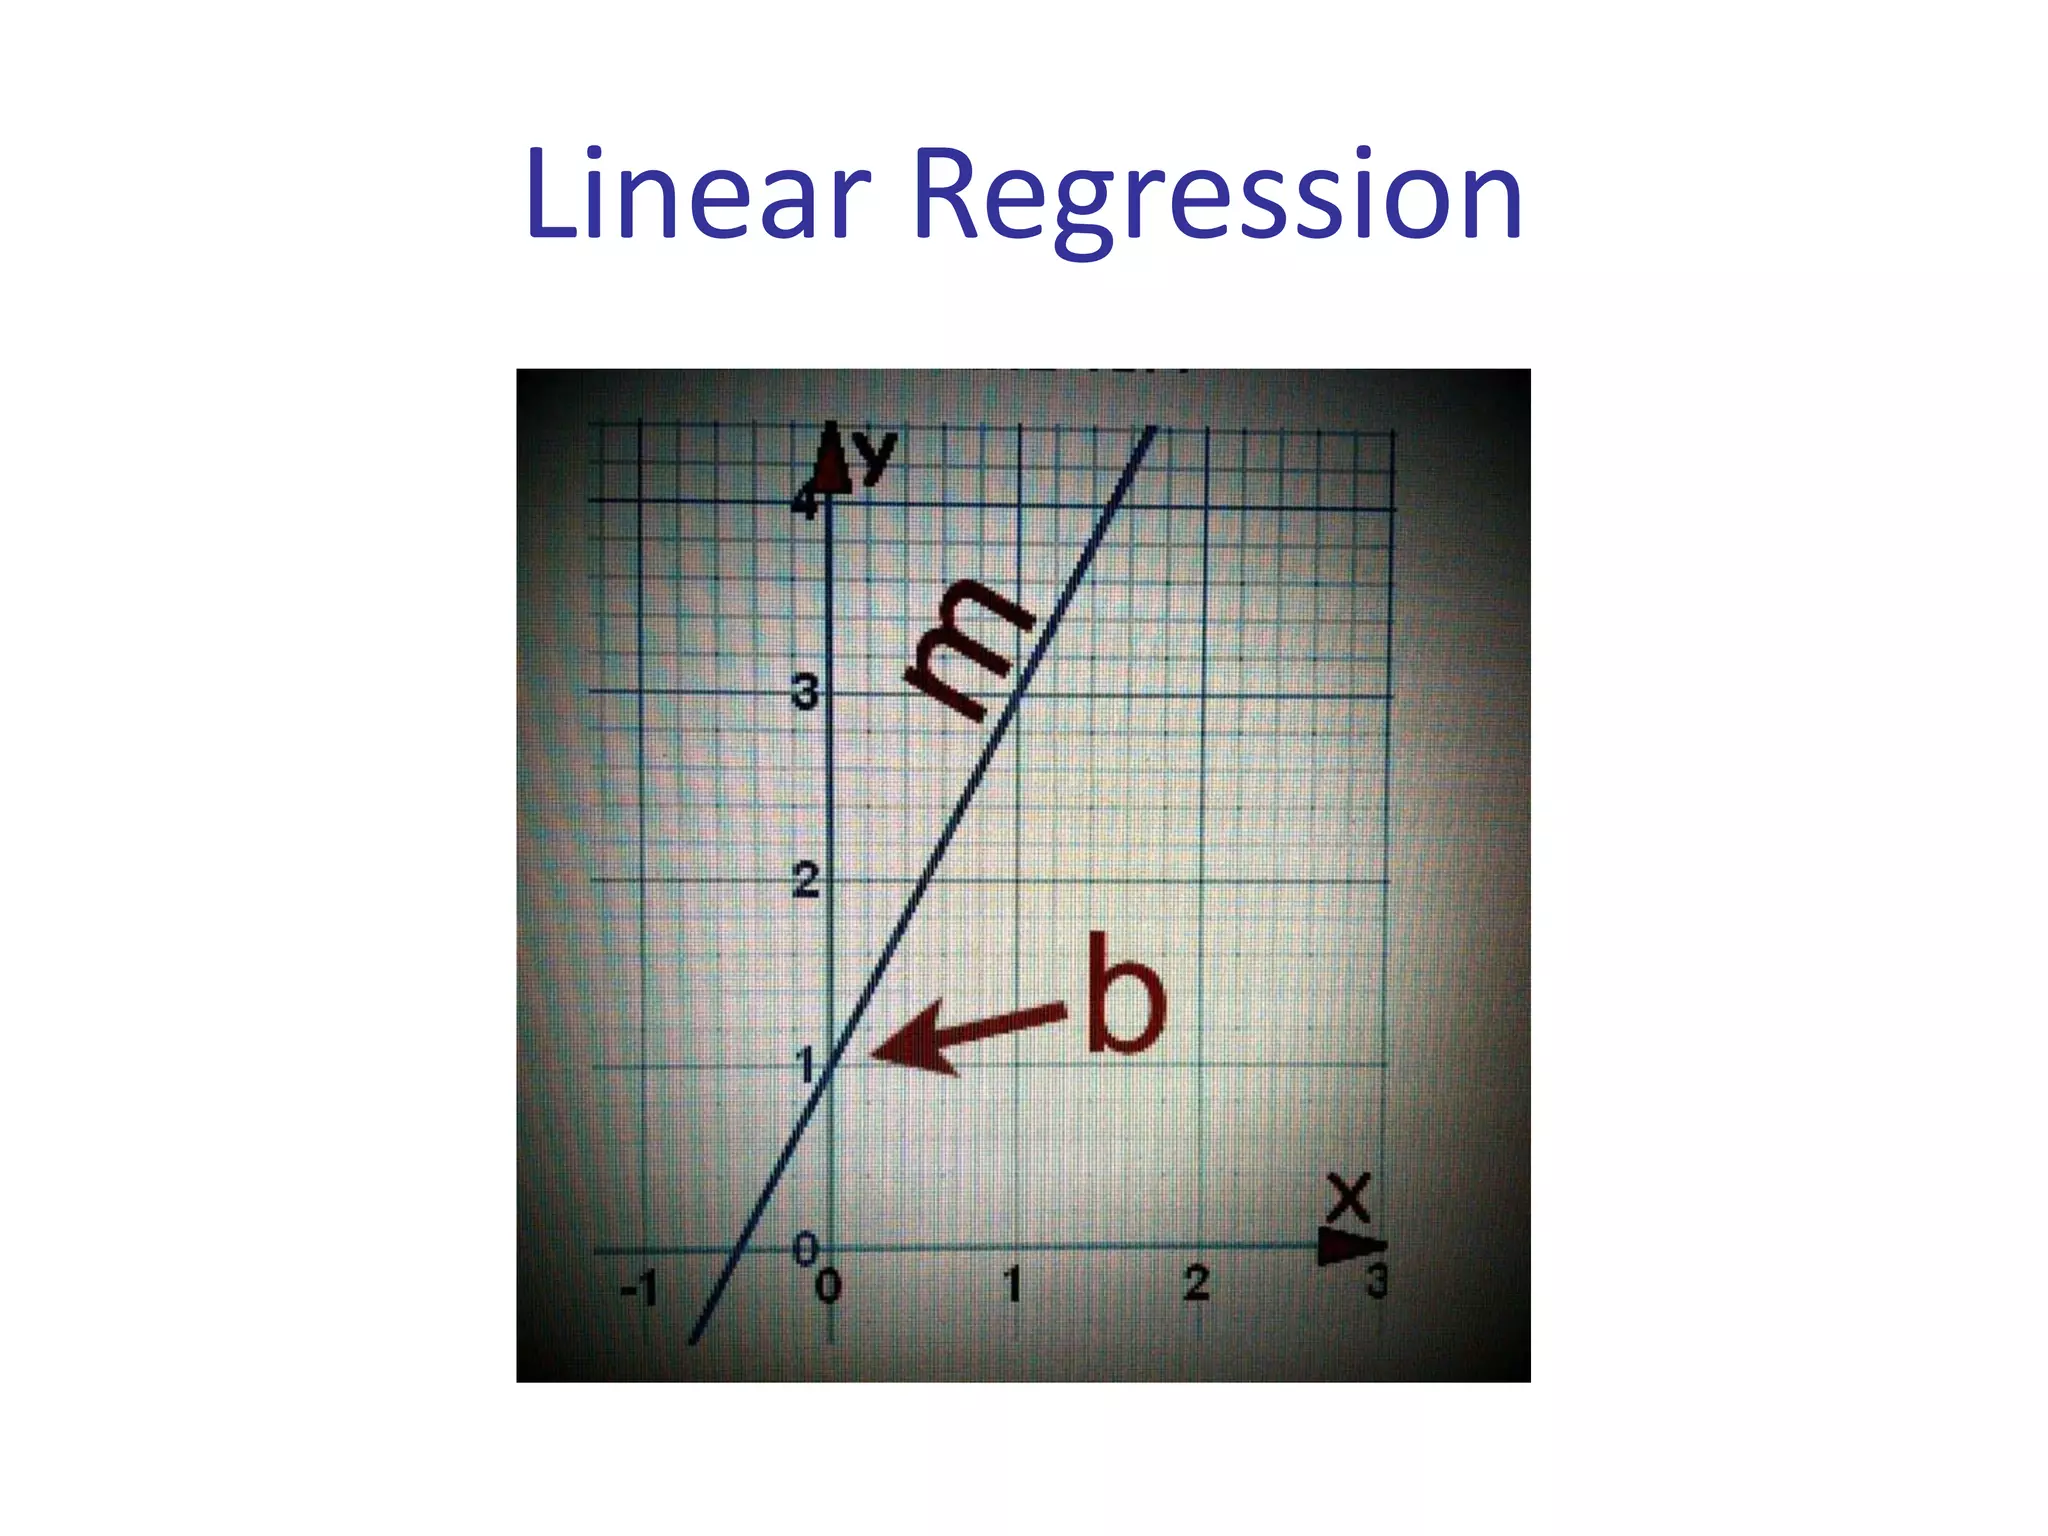
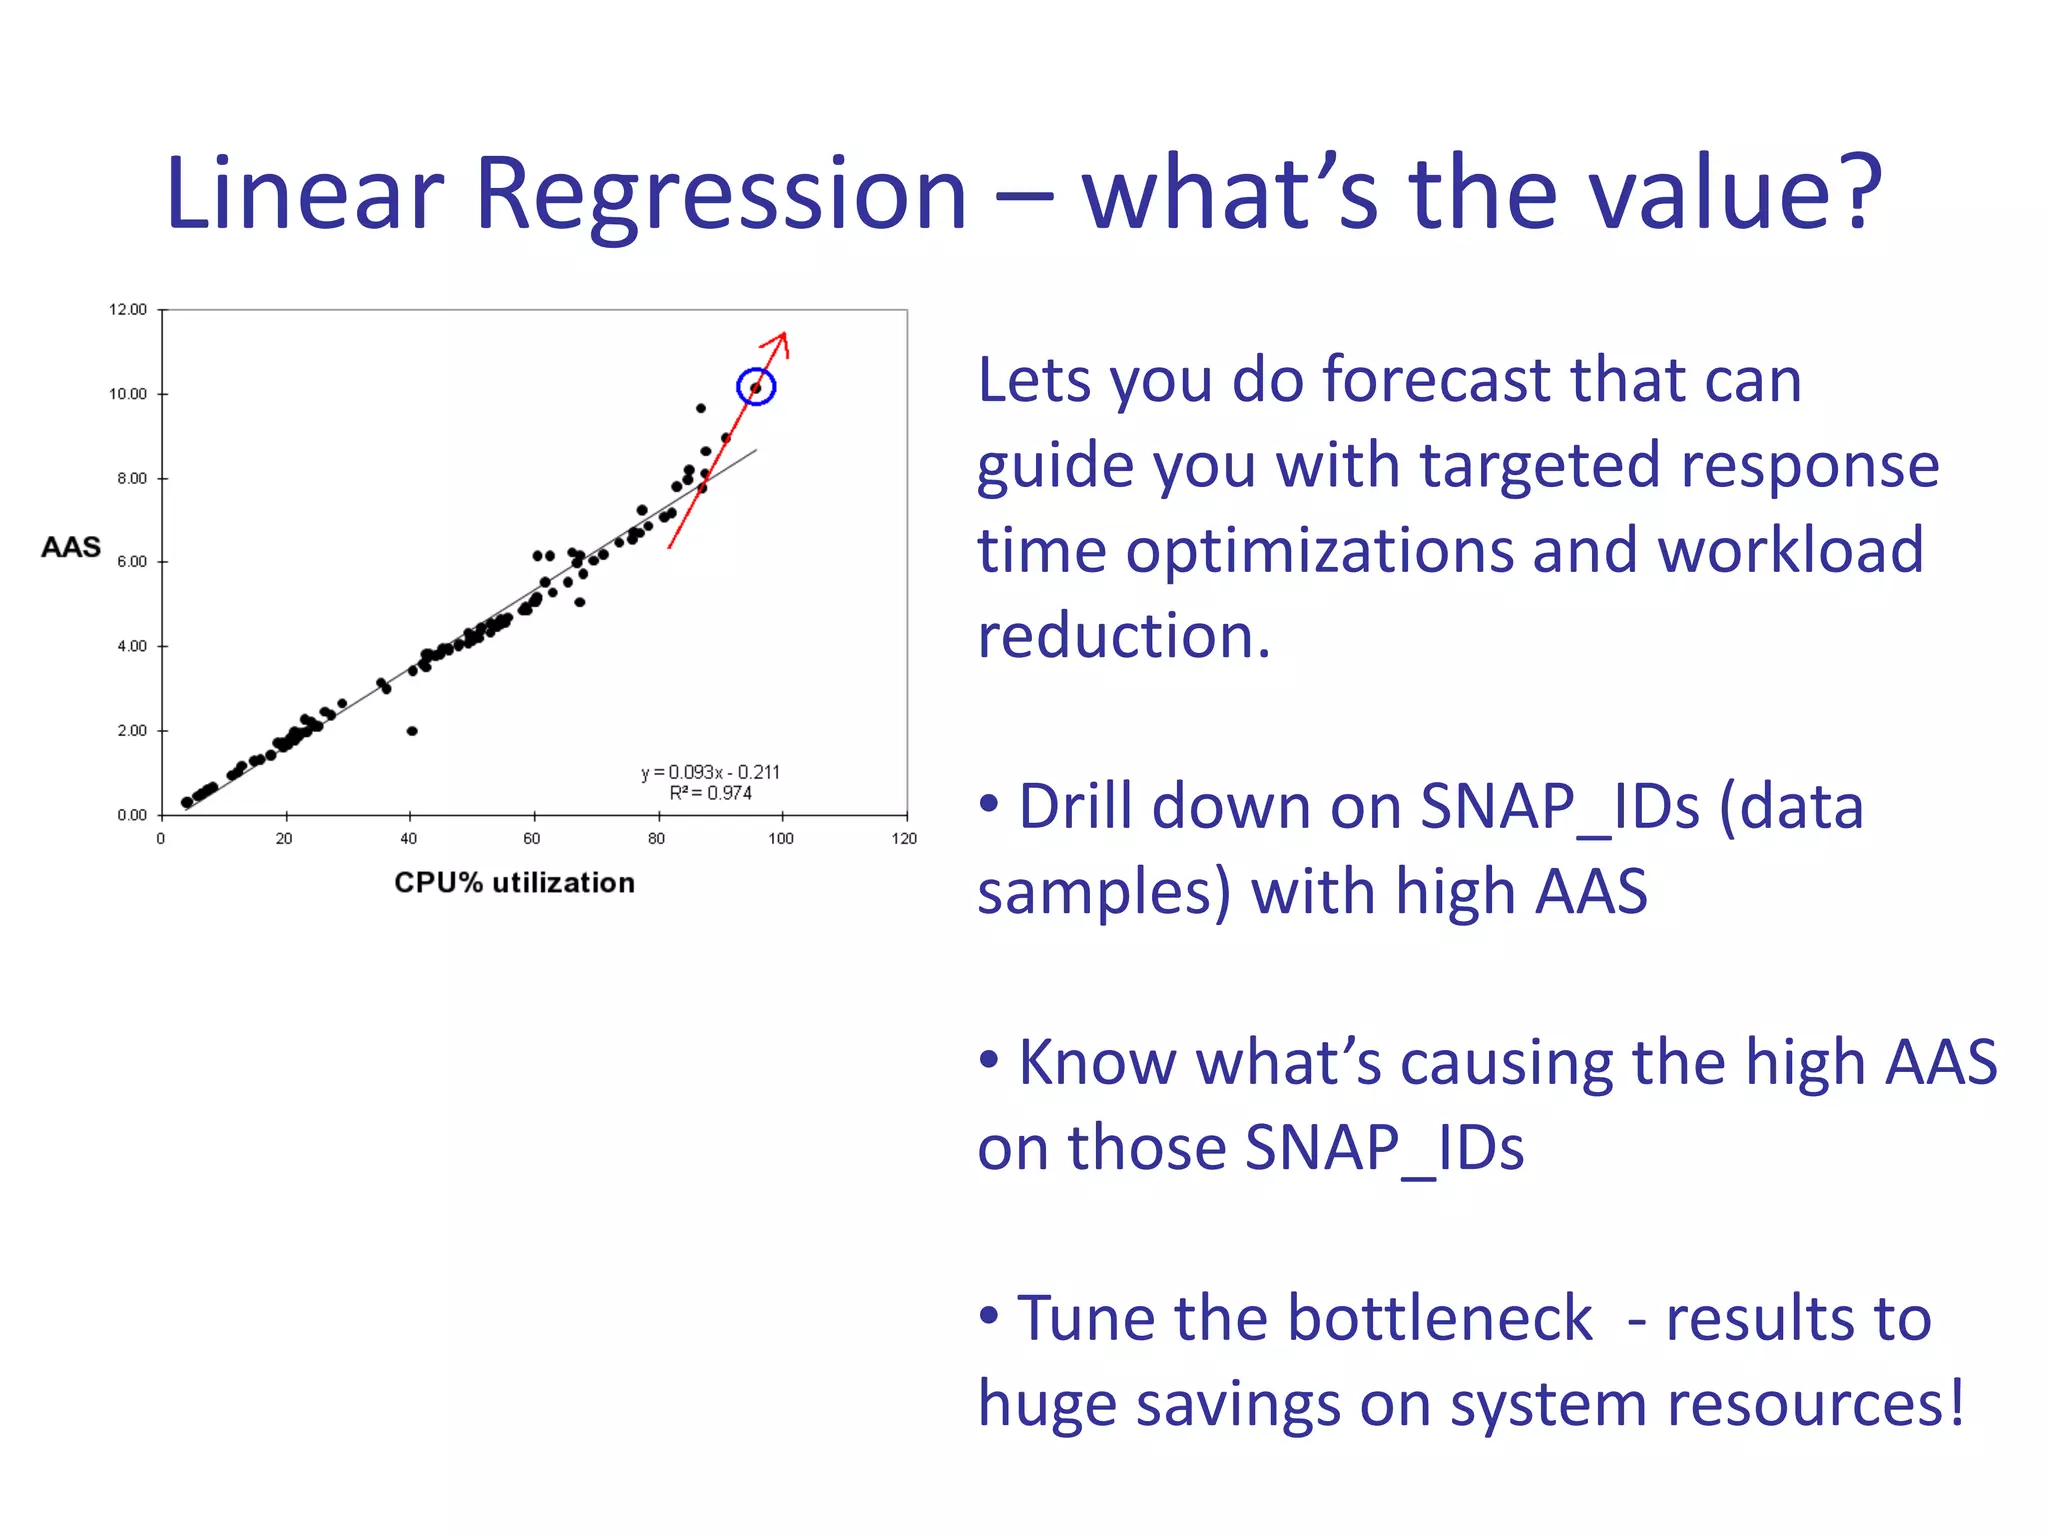
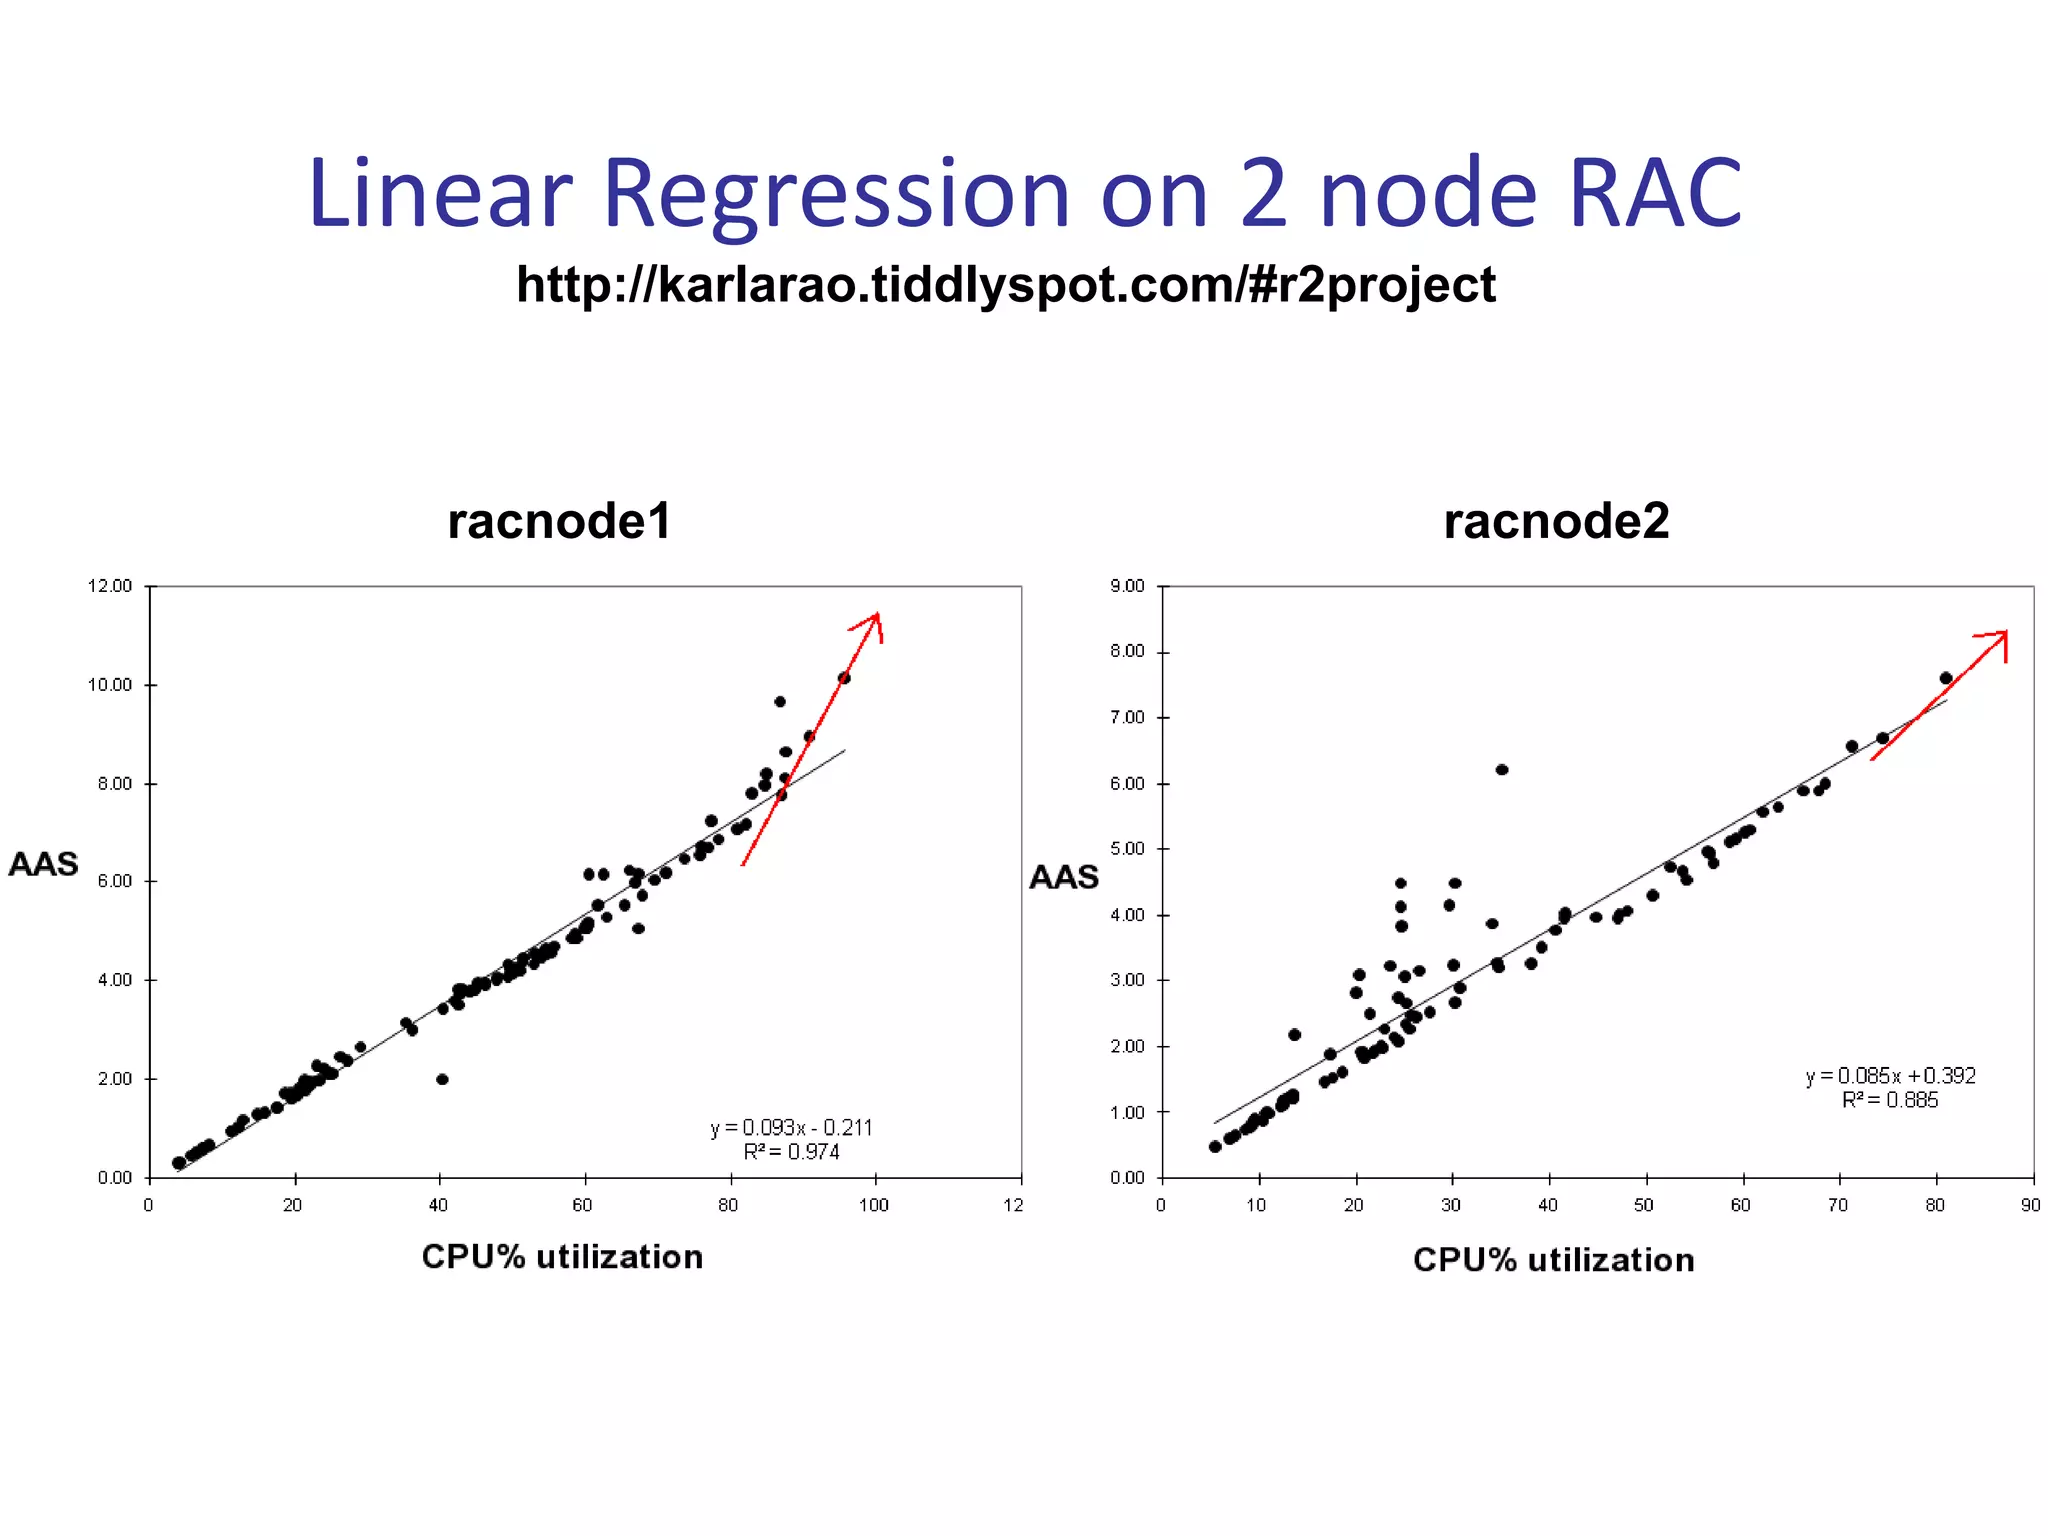
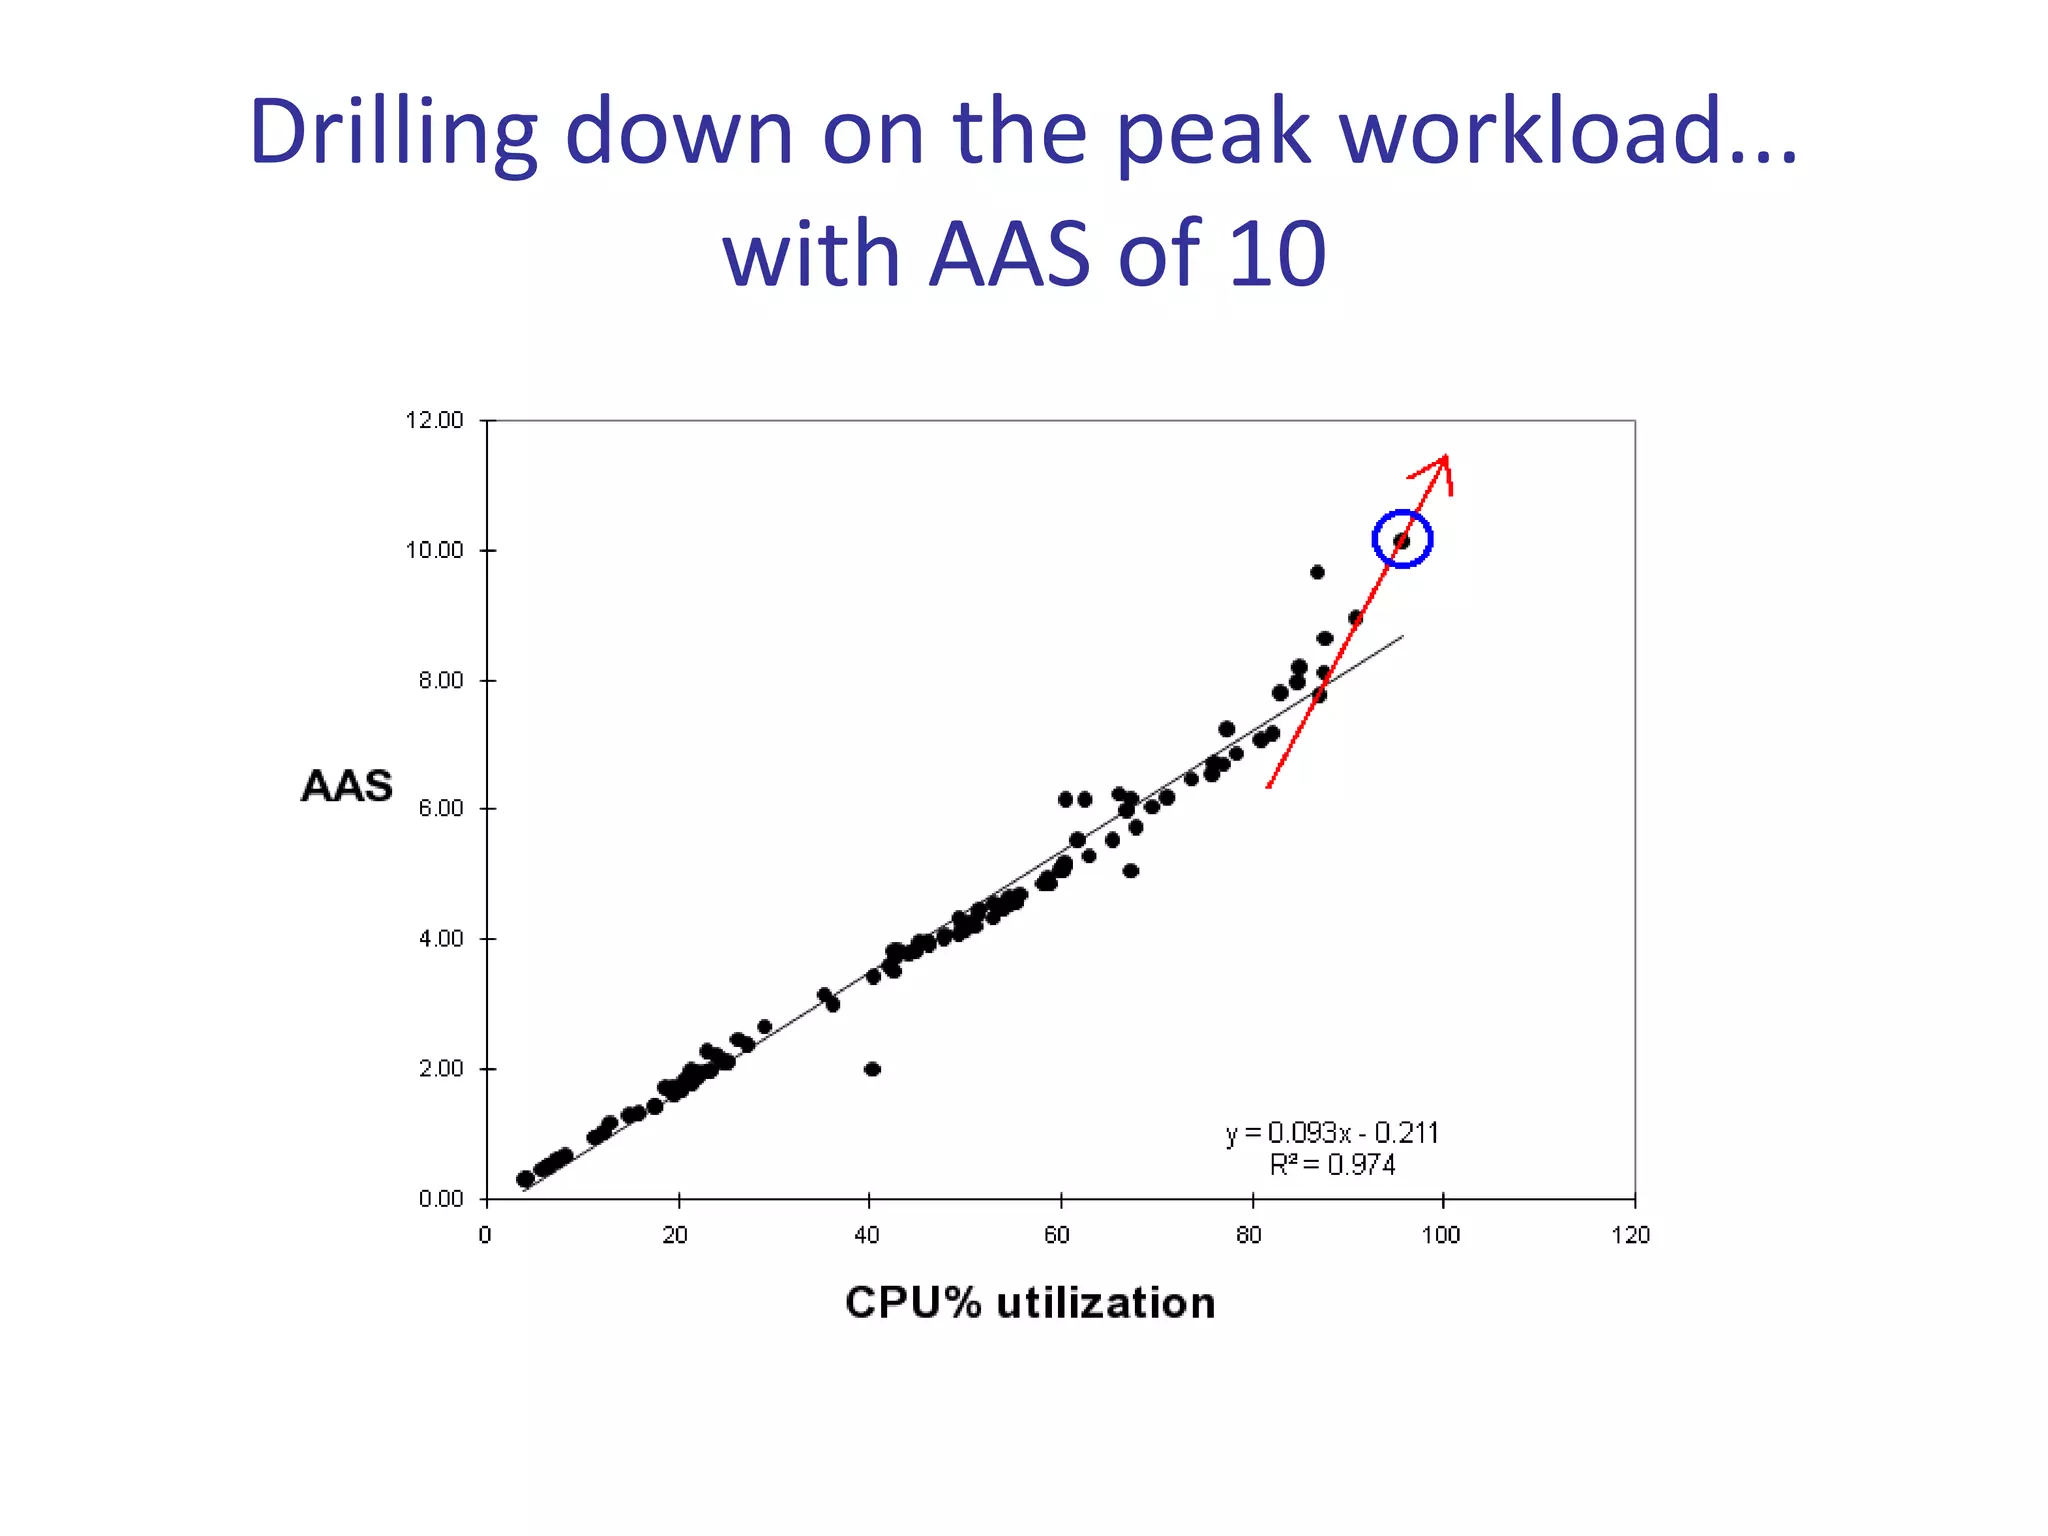
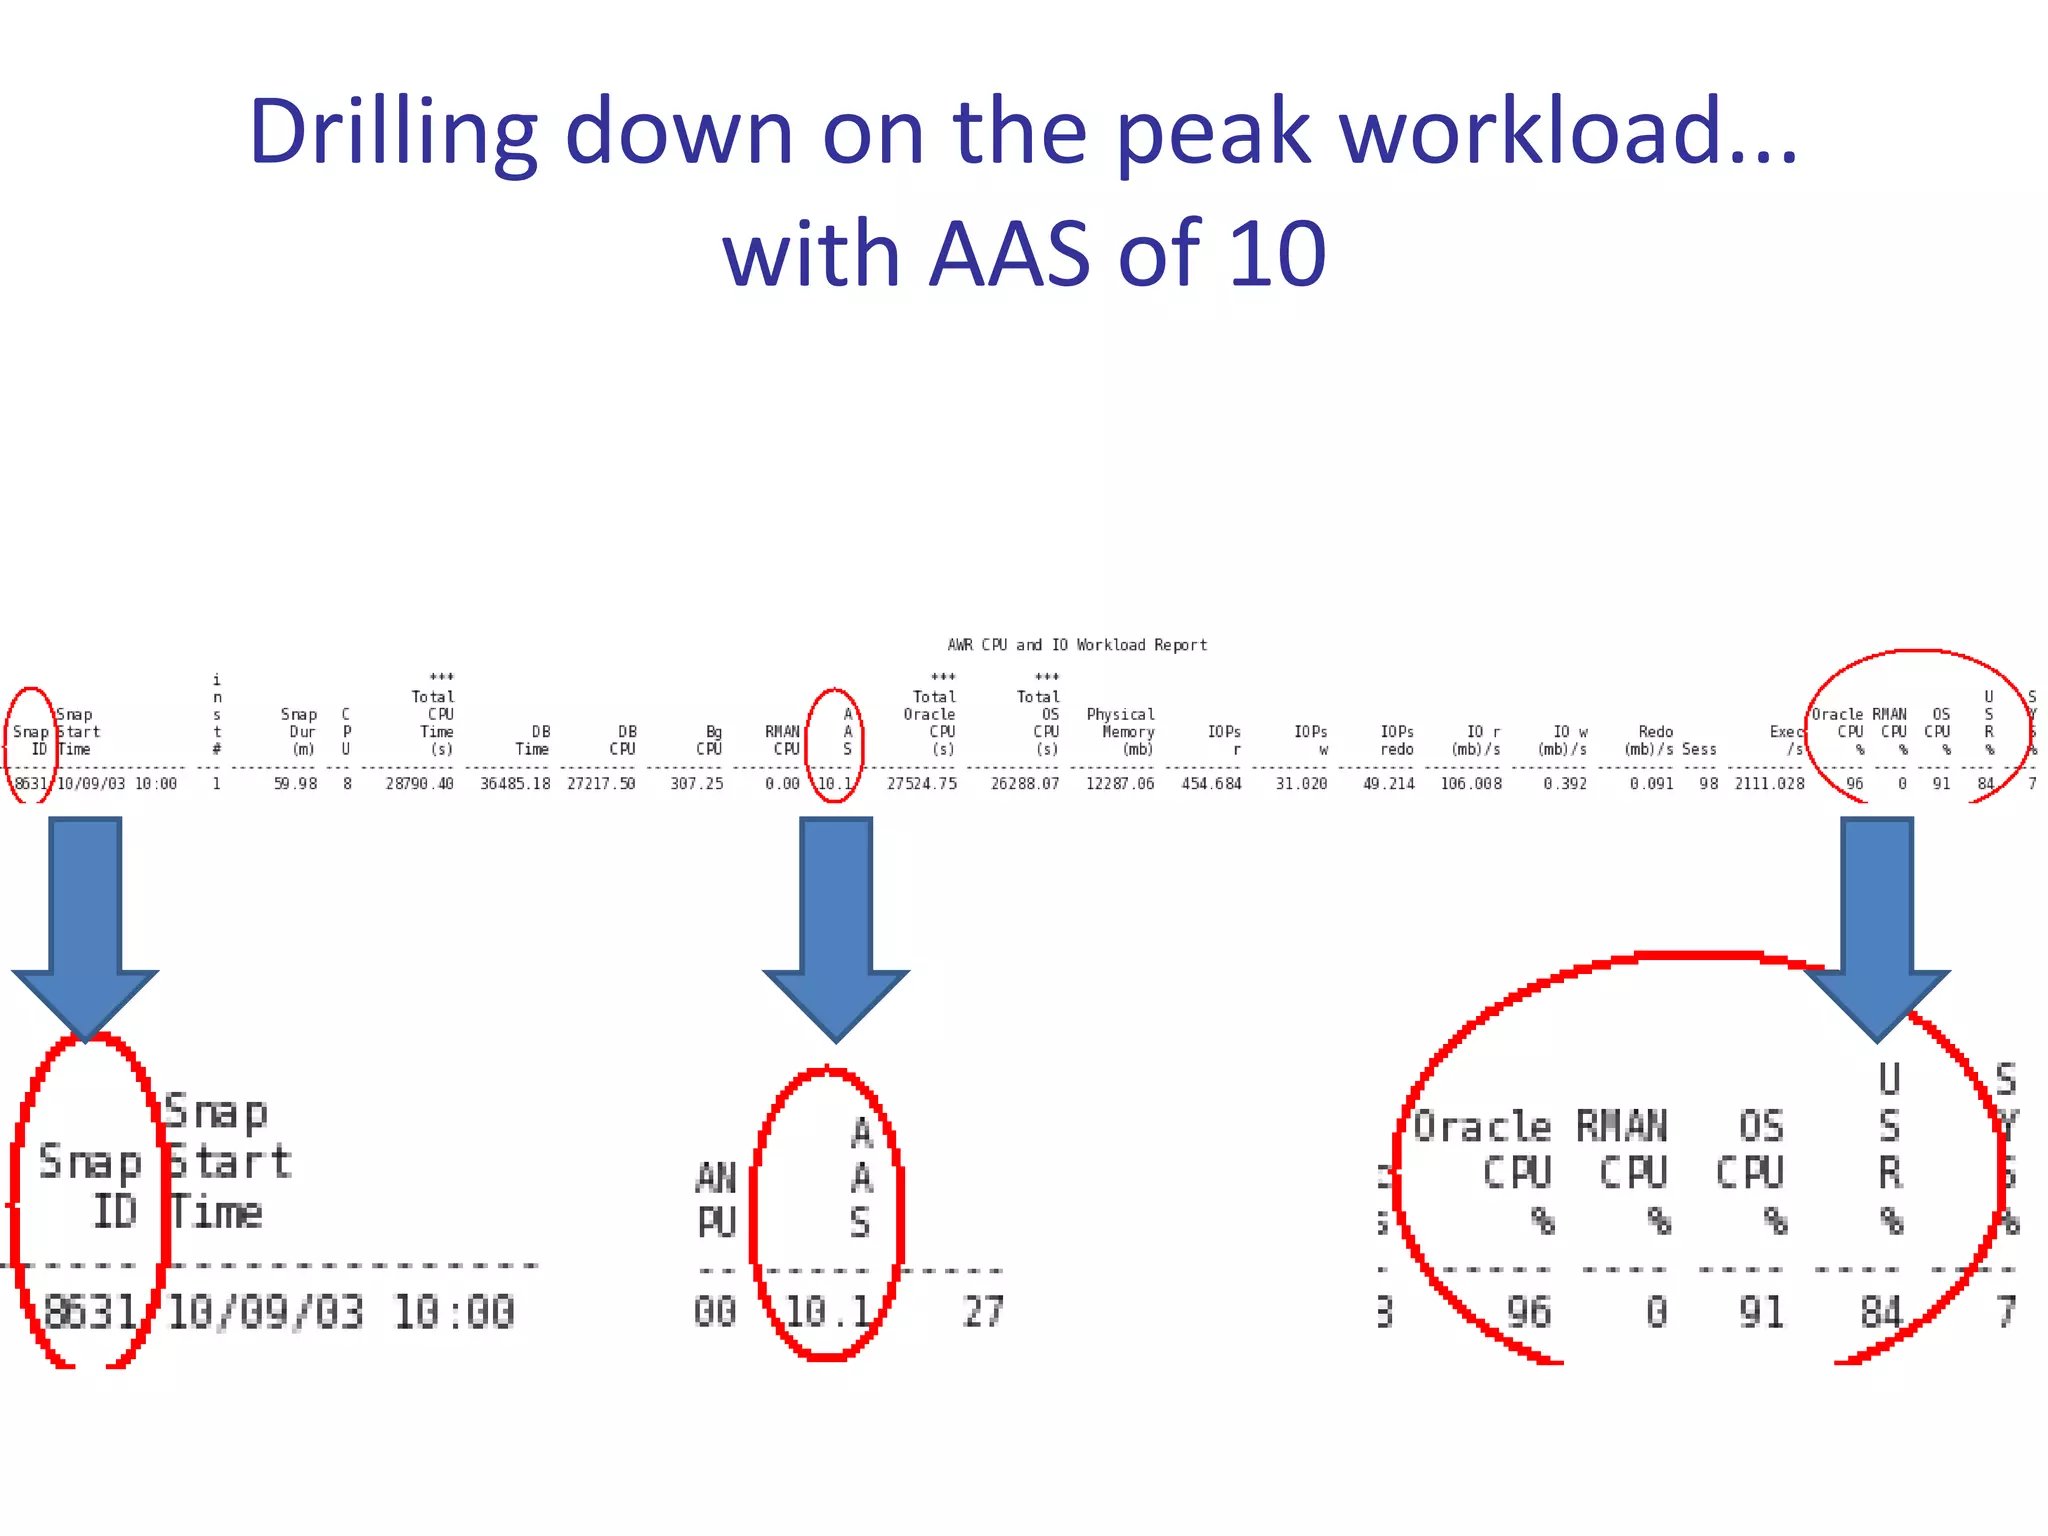
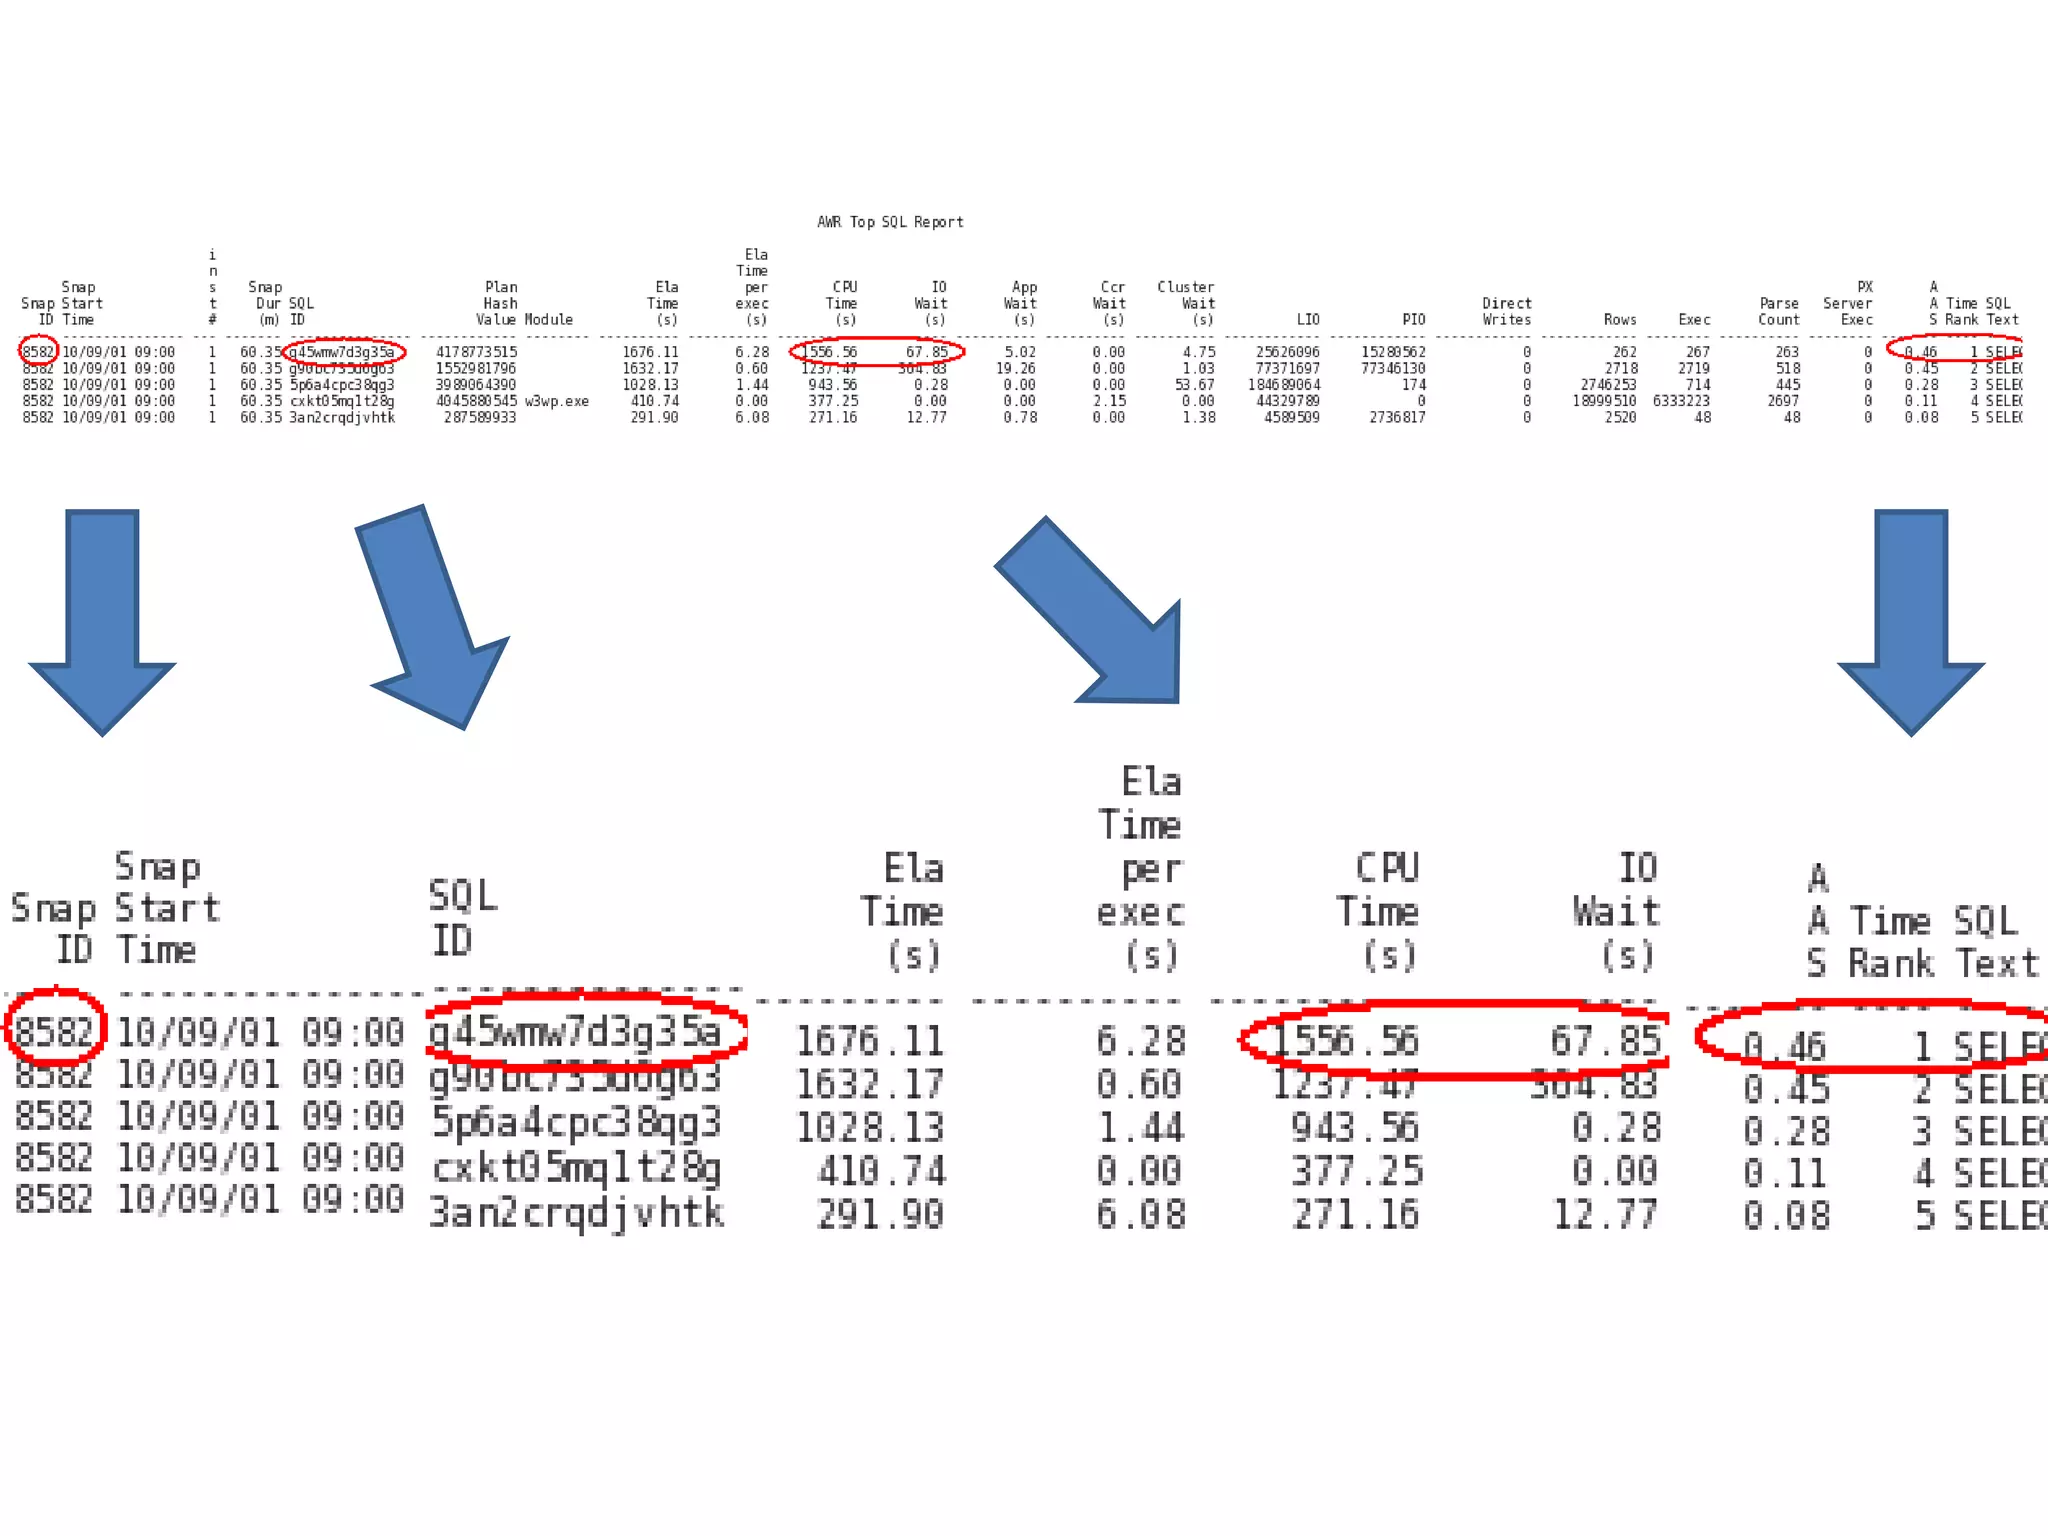

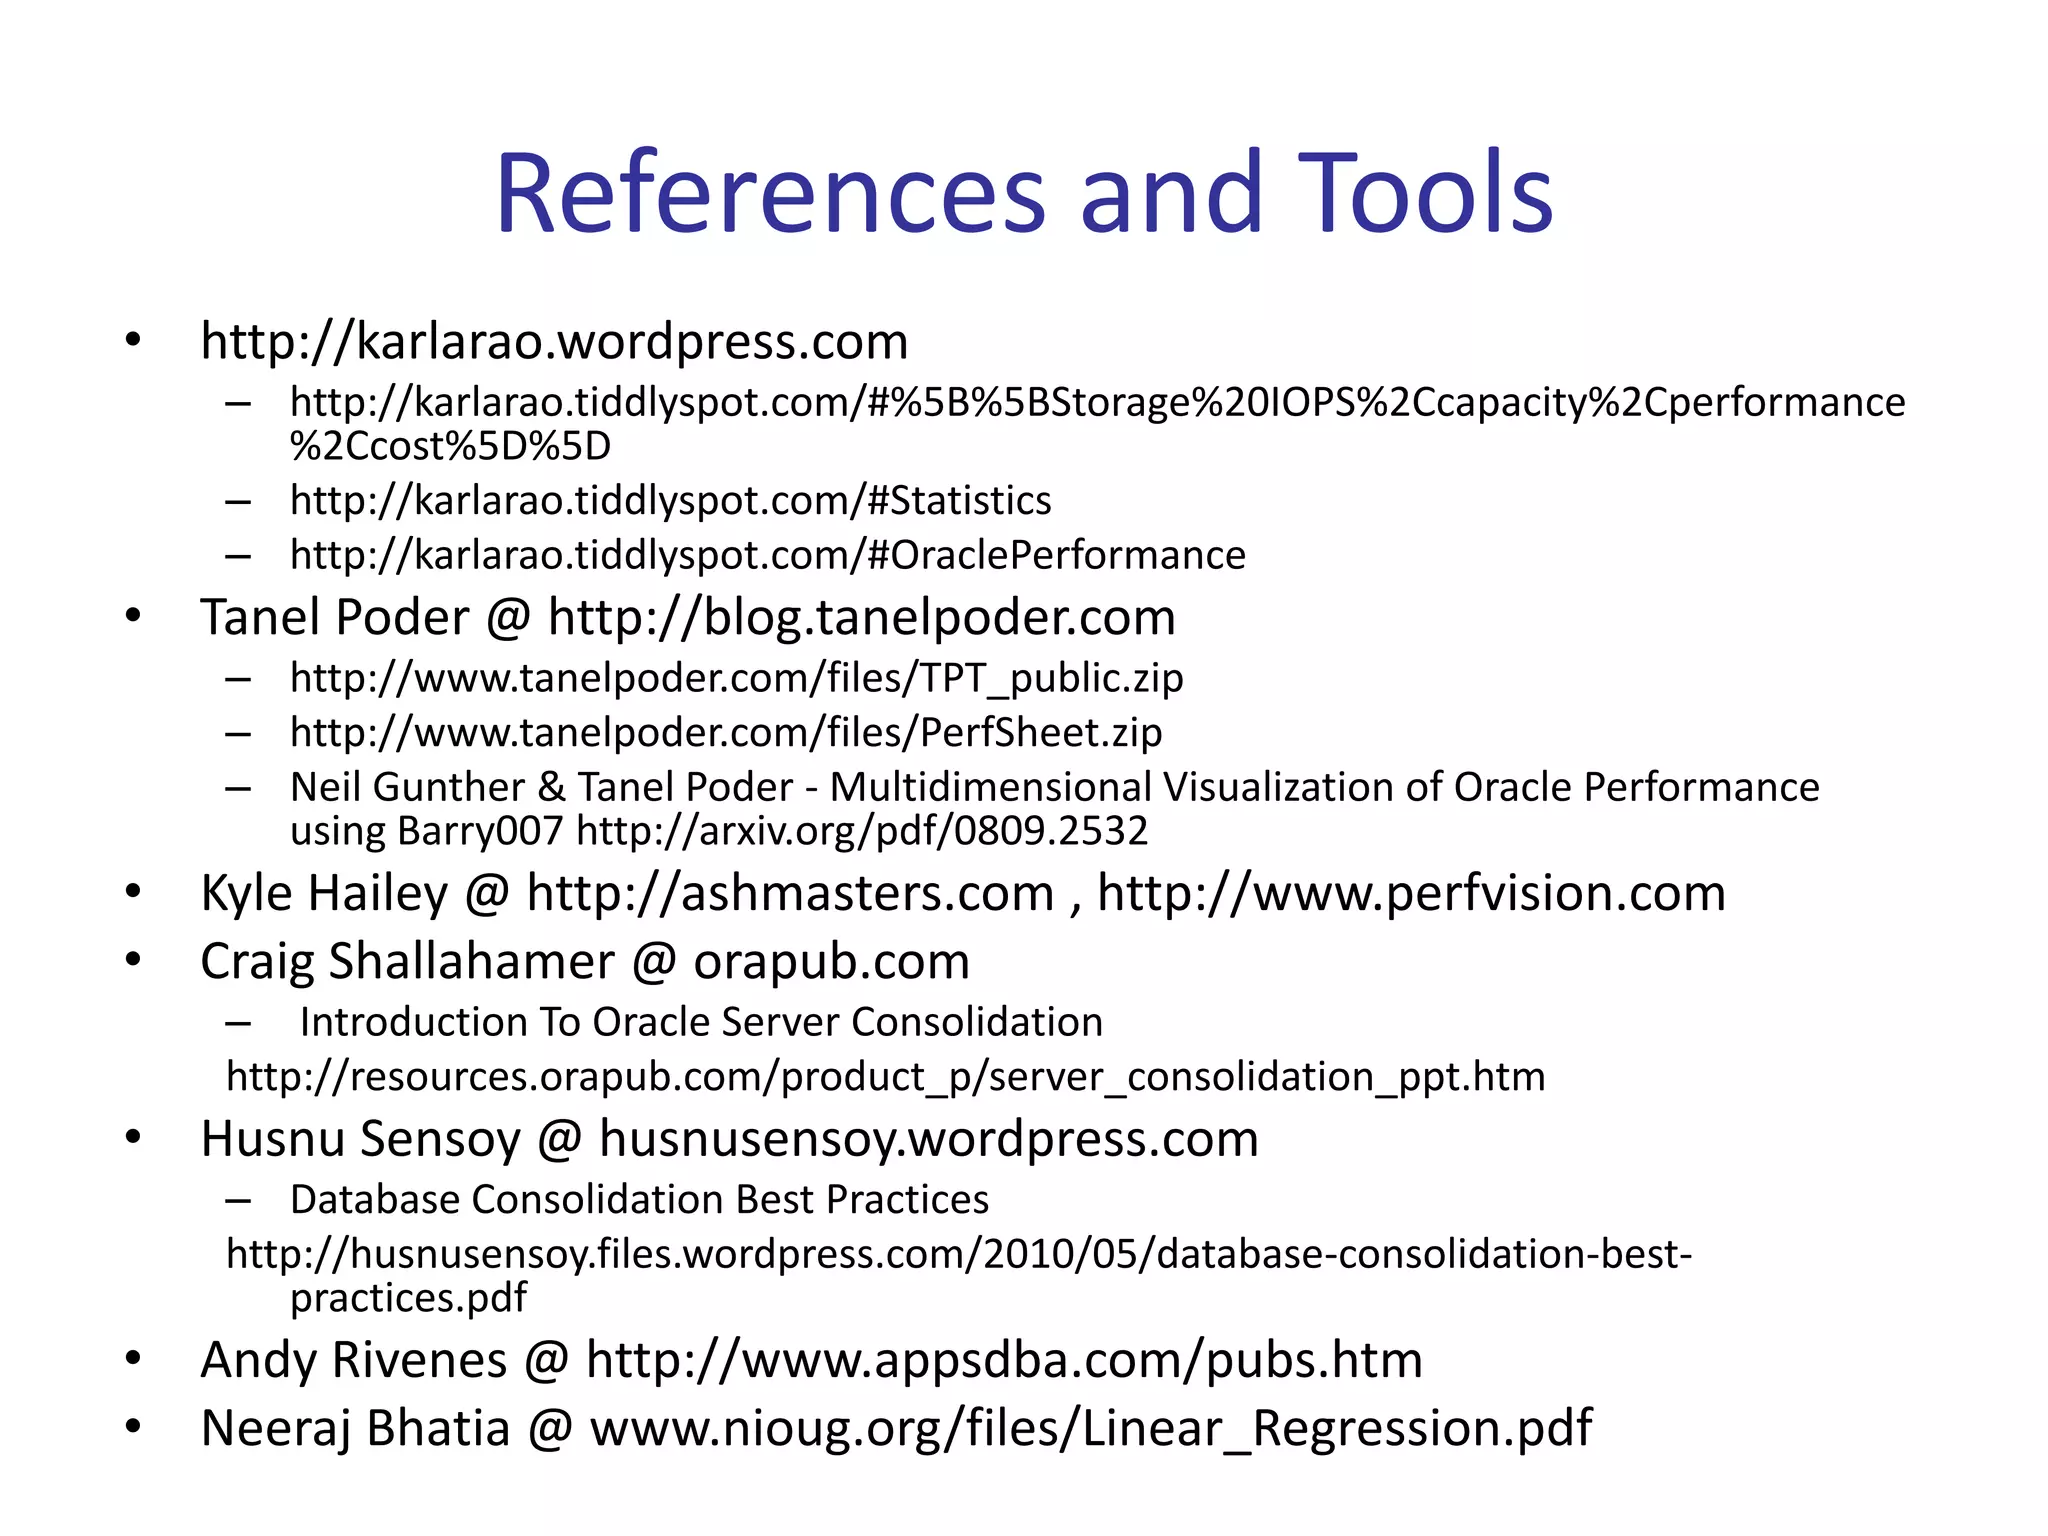


The document discusses mining the Automatic Workload Repository (AWR) in Oracle databases for capacity planning, visualization, and other real-world uses. It introduces Karl Arao as a speaker and discusses topics he will cover including AWR, diagnosing performance issues using AWR data, visualization of AWR data, capacity planning, and tools for working with AWR data like scripts and linear regression. References and resources on working with AWR are also provided.


![[DBA]_HiramFleitas_SQL_PASS_Summit_2017_Summary](https://cdn.slidesharecdn.com/ss_thumbnails/dbahiramfleitassqlpasssummit2017summary-180202201153-thumbnail.jpg?width=640&height=640&fit=bounds)


![Vibe Coding vs. Spec-Driven Development [Free Meetup]](https://cdn.slidesharecdn.com/ss_thumbnails/vibecodingvsspecdrivendevelopment-251209105622-43f455e7-thumbnail.jpg?width=640&height=640&fit=bounds)
