Download as PDF, PPTX
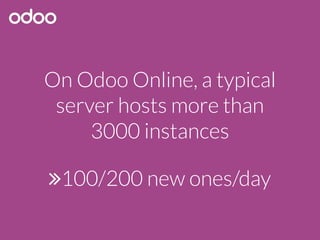

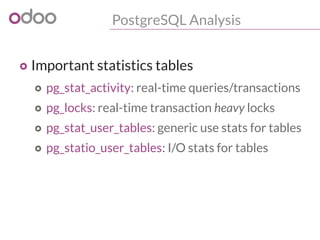
![PostgreSQL
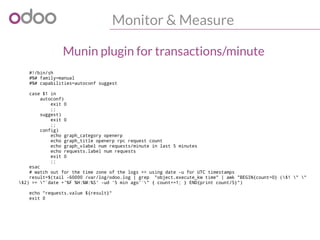
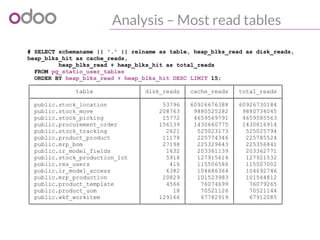
o Is the real workhorse of your Odoo server
o Powers large cloud services
o Can handle terabytes of data efficiently
o Should be fine-tuned to use your hardware
o Cannot magically fix algorithmic/complexity
issues in [y]our code!](https://image.slidesharecdn.com/performance2014-140610045013-phpapp01/85/Improving-the-performance-of-Odoo-deployments-8-320.jpg)
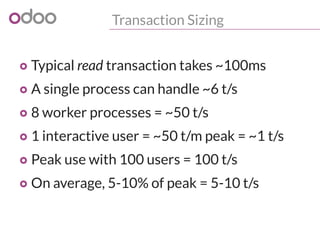


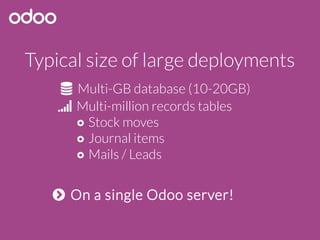
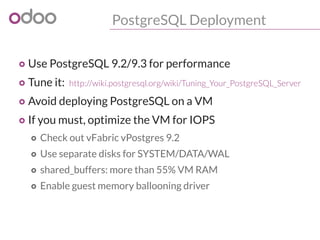
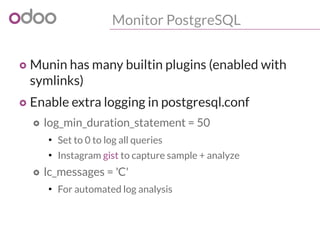
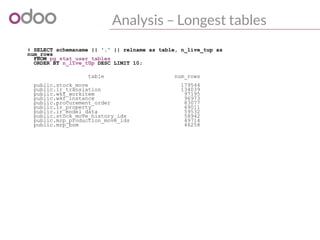
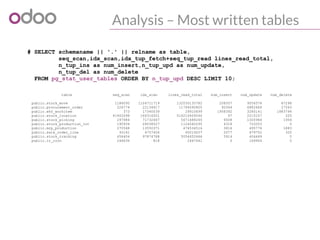
![Deployment Architecture
Single server, multi-process
PostgreSQL
Store
HTTP worker
HTTP worker
HTTP worker
Cron worker
gevent worker
Requests
Rule of thumb: --workers=$[1+$CORES*2]](https://image.slidesharecdn.com/performance2014-140610045013-phpapp01/85/Improving-the-performance-of-Odoo-deployments-15-320.jpg)


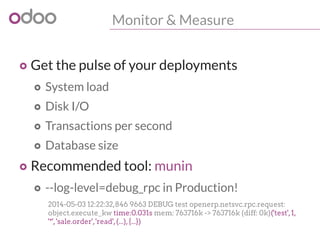
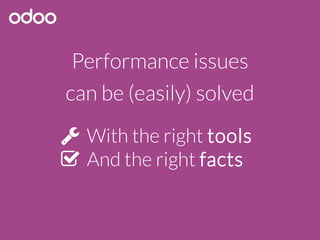
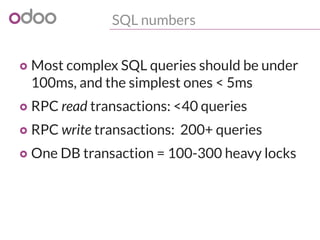
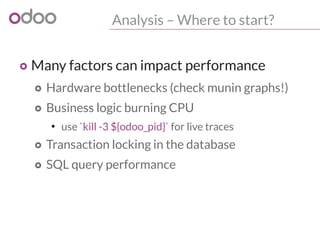
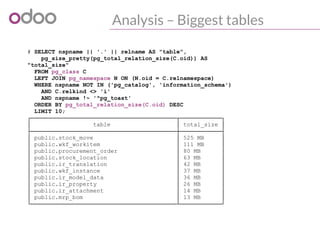
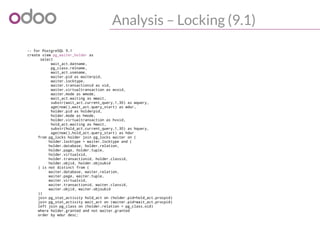
![Monitor & Measure
#!/bin/sh
#%# family=manual
#%# capabilities=autoconf suggest
case $1 in
config)
echo graph_category openerp
echo graph_title openerp rpc requests min/average response time
echo graph_vlabel seconds
echo graph_args --units-exponent -3
echo min.label min
echo min.warning 1
echo min.critical 5
echo avg.label average
echo avg.warning 1
echo avg.critical 5
exit 0
;;
esac
# watch out for the time zone of the logs => using date -u for UTC timestamps
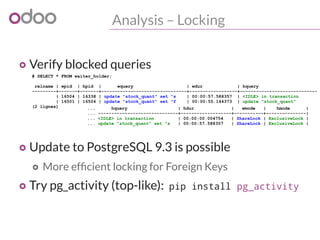
result=$(tail -60000 /var/log/openerp.log | grep "object.execute_kw time" | awk "BEGIN{sum=0;count=0} (
$1 " " $2) >= "`date +'%F %H:%M:%S' -ud '5 min ago'`" {split($8,t,":");time=0+t[2];if (min=="")
{ min=time}; sum += time; count+=1; min=(time>min)?min:time } END{print min, sum/count}")
echo -n "min.value "
echo ${result} | cut -d" " -f1
echo -n "avg.value "
echo ${result} | cut -d" " -f2
exit 0
Munin plugin for response time](https://image.slidesharecdn.com/performance2014-140610045013-phpapp01/85/Improving-the-performance-of-Odoo-deployments-23-320.jpg)

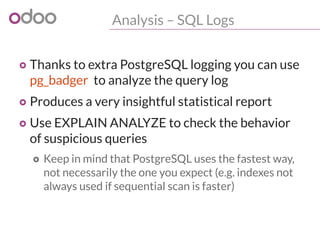
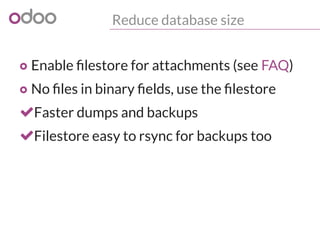
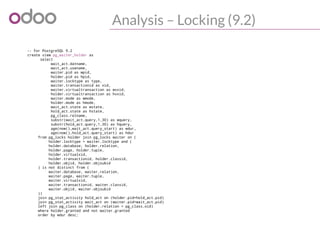

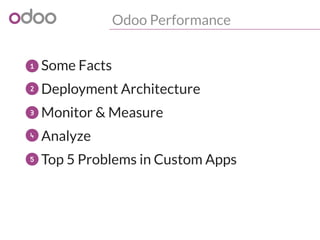
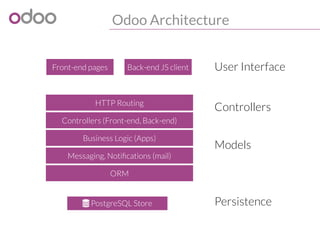
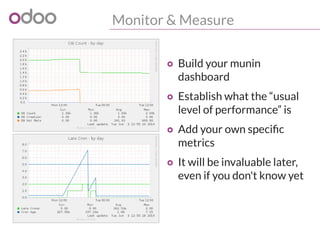
![1. Stored computed fields
o Be vary careful when you add stored computed fields
(using the old API)
o Manually set the right trigger fields + func
store = {'trigger_model': (mapping_function,
[fields...],
priority) }
store = True is a shortcut for:
{self._name: (lambda s,c,u,ids,c: ids,
None,10)}
o Do not add this on master data (products, locations,
users, companies, etc.)](https://image.slidesharecdn.com/performance2014-140610045013-phpapp01/85/Improving-the-performance-of-Odoo-deployments-39-320.jpg)
![2. Domain evaluation strategy
o Odoo cross-object domain expressions do not use
JOINs by default, to respect modularity and ACLs
o e.g. search([('picking_id.move_ids.partner_id', '!=', False)])
o Searches all moves without partner!
o Then uses “ id IN <found_move_ids>”!
o Imagine this in record rules (global security filter)
o Have a look at auto_join (v7.0+)
'move_ids': fields.one2many('stock.move', 'picking_id',
string='Moves', auto_join=True)](https://image.slidesharecdn.com/performance2014-140610045013-phpapp01/85/Improving-the-performance-of-Odoo-deployments-40-320.jpg)


The document discusses optimizing Odoo performance with high data volumes, emphasizing the importance of PostgreSQL in managing transactions and data effectively. It provides hardware recommendations, architectural setups, and monitoring strategies to resolve potential performance issues. Additionally, it highlights frequent problems in custom apps and suggests best practices for deployment and transaction management.