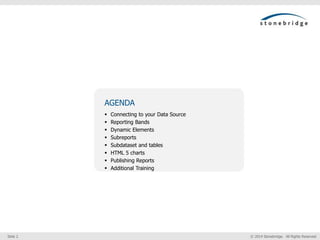
Tibco Jaspersoft Studio
Quick Start Guide
Date 1-6-15
Jeff.Rix@sbti.com
832-506-9972
© 2014 Stonebridge. All Rights Reserved.Slide 2
AGENDA
 Connecting to your Data Source
 Reporting Bands
 Dynamic Elements
 Subreports
 Subdataset and tables
 HTML 5 charts
 Publishing Reports
 Additional Training
© 2014 Stonebridge. All Rights Reserved.Slide 3
Data Sources
Data Adapters - connecting to a variety of
data sources shown below.
Servers - This is your connection to the
Jaspersoft Report Server. You connect to the url
and provide the username and password.
Explaining the data source connections
In the Repository viewer there are Data Adapters and Servers
© 2014 Stonebridge. All Rights Reserved.Slide 4
Report Bands
Outline View
 To review or change the Data Source right
click the report name in the Outline view and
choose ‘Data Set and Query…’
 To add a sub data set right click the report
name in the Outline view and choose ‘Create
Dataset’. Table elements must use a
subquery.
 Your columns are available under the field
list.
 Your dynamic elements (Parameters and Sort
fields) are shown in the outline view.
 To disable something delete it and it will
‘grey’ out. To enable it again undo delete.
Add a Report and Explore the Project,Explorer view, Outline view, and Report Bands.
• In the Project Explorer Create a Project (JasperReports Project) and then create your report
(JasperReports > A4).
• When you are in the new Report Wizard choose the correct data adapter and enter your SQL
command. Click Read fields. It is better to do all aggregations and grouping in the SQL command as
opposed to the Grouping wizard and aggregate expressions.
• Throughout the training, when we refer to reports we are always referencing the .jrxml report in the
project explorer not the .jasper report.
Create a report
Report Bands
1. Title
2. Page Header
3. Column Header
4. Detail 1 [125px] – To create an aditional
Detail Band right click the Detail 1 band
and click ‘Add Band’.
5. Column footer
6. Page footer
7. Summary
© 2014 Stonebridge. All Rights Reserved.Slide 5
Dynamic Elements
Parameters
 Parameters allow you to
run a subset of your data.
 Right click Parameters in
the outline view and click
‘Create Parameter’. Make
sure the class in the
correct data type.
 Right click the report name
in the outline view and
click ‘Dataset and Query…’.
 Now add a where clause
where a value is equal to
the parameter. Ie. Where
Parameter =
$P{Parameter}
 Parameter multiselect is =
$X{In,fieldname,PARAMNA
ME}
Variables
 Variables are calculated
values.
 Variables are
referenced using the
$V{} syntax.
 When you add a
measure into the
summary band you will
have a TextField wizard
appear where you
select the appropriate
calculation (i.e.
sum,first, avg,
count,…etc). This
automatically creates a
variable.
Parameters, Variables, and Expressions
Expressions
 Languages for
expressions are Groovy
(default), Java,
Javascript, and Bsh. The
language is part of the
report property.
 Bands have print when
expressions.
 Excel like “built in”
functions simplify writing
expressions.
 In the summary we
create a variable with
count. If we only want to
count males we would
use this expression in the
variable property.
If($f{gender}==“M”,1,0)
© 2014 Stonebridge. All Rights Reserved.Slide 6
Subreports
Create Main
Report
Create Sub report
Add Parameter to
Sub report. Add
where clause =
$P{} to SQL
Add Sub Report
Element To Main
Report in the
appropriate Band.
Link Field from
Main Report to
the Sub report
Parameter
Overview and best practice
 Includes a separately complied
report in the main report. It
will seem like a single report.
 Subreport will show up in the
appropriate Band. The
expression is the Subreport
specified and the connection
expression is the parameter in
the Subreport.
 The Parameters button
specifies what field in the Main
Report will pass to the
parameter in the Subreport.
Overview Best Practice
© 2014 Stonebridge. All Rights Reserved.Slide 7
Subdataset
Subdataset
 A Sub Data Set is added by right clicking
the outline view and clicking “Create
Dataset”.
 Think of Sub Data Set as just another
way to add a dataset to your report.
 Write your SQL just like the main
dataset.
 Used with tables (only option), crosstabs,
charts, and a few other elements.
 Provide own set of parameters, fields,
variables, groups (used only for
calculation purposes), and query.
 Cannot combine with fields from the
main data set. Use subreports for this
type of functionality.
Tables
 Tables are elements that can only use
sub data set reports.
 The wizard will have you pick your data
set as well as the table columns and
layout.
 Double click on a table to change your
design view to just the table. This will
change the outline view as well.
Subdataset setup and use within a table
© 2014 Stonebridge. All Rights Reserved.Slide 8
HTML 5 Charts
Overview
 Only available in the
commercial edition
 Chart Legend controls display
 Tooltips display measures
 HTML5 chart elements include
Bar, Column, Line, Area,
Spline, Pie, Spider, TimeSeries,
Scatter, Bubble, and Heatmap.
Configuration
 Properties include three tabs:
Chart Properties, Chart Data,
and Hyperlink.
 Use Dataset sub-tap of the
Chart Data tab.
 You can filter using
expressions.
 In the chart data configuration
you can configure Categories,
Gender, and Salary.
How to configure a HTML 5 data chart
© 2014 Stonebridge. All Rights Reserved.Slide 9
Publishing Reports to the JasperReport Server
Publish the Report
1. Save your report
2. Compile your report
3. Publish your report to JasperReports Server.
4. Find the folder you want to publish to. If your redeploying an existing report click
the overwrite checkbox to make it true.
5. On the configure the data Source configure from “Data Source from Repository”.
Find the appropriate JasperServer data source and select it.
6. Run the report on the JasperReports Server to verify that it deployed correctly.
Saving, Compiling, Publishing, and viewing deployed reports in the JasperReport Server
© 2014 Stonebridge. All Rights Reserved.Slide 10
Training
Training
 The website for training is jaspersoft.com/bi-training-center.
 Developing Reports with Jaspersoft Studio is the class you need. The training is 200 dollars
for a month.
 Each topic has an overview, see it, try it, print it, and quiz section.
 The training takes about a day or two to complete.
 Be sure to go into My Account – Cart and cancel the subscription otherwise it will renew in
30 days.
Your subscription should now show terminated.
Additional Training

Jaspersoft Studio Quick Start Guide

  • 1.
    Tibco Jaspersoft Studio QuickStart Guide Date 1-6-15 Jeff.Rix@sbti.com 832-506-9972
  • 2.
    © 2014 Stonebridge.All Rights Reserved.Slide 2 AGENDA  Connecting to your Data Source  Reporting Bands  Dynamic Elements  Subreports  Subdataset and tables  HTML 5 charts  Publishing Reports  Additional Training
  • 3.
    © 2014 Stonebridge.All Rights Reserved.Slide 3 Data Sources Data Adapters - connecting to a variety of data sources shown below. Servers - This is your connection to the Jaspersoft Report Server. You connect to the url and provide the username and password. Explaining the data source connections In the Repository viewer there are Data Adapters and Servers
  • 4.
    © 2014 Stonebridge.All Rights Reserved.Slide 4 Report Bands Outline View  To review or change the Data Source right click the report name in the Outline view and choose ‘Data Set and Query…’  To add a sub data set right click the report name in the Outline view and choose ‘Create Dataset’. Table elements must use a subquery.  Your columns are available under the field list.  Your dynamic elements (Parameters and Sort fields) are shown in the outline view.  To disable something delete it and it will ‘grey’ out. To enable it again undo delete. Add a Report and Explore the Project,Explorer view, Outline view, and Report Bands. • In the Project Explorer Create a Project (JasperReports Project) and then create your report (JasperReports > A4). • When you are in the new Report Wizard choose the correct data adapter and enter your SQL command. Click Read fields. It is better to do all aggregations and grouping in the SQL command as opposed to the Grouping wizard and aggregate expressions. • Throughout the training, when we refer to reports we are always referencing the .jrxml report in the project explorer not the .jasper report. Create a report Report Bands 1. Title 2. Page Header 3. Column Header 4. Detail 1 [125px] – To create an aditional Detail Band right click the Detail 1 band and click ‘Add Band’. 5. Column footer 6. Page footer 7. Summary
  • 5.
    © 2014 Stonebridge.All Rights Reserved.Slide 5 Dynamic Elements Parameters  Parameters allow you to run a subset of your data.  Right click Parameters in the outline view and click ‘Create Parameter’. Make sure the class in the correct data type.  Right click the report name in the outline view and click ‘Dataset and Query…’.  Now add a where clause where a value is equal to the parameter. Ie. Where Parameter = $P{Parameter}  Parameter multiselect is = $X{In,fieldname,PARAMNA ME} Variables  Variables are calculated values.  Variables are referenced using the $V{} syntax.  When you add a measure into the summary band you will have a TextField wizard appear where you select the appropriate calculation (i.e. sum,first, avg, count,…etc). This automatically creates a variable. Parameters, Variables, and Expressions Expressions  Languages for expressions are Groovy (default), Java, Javascript, and Bsh. The language is part of the report property.  Bands have print when expressions.  Excel like “built in” functions simplify writing expressions.  In the summary we create a variable with count. If we only want to count males we would use this expression in the variable property. If($f{gender}==“M”,1,0)
  • 6.
    © 2014 Stonebridge.All Rights Reserved.Slide 6 Subreports Create Main Report Create Sub report Add Parameter to Sub report. Add where clause = $P{} to SQL Add Sub Report Element To Main Report in the appropriate Band. Link Field from Main Report to the Sub report Parameter Overview and best practice  Includes a separately complied report in the main report. It will seem like a single report.  Subreport will show up in the appropriate Band. The expression is the Subreport specified and the connection expression is the parameter in the Subreport.  The Parameters button specifies what field in the Main Report will pass to the parameter in the Subreport. Overview Best Practice
  • 7.
    © 2014 Stonebridge.All Rights Reserved.Slide 7 Subdataset Subdataset  A Sub Data Set is added by right clicking the outline view and clicking “Create Dataset”.  Think of Sub Data Set as just another way to add a dataset to your report.  Write your SQL just like the main dataset.  Used with tables (only option), crosstabs, charts, and a few other elements.  Provide own set of parameters, fields, variables, groups (used only for calculation purposes), and query.  Cannot combine with fields from the main data set. Use subreports for this type of functionality. Tables  Tables are elements that can only use sub data set reports.  The wizard will have you pick your data set as well as the table columns and layout.  Double click on a table to change your design view to just the table. This will change the outline view as well. Subdataset setup and use within a table
  • 8.
    © 2014 Stonebridge.All Rights Reserved.Slide 8 HTML 5 Charts Overview  Only available in the commercial edition  Chart Legend controls display  Tooltips display measures  HTML5 chart elements include Bar, Column, Line, Area, Spline, Pie, Spider, TimeSeries, Scatter, Bubble, and Heatmap. Configuration  Properties include three tabs: Chart Properties, Chart Data, and Hyperlink.  Use Dataset sub-tap of the Chart Data tab.  You can filter using expressions.  In the chart data configuration you can configure Categories, Gender, and Salary. How to configure a HTML 5 data chart
  • 9.
    © 2014 Stonebridge.All Rights Reserved.Slide 9 Publishing Reports to the JasperReport Server Publish the Report 1. Save your report 2. Compile your report 3. Publish your report to JasperReports Server. 4. Find the folder you want to publish to. If your redeploying an existing report click the overwrite checkbox to make it true. 5. On the configure the data Source configure from “Data Source from Repository”. Find the appropriate JasperServer data source and select it. 6. Run the report on the JasperReports Server to verify that it deployed correctly. Saving, Compiling, Publishing, and viewing deployed reports in the JasperReport Server
  • 10.
    © 2014 Stonebridge.All Rights Reserved.Slide 10 Training Training  The website for training is jaspersoft.com/bi-training-center.  Developing Reports with Jaspersoft Studio is the class you need. The training is 200 dollars for a month.  Each topic has an overview, see it, try it, print it, and quiz section.  The training takes about a day or two to complete.  Be sure to go into My Account – Cart and cancel the subscription otherwise it will renew in 30 days. Your subscription should now show terminated. Additional Training