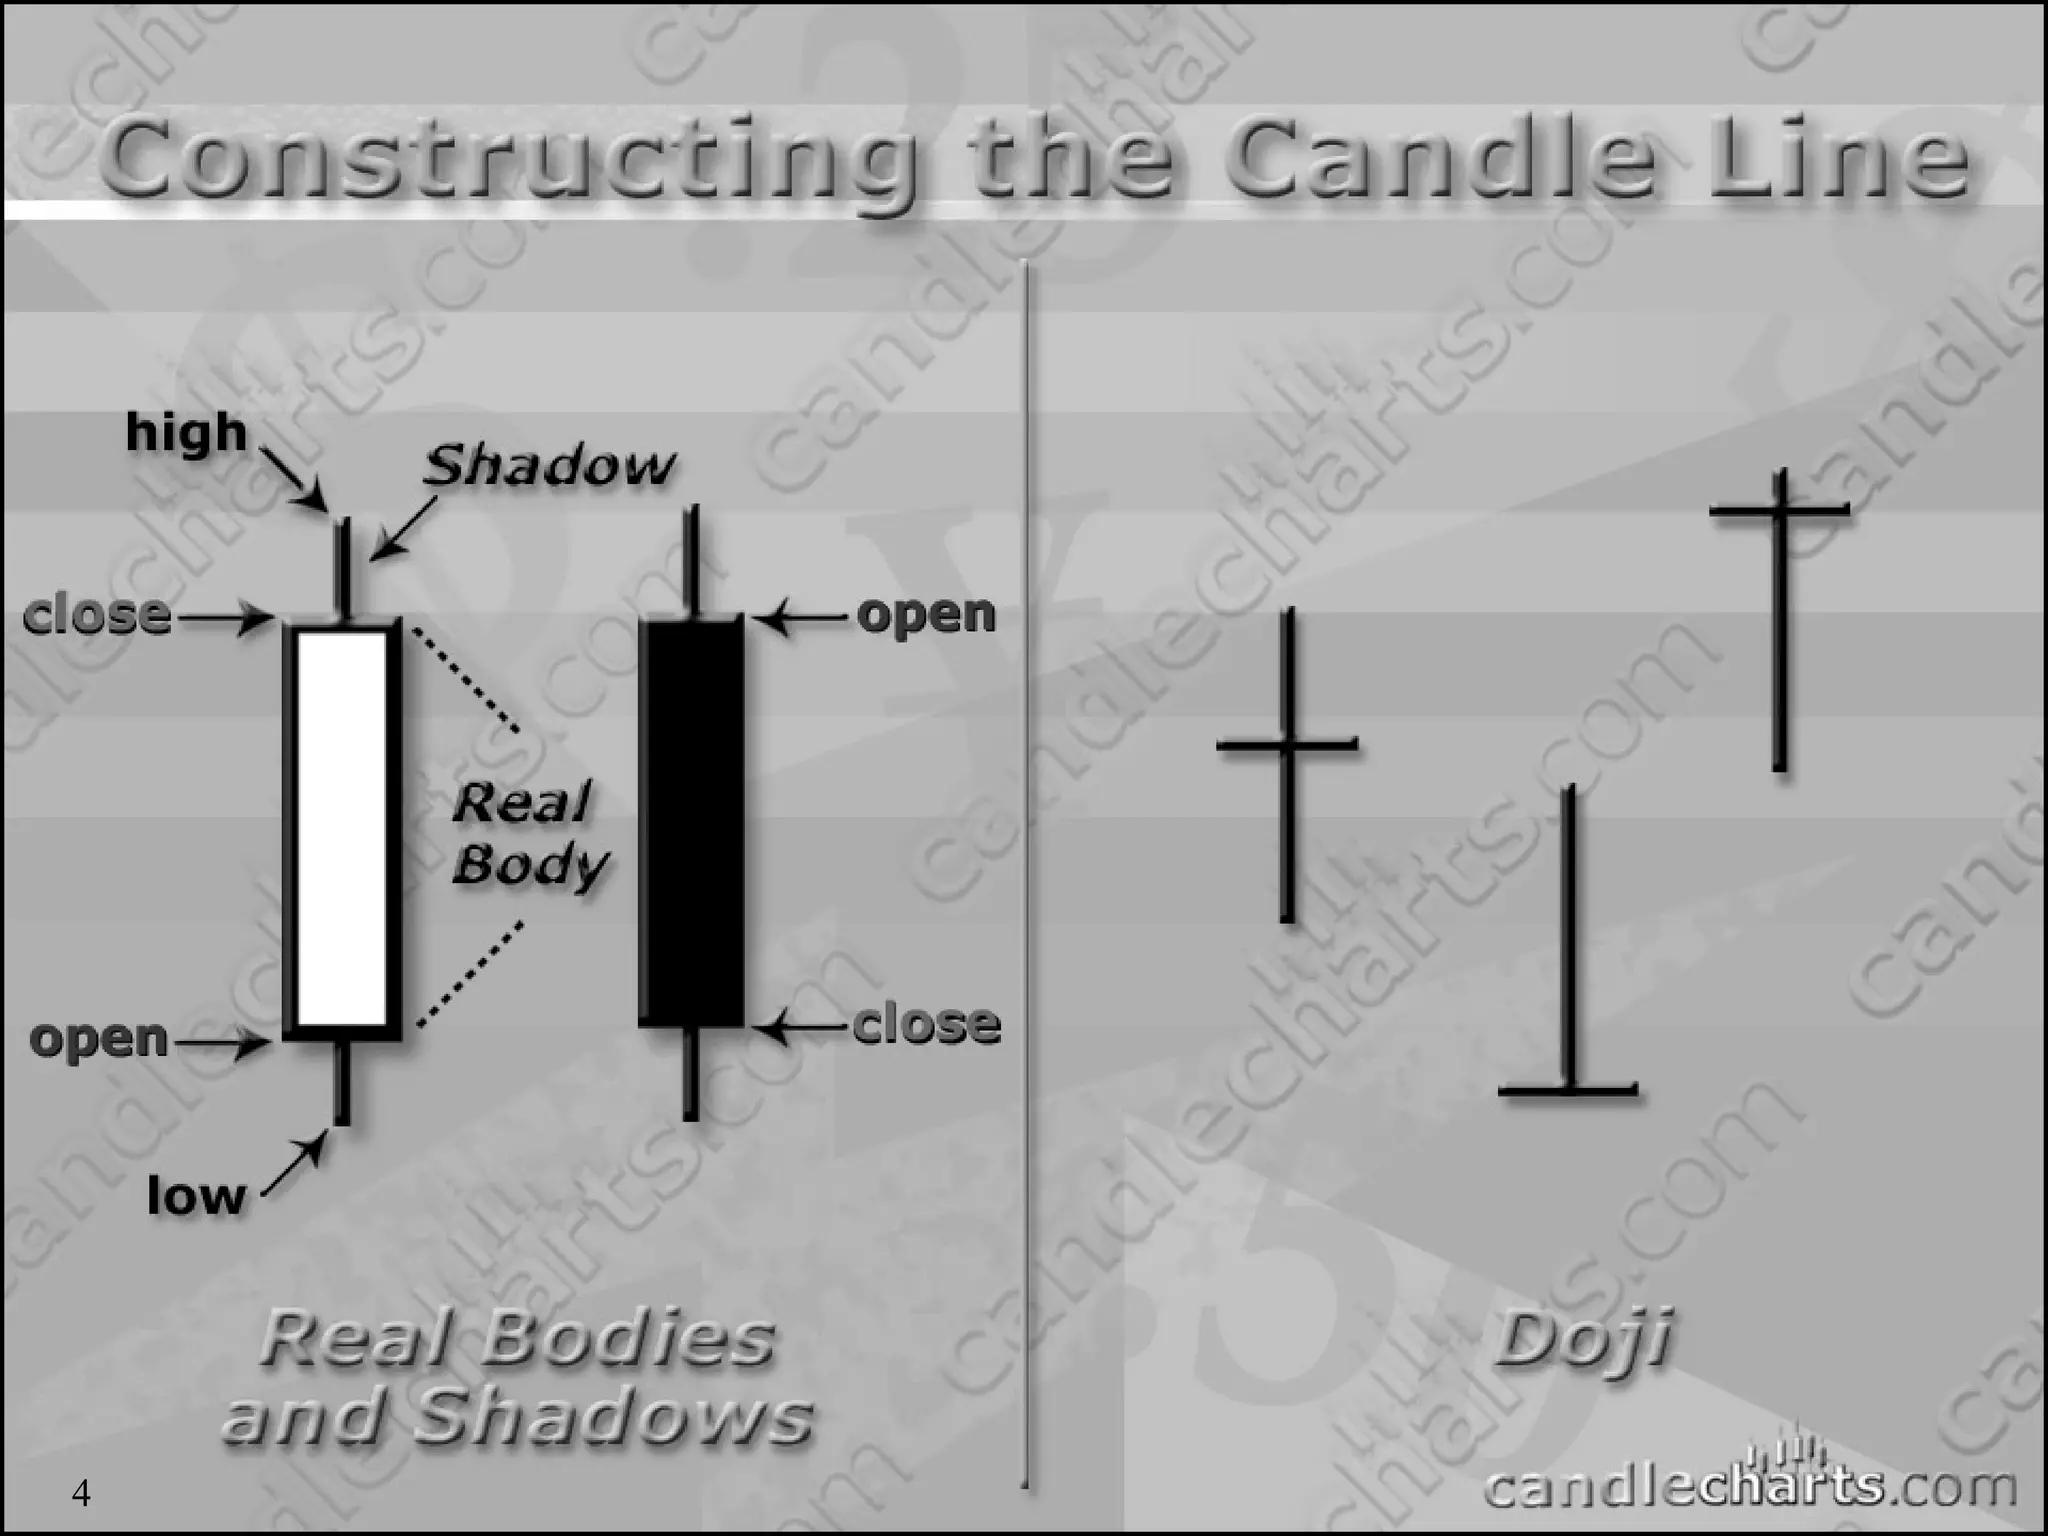
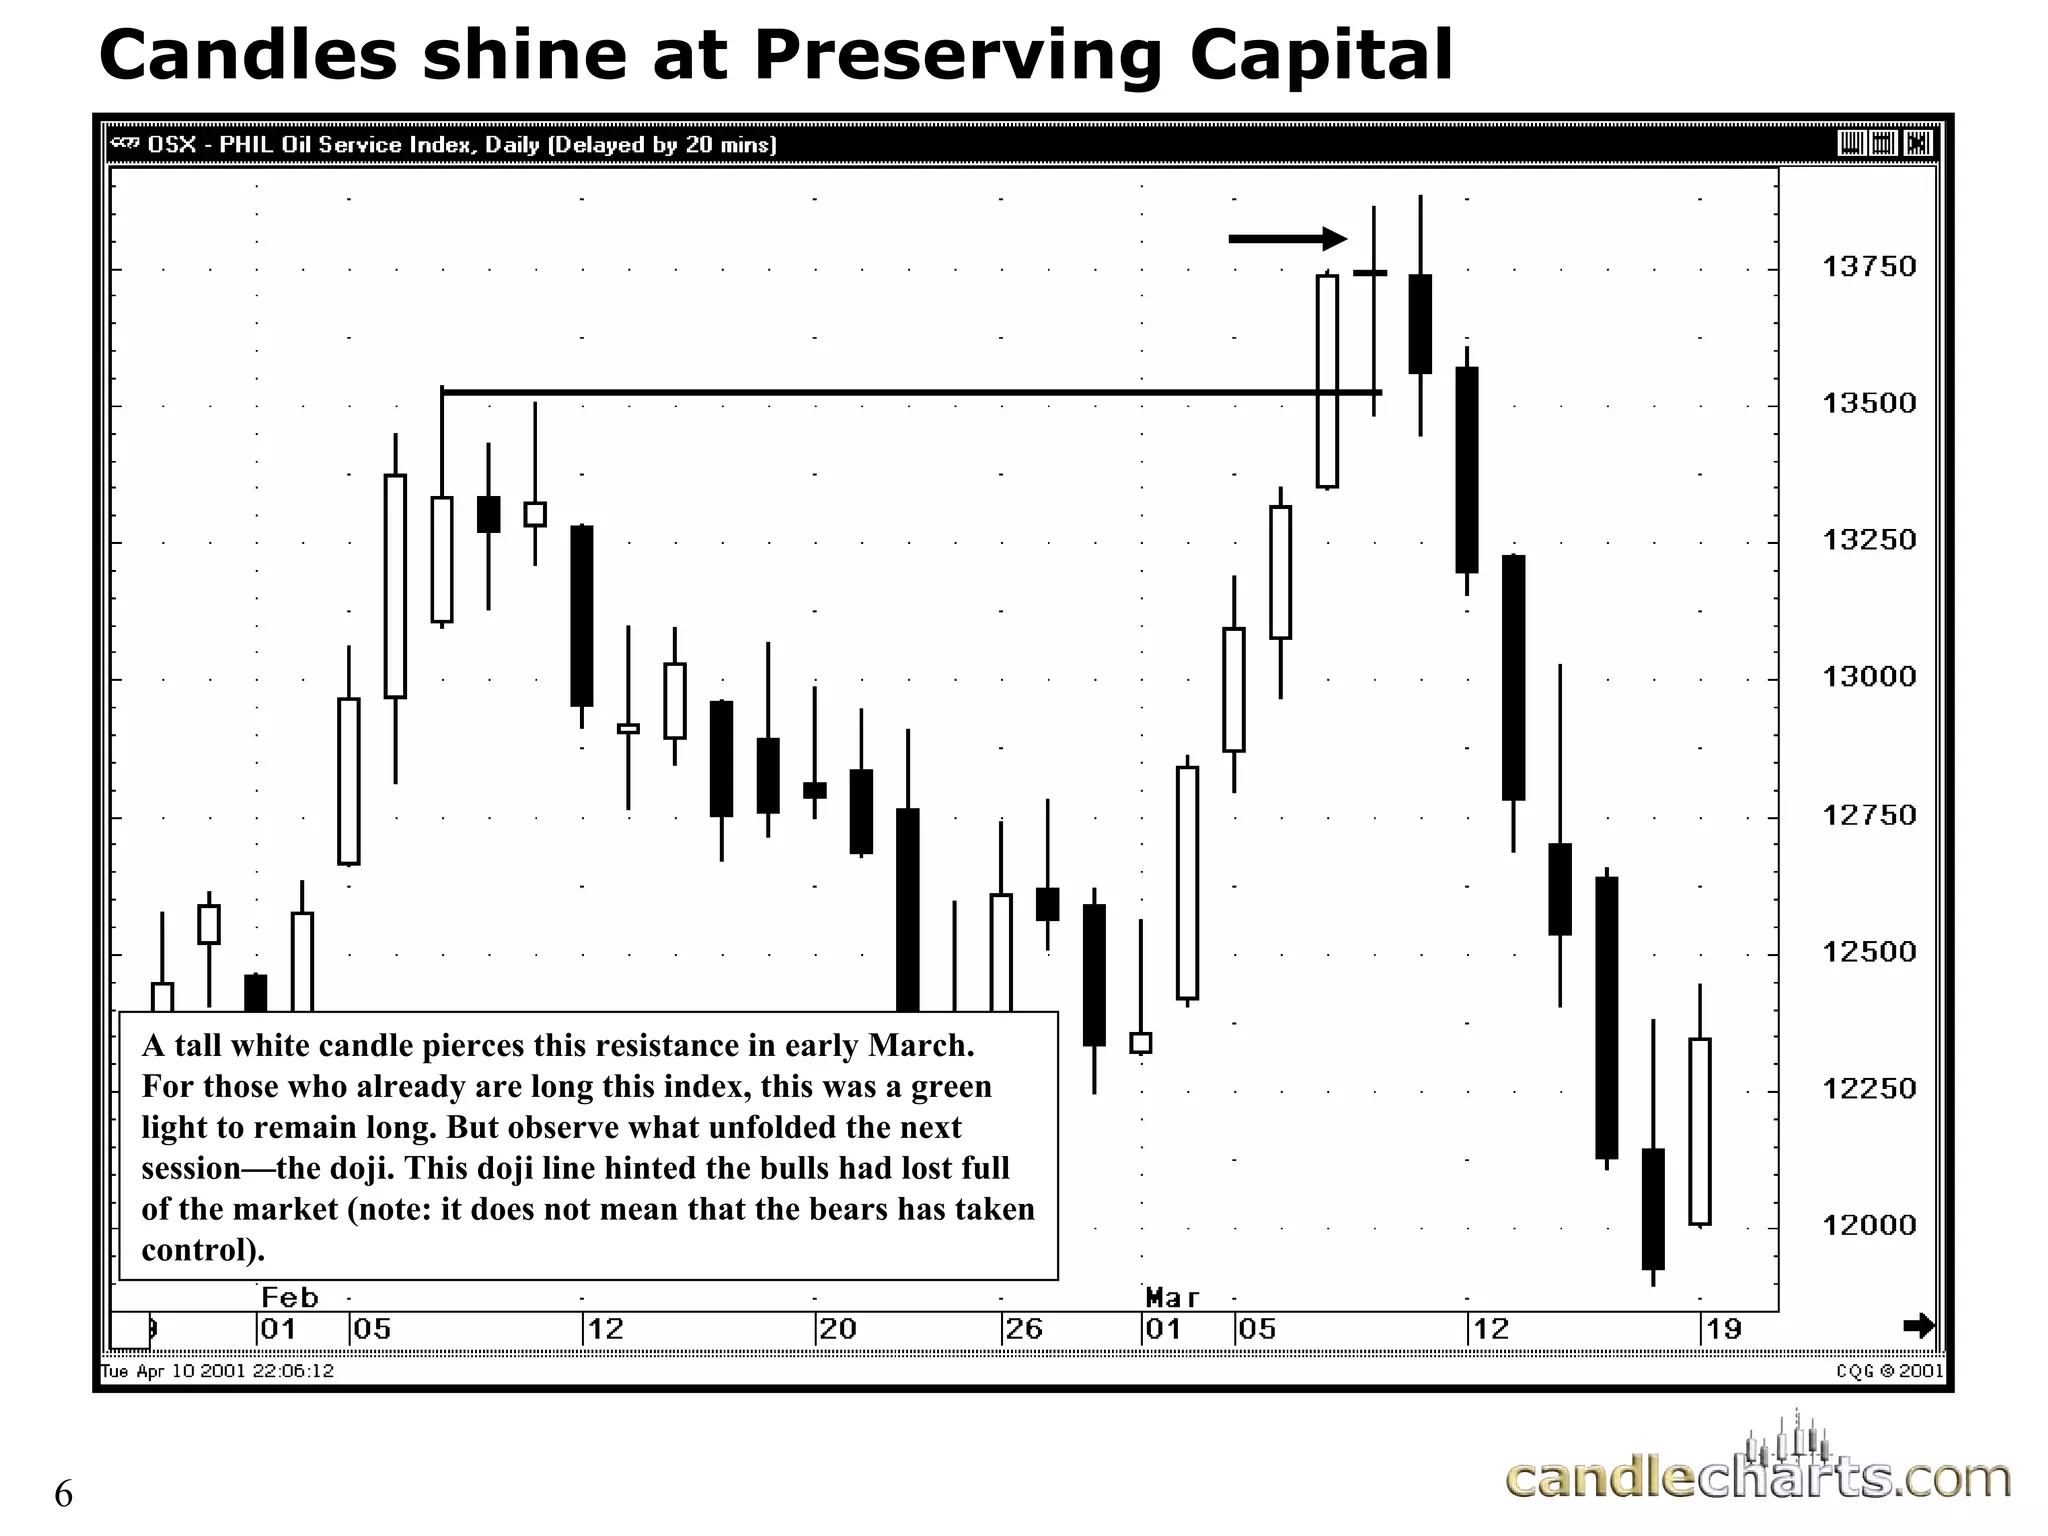
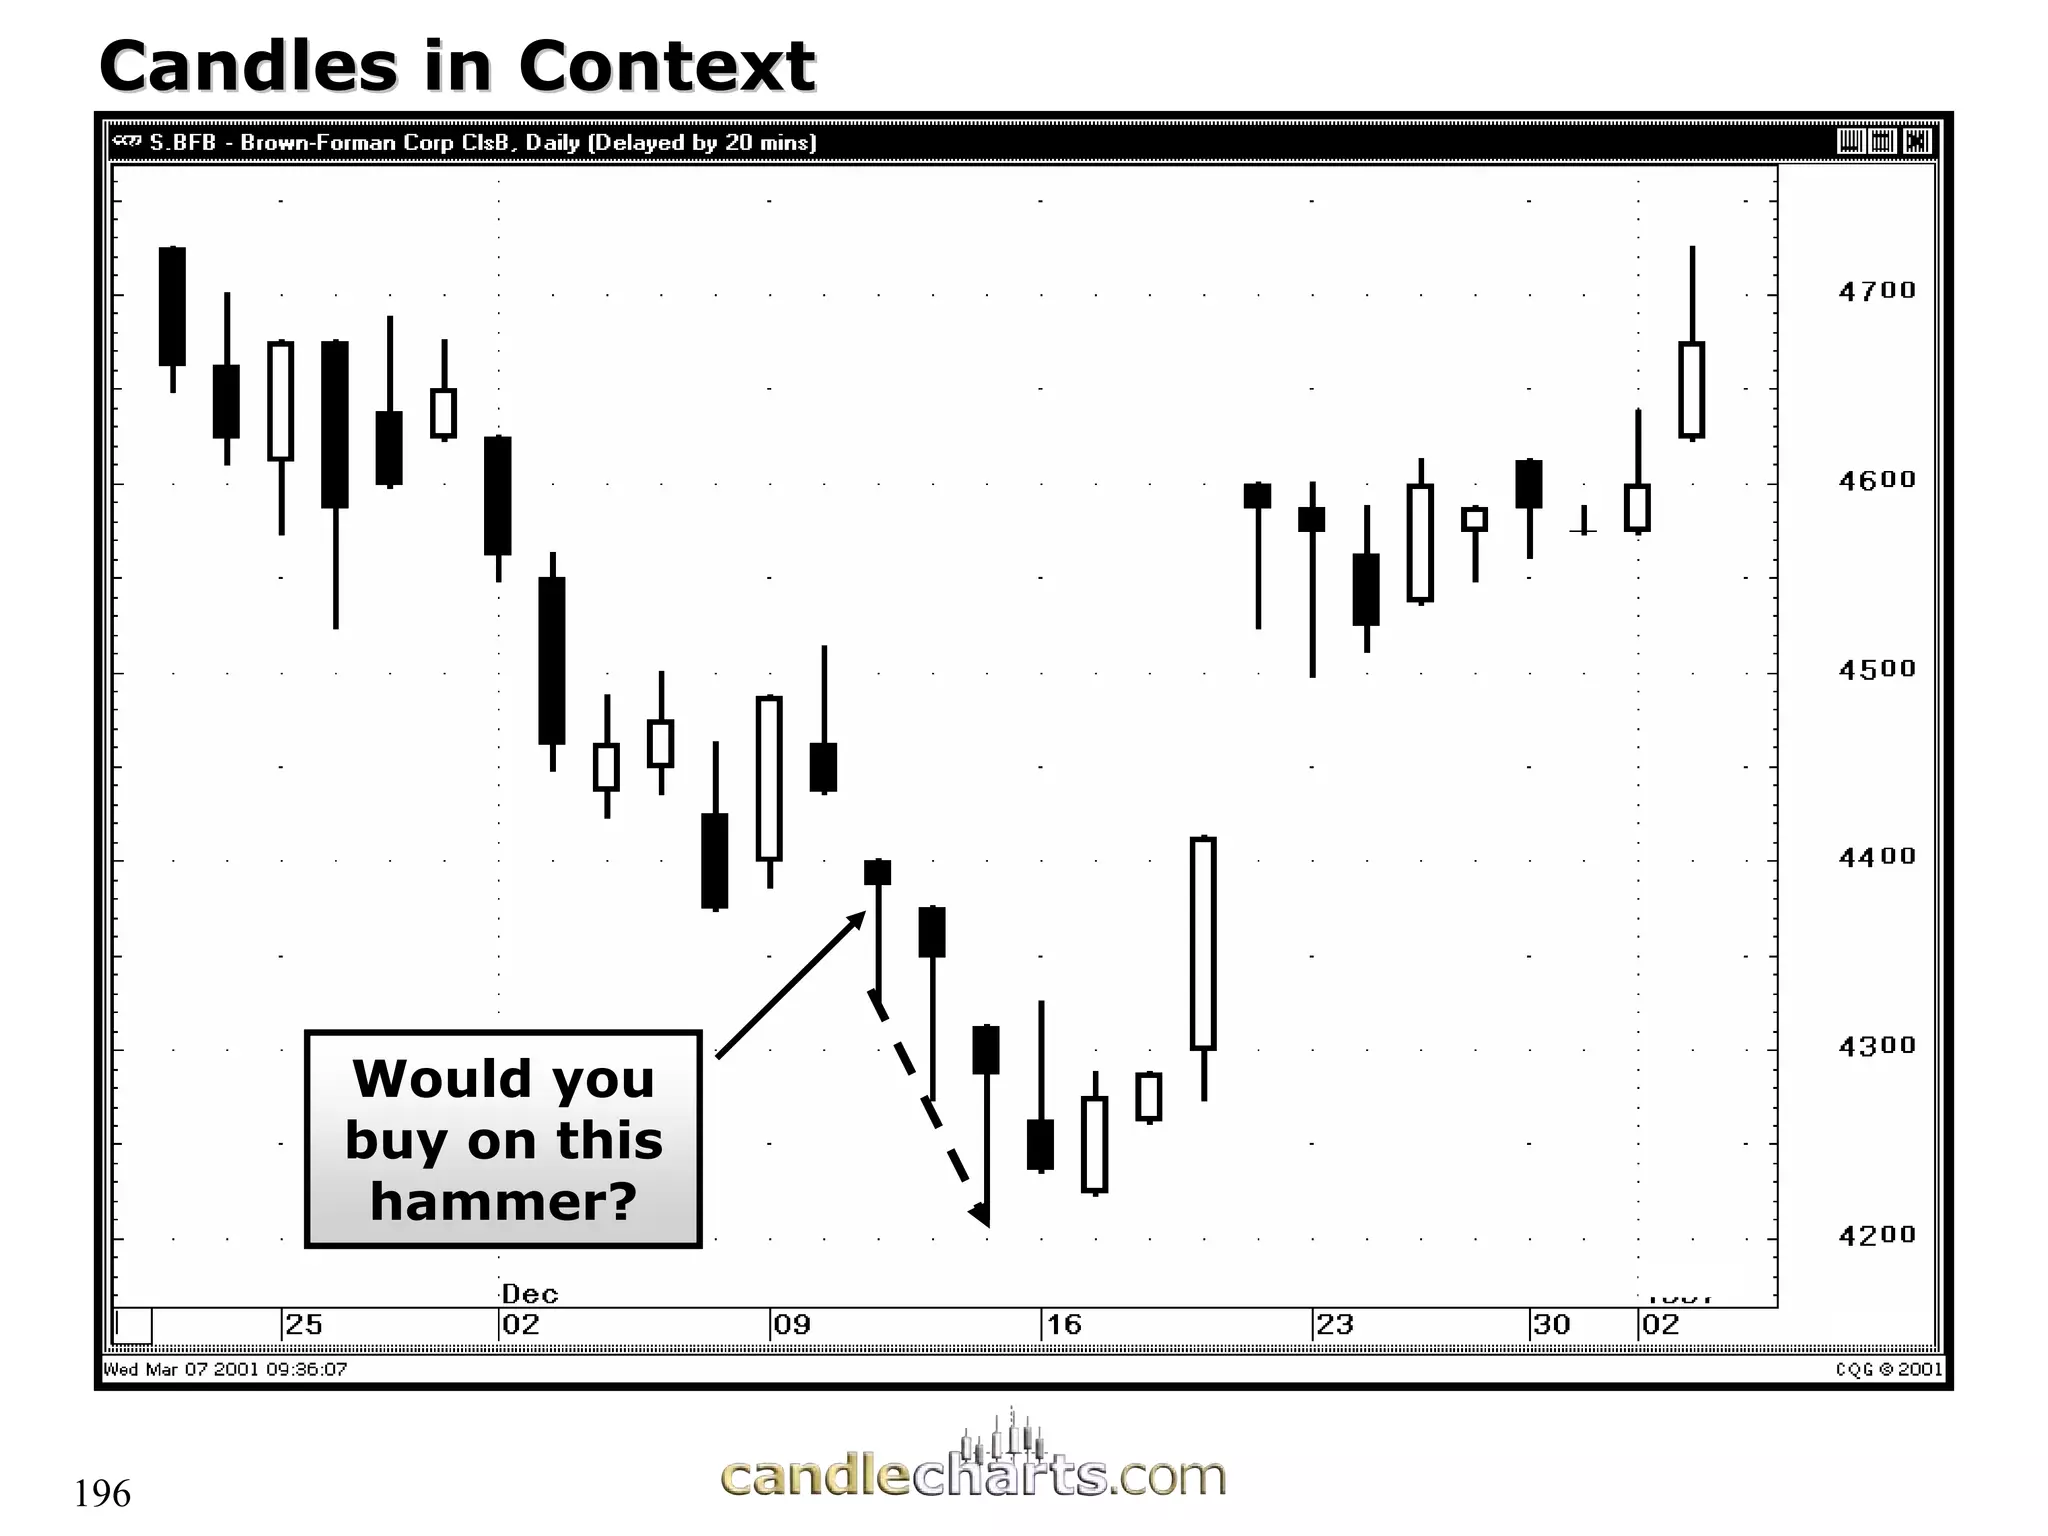
1
Advanced Candlestick
Charting Techniques:
Secrets to Becoming a
Samurai Trader
Samurai Trader
1
“
“He who is well
He who is well
prepared has won
prepared has won
half the battle”
half the battle”
2
Slide 3
3
New refinements and enhancements for high success
trading with candle charts
See when to ignore a candle signal
Special section on
Special section on on
on intraday charts
intraday charts
Uncover the one rule every candlestick trader ignores at
their own peril
their own peril
The P.R.O.F.I.T.S methodology
Learn the six principles every candlestick trader must
know
know
Uncloak new uses for the most potent candle pattern
Uncloak new uses for the most potent candle pattern -
- the
the
window
window
Effective money management concepts to maximize the
effectiveness of candle charts
Interactive practice sessions
3
4
Constructing the Candle Line
4
5
5
Candle or noses
5
6
Candles shine at Preserving Capital
A tall white candle pierces this resistance in early March.
For those who already are long this index, this was a green
light to remain long. But observe what unfolded the next
session—the doji. This doji line hinted the bulls had lost full
of the market (note: it does not mean that the bears has taken
control).
Warren Buffet’s Rules of
Money Management
Money Management
Rule 1
Rule 1 –
– Not to lose money
Not to lose money
Rule 2
Rule 2 –
– Don’t forget rule 1
Don’t forget rule 1
7
Nison Trading
Nison Trading
Principle
Principle
Candlesticks do not give
price targets.
price targets.
8
9
Gravestone Doji
This doji takes on extra significance
because it confirms a resistance level
Nison Trading
Nison Trading
Principle
Principle
A candlestick line or pattern
requires two criteria:
•
• The shape of the line or pattern
The shape of the line or pattern
•
• The preceding trend
The preceding trend
10
11
Doji and Trend
Doji and Trend
Concept:
To use a northern doji as a
signal we need to have an
uptrend to reverse
Doji in a “Box Range” is
not a trading signal
12
Doji and trend
“Box Range”
Doji
A doji in the middle
of a trading range has
no trend change
implications
13
Northern and Southern Doji
A doji in an uptrend
is a “Northern Doji”
A doji in a
downtrend
is a
“Southern
Doji”
14
Southern Doji
Nison Trading
Nison Trading
Principle
Principle
Candle signals must be
evaluated and acted upon
within the market’s context
15
16
Doji in Context
Doji in Context
Concept:
If a doji makes a new
high close for the move,
wait for bearish
confirmation with a close
under the doji’s close
Need a
close
under
here to
turn
bearish
17
Doji in Context
Doji in Context
Scenario 1 Scenario 2
Which of these
scenarios is a more
likely top reversal?
18
Doji, but New High Close
19
Doji, but New High close
20
Flexibility with Candles (and Confluence)
21
Doji
28 4
February
11 19 25 4
March
11 18 25 1
April
8 15
37.0
37.5
38.0
38.5
39.0
39.5
40.0
40.5
41.0
41.5
42.0
42.5
TJX
1
2
What makes doji 2
different than doji 1?
Trading Tactics
Trading Tactics
1) Name the two
reversal signals
at the arrows.
2) Would you use
these signals to
sell short?
Liquidate longs?
Why?
3) What is bearish
confirmation of
the reversal
signals?
22
23
Doji as Resistance
Doji as Resistance
Criteria: Use the highest high of
those two sessions (top of upper
shadow) as resistance
Implication: Close over that area:
market is “refreshed”
24
Doji
The red arrows
show the bulls
have complete
control. The doji
session alters the
trend (note also
the spinning tops
in mid and late
June).
25
Small Real Body as a doji
26
Doji after tall white
27
Doji as Resistance
Trading Tactics
Trading Tactics -
- Doji
Doji
Analyze these doji in the context of what happened
before. Are any of these a more likely reversal and why?
A -1 B-2 C-3
28
Trading Tactics
Trading Tactics –
– Doji (answer)
Doji (answer)
Rally may
just be
starting
Market not
overextended
Resistance
confirmed by
doji
A-1 B-2 C-35
Analyze these doji in the context of what happened
before. Are any of these a more likely reversal and why?
29
Doji Overview
Doji Overview –
– Analyze Each Doji in Context of Trend
Analyze Each Doji in Context of Trend
15 22 29 5
August
12 19 26 3
September
9 16 23
13.5
14.0
14.5
15.0
15.5
16.0
16.5
17.0
17.5
18.0
18.5
19.0
19.5
20.0
20.5
HEIDRICK STRUGG
1
2
3
4
5
6
30
Shadows
Remember: location and size of the shadow should be considered
when analyzing the market psychology.
Implication: Bearish long upper shadow offsets “rallying
strength.” Bullish long lower shadows hints bears losing force.
31
32
Upper Shadows and slope of advance
Scenario
1
Scenario
2
The Tools of the West with the
Light of the Candles
33
Hammer
black or white
Criteria:
• Small real body at, or near top, of range
• Lower shadow at least 2x real body
• Market in down trend
Implication: ‘Groping for a bottom”
34
Shooting Star
black or white
black or white
•Criteria:
• Small real body at, or near bottom, of range
• Upper shadow at least 2x real body
• Market in an up trend
•Implication: ‘Signaling Trouble Overhead”
35
High Wave Candles
High Wave Candles
Criteria: very long shadows and lower
small real body - color not important
Implication: Trend is losing force
36
High Wave Candle
Who’s in Charge?
Who’s in Charge Now?
37
High Wave Candle
New High
Close,but??
38
Criteria: very long shadows and lower
small real body - color not important
Implication: “Market has lost it’s sense
of direction”
Long Legged Doji – “Rickshaw
Man”
39
High-wave candle
RDY
The market is
at a new high-
but the high
wave candle
shows the
bulls are not in
full control.
40
Engulfing Patterns
Bearish
Bearish
Engulfing
Engulfing
Pattern
Pattern
Bullish
Bullish
Engulfing
Engulfing
Pattern
Pattern
Criteria:
• Black real body wraps around
preceding white real body
• Market in up trend
Implication: ‘Bulls have been
constrained”
Criteria:
• White real body wraps around
preceding black real body
• Market in down trend
•Implication: Market bottoming out
41
42
Bullish engulfing pattern as support
16 23 30
October
7 14 21
7.4
7.5
7.6
7.7
7.8
7.9
8.0
8.1
8.2
8.3
8.4
8.5
8.6
8.7
8.8
8.9
9.0
9.1
9.2
9.3
9.4
9.5
9.6
9.7
9.8
9.9
10.0
10.1
10.2
10.3
ORACLE
One of most powerful aspects of
the bullish engulfing pattern is
their use as support.
43
Bullish engulfing pattern
S&P Continuation
Note how
many black
candles the
white
candle
wrapped
around
Shooting
star
44
Bullish engulfing pattern as support
Center tall
white
While the low of the bullish
engulfing pattern is support,
for those who are more eager
to buy you can use the center
of the tall white real body as
an entry point. Keep in the
mind the risk –reward of the
trade.
45
Bearish engulfing pattern as resistance
If the first candle
is a doji instead
of a white real
body it is still
viewed as a
bearish engulfing
pattern.
46
Bearish Engulfing Pattern compared to Western outside reversal
47
Relative Strength
On this day Dow
was down 150
48
Is this a
Bullish
Engulfing
Pattern ?
Bullish Engulfing Pattern
49
Engulfing pattern – comparing size of real bodies
1
April
8 15 22 29
May
6
7.9
8.0
8.1
8.2
8.3
8.4
8.5
8.6
8.7
8.8
8.9
9.0
9.1
9.2
9.3
9.4
9.5
9.6
9.7
9.8
9.9
10.0
10.1
10.2
10.3
10.4
10.5
10.6
SIERRA WIRELESS
Consider the relative size of
the real bodies. Here they are
equal size, so reversal is less
likely. Final confirmation of
it’s failure comes with the close
under its support area.
50
Last Engulfing Pattern
Bullish
Bullish
Engulfing
Engulfing
Pattern
Pattern
Last
Last
Engulfing
Engulfing
Pattern
Pattern
50
51
Last Engulfing Pattern
51
52
Last Engulfing Pattern
52 Note: This is the same chart as slide 51
53
Last Engulfing Pattern
53
Dark Cloud Cover
Criteria:
• Opens above prior high (or close)
• Closes as long black real body
• Close well into prior long white candle
• Market moving north
Implication: “Advance is exhausting
itself”
54
Nison Trading
Nison Trading
Principle
Principle
Not all candle signals should
be used to buy or sell. Always
consider the risk/reward
aspect of the trade.
55
Dark Cloud Cover and Risk/Reward
Pattern
Completed
Here
56
The Blended Candle Line
open 1
open 1
close 2
close 2 =
Blended candle real body = open
of the first session, close of the
last session. Blended candle
shadows = highest high and
lowest close of all sessions
57
The Blended Candle Line
= =
58
59
The Checkmate Principle:
A series of tall white candles followed by
black candles (or small real bodies) near the
same resistance level reveals that the bulls’
drive is being “checkmated”
A series of long black candles followed by
white candles (or small real bodies) near the
same support level reveals that the bears’
drive is being “checkmated”
59
60
Bearish Checkmate
Bearish Checkmate
= strong session
= failure to sustain rally
☺
9
☺ ☺
☺
☺
9 9 9 9
This shows lack of bullish follow
through shows that each time this gets
in the 60-64 range.
60
61
Hammer as support
Hammer as support
61
62
The Checkmate Principle
What
What
happened
happened
after each
after each
white
white
candle?
candle?
When there is a series of tall white candles
followed by black candles or small real bodies
near the same resistance level it reveals that the
bulls’ drive is being “checkmated”
62
Tweezers Tops and Bottom
Criteria:
• First Candle is large real body
• Second session same high and,
ideally, small real body
Implication: Prior trend doesn’t
have a solid foundation
63
Tweezers Bottom
64
Tweezers tops
65
Tweezers top
66
Morning Star
Morning Star
white or black
Criteria:
• Market in down trend
•First candle long black
• Second real body (spinning top,
black or white) doesn’t overlap first
session’s real body
• Third candle (white) closes deeply in
first black real body
Implication: Bulls are taking control
67
68
Morning Star
Morning Star
white or black
Morning Star variation
69
70
Evening Star
Evening Star
white or black
1
2
3
Criteria:
• Market in an up trend
•First candle is long white
• Second real body (black or white
spinning top) doesn’t overlap first
session’s real body
• Third candle (black) closes deeply in
first white real body
Implication: Bears are taking control
Nison Trading
Nison Trading
Principle
Principle
Candle signals must be
evaluated and acted
evaluated and acted
upon within the market’s
context
context
71
Evening Star compared to Morning Star
Evening Star
Morning Star
Would you
buy here?
How about
here?
72
Evening Star and Risk/ Reward
24 1
July
8 15 22 29 5
August
12 19 26 3 9
September
16 2
14.0
14.5
15.0
15.5
16.0
16.5
17.0
17.5
18.0
18.5
19.0
19.5
20.0
HEIDRICK STRUGG
Evening Star
completed here. This
is likely a poor
risk/reward for a short
sale.
This doji
confirms
the
resistance
area set by
the evening
star and as
such may
offer a
better r/r.
73
74
Windows
Rising
Window
Falling
Window
75
Trading Tactics
Trading Tactics –
– practice
practice
1. What pattern is highlighted?
2. When would you sell short based on this pattern?
75
76
Trading Tactics
Trading Tactics –
– practice
practice (answer)
(answer)
1. What pattern is highlighted? Bearish engulfing pattern
2. When would you sell short based on this pattern?
Because of the rising window we would not sell on the
completion of this pattern. As such we could sell on (a) the
resistance at the highs of the bearish engulfing
pattern, or (b) on a break under the windows support.
Rising
window’s
support
Potential
selling
levels
76
77
Breakaway Gaps
78
Breakaway Gap
1
April
8 15 22 29
May
6 13 20 27
30.0
30.5
31.0
31.5
32.0
32.5
33.0
33.5
34.0
34.5
35.0
35.5
36.0
36.5
37.0
37.5
38.0
38.5
39.0
PRECISION DRILL
79
Breakaway Gap
80
Breakaway gap
22 28 4
February
11 19 25 4
March
11 18 25 1
April
8 15 2
53.5
54.0
54.5
55.0
55.5
56.0
56.5
57.0
57.5
58.0
58.5
59.0
59.5
60.0
60.5
61.0
61.5
62.0
62.5
63.0
63.5
64.0
64.5
65.0
65.5
66.0
66.5
67.0
67.5
68.0
68.5
69.0
69.5
70.0
70.5
INTL GAME TECH
The stock not only breaks
support – but does so with a
falling window. This increases
the potency of the window’s
resistance. Note the shooting star
and bearish engulfing pattern on
the rebound
81
31
2002
7 14 22 28 4
February
11 19 25 4
March
11 18 25
57.0
57.5
58.0
58.5
59.0
59.5
60.0
60.5
61.0
61.5
62.0
62.5
63.0
63.5
64.0
64.5
65.0
65.5
66.0
66.5
67.0
67.5
68.0
68.5
69.0
69.5
70.0
MICROSOFT
Breakaway Gap
Small
Small
windows
windows
Gapped under
Gapped under
support
support
82
Breakaway Gap
Nison Trading
Nison Trading
Principle
Principle
With windows size does
not matter.
not matter.
83
84
Large and small windows
Large
window with
the bottom
of this
window as
pivotal
support
Small
window
85
Large Window
86
16 17 18 19 22 23 24 25 26 29 30 31 1
August
2 5 6 7 8
23.5
24.0
24.5
25.0
25.5
26.0
26.5
27.0
27.5
28.0
28.5
29.0
29.5
30.0
30.5
31.0
31.5
NY CMNTY BANCP
High on July 26 was
27.09, low the next
session was 27.21
With windows size does not matter
87
Small Window
88
More than three windows
We need to wait until the top
window is closed to confirm a
change in trend
Closed under the
top window’s
support
89
Three Windows
90
Island Top and Bottom
Island Top
Island Top
Island Bottom
Island Bottom
91
Island Bottom
92
Island Top
93
Windows as Target
Once
under
$21 we
have to
go to
1993
for next
support
Rising
Window
Daily
prices
for
1993
94
Window as a target
Buy here
target
95
Fry Pan Bottom
Fry Pan Bottom Dumpling Top
Dumpling Top
Rounding Tops/Bottoms
96
Dumpling Top
97
Fry Pan Bottom
98
Midway (measuring) Gap
99
Midway Gap
100
High Price Gapping Play
101
High Price Gapping Play
8 15 22 29
July
6 13 20
10.8
10.9
11.0
11.1
11.2
11.3
11.4
11.5
11.6
11.7
11.8
11.9
12.0
12.1
12.2
12.3
12.4
12.5
12.6
12.7
12.8
12.9
13.0
13.1
13.2
13.3
13.4
13.5
13.6
13.7
13.8
13.9
14.0
14.1
14.2
14.3
14.4
99 CENTS STORES
High price
High price
gapping
gapping
play
play
Congestion
Congestion
band
band
102
Gapping Doji
103
Gapping Doji
104
Interactive Chart
1. What candle signals are at A and B?
2. What candle signals are at C and D?
3. Why did the rally stall at E and what was
the candle signal formed?
4. After the decline from E why did the
market find support near $18?
A
B
C D
E
105
Interactive Chart - answers
1. What candle signals are at A and B? –
Because of the trend neither are engulfing
patterns.
2. What candle signals are at C and D? –
Bullish engulfing pattern and a bullish counter-
attack pattern
3. Why did the rally stall at E and what was
the candle signal formed? –The falling window
opened in early August. A bearish engulfing
pattern
4. After the decline from E why did the
market find support near $18?- The small
rising window
A
B
C D
E
Small rising
window
106
Record Sessions
Overbought / Oversold Indicator
low for move
low for move
1
1
2
2
3
3
4
4
5
5
6
6
7
7
8
8
9
9
9 record session highs
106
107
Record Session Highs
10
107
108
Record session highs
Start here
7
108
109
Three Advancing White Soldiers
110
Three White Soliders
Three advancing
soldiers
110
111
Three White Soliders
Advancing
three soldiers
111
112
Three Black Crows
113
Three Black Crows
8 25 2
July
9 16 23 30
August
6 13 20 27 4
September
10 24
25
26
27
28
29
30
31
32
33
34
35
36
37
38
39
40
41
42
43
44
45
46
47
48
49
50
PULTE CORP (44.8600, 45.6600, 43.7600, 43.9000, -0.95000)
113
114
Rising and Falling Three Methods
Falling Three
Falling Three
Rising Three
Rising Three
114
115
Rising Three Methods
19 20 21 22 25 26 27 28 1 4
March
5 6 7 8 11 12 13 14 15 18 19 20 21 22 25 26 27 28 1
Ap
39.0
39.5
40.0
40.5
41.0
41.5
42.0
42.5
43.0
43.5
44.0
44.5
45.0
45.5
46.0
46.5
47.0
PHARMACIA
115
116
Open below/above the Stomach
Below Middle White
Below Middle White
close
Above Middle Black
Above Middle Black
117
Open below the stomach
117
118
Above the Stomach
118
119
Above the Stomach
120
Above the Stomach
121
Below the Stomach
122
Counter Attack Lines
close
Bearish
Bearish
close
Bullish
Bullish
123
Not Counter Attack Lines
Second session did not
open high enough
Both sessions were not
long real bodies
124
Bullish Counter Attack
125
Volume – Counter Attack
126
Bullish Counter-attack
First sign of a turn
was bullish counter-
attack
127
Convergence of Clues- Counter Attack
Bearish counter
attack
doji
Bearish engulfing
pattern
128
Bearish Counter-attack
Counter-
attack also
confirming
resistance
Why does this candle hint
bears’ are not in complete
control in spite of the large
price drop? What
happened the next session?
129
The “Phantom” method
What was support
before this session?
129
130
Phantom method
Phantom method
131
Phantom
Phantom
132
Phantom method
Phantom method –
– where’s R1?
where’s R1? (slide 1 of 2)
(slide 1 of 2)
133
Phantom method
Phantom method (slide 2 of 2)
(slide 2 of 2)
Using Candles in a “Box” Range
134
135
Box range
Box range
Do the bears or
bulls have the
greater
control?
136
Box Range
Box Range
Do the bears or
bulls have the
greater
control?
137
Flexibility reading candle signals
Combining intraday signals with longer
time frame support or resistance.
Harnessing intraday charts for signals
not available on daily charts
Intraday Techniques
Intraday Techniques
138
Bearish engulfing pattern and Intraday charts
We are less
strict with the
definition of
some patterns
on intra-day
charts.
Classic bearish engulfing
pattern has open above prior
session close. With intraday
open can = prior close.
139
Intra-day candle patterns
al
Although open and
close are the same,
view this as dark
cloud
Open and
closings are
about the
same, still
view this as a
morning star
Bullish engulfing
pattern
140
Windows on intraday
Most intraday
windows will be
between the last
candle yesterday
and the first
candle today
141
Intraday Techniques
Intraday Techniques
Combining intraday signals with
longer time frame support or
resistance.
142
Daily chart for support (slide 1 of 2)
We see a solid band of support near 43 ¼ at the circles dual
bullish engulfing patterns on the week of June 3. There was a
test of this support on June 14. We are thinking of buying on the
session at the arrow as the stock gets near this support on June
26. We then turn to an intra-day chart to see if there are any buy
signals as the stock as it approaches 43 ¼ ….. (see next chart).
June
14
Buying
area
143
Intra-day to place trade on confirmation of support
level obtained from daily chart (slide 2 or 2)
On this 5 minute chart on
June 26, the dashed line
shows support area obtained
from prior daily chart near
43 ¼. This level was
confirmed by a hammer
which held as support on a
retest.
Hammer
144
Use time frame of higher degree for resistance (slide 1 of 2)
8 15 22 29
May
6 13 20 28 3
June
10 17
4000
5000
6000
7000
8000
x1000
Volume
35.5
36.0
36.5
37.0
37.5
38.0
38.5
39.0
39.5
40.0
40.5
41.0
41.5
42.0
42.5
43.0
43.5
44.0
44.5
45.0
45.5
AMER EXPRESS CO
The volume spike on the falling window
on this daily chart increases the
significance of this resistance. So we have
resistance near $40. Now let’s shift to the
intra-day chart to see if there are any
bearish signals as the market approached
this resistance near $40…..
145
Intra-day chart to position trade (slide 2 of 2)
The
The
spinning
spinning
tops helped
tops helped
confirm the
confirm the
importance
importance
of the
of the
falling
falling
window’s
window’s
resistance
resistance
near $40
near $40
Falling
Falling
window
window
146
Chart of higher degree (slide 1 of 2) – Daily
On session X stock broke the
support level of rising window 1.
We therefore look for next support
at rising window 2 at 2090 to 2080.
We then turn to the intraday chart
after session X to see if there are
any buy signals at 2090/2080…..
1
2
X
147
Chart of higher degree (slide 2 of 2) – 5 Minute
Support level based on
daily chart confirmed
by a hammer and
morning star on this 5
minute chart
148
Daily for Support /intraday for positioning – slide 1 of 2
Change of
polarity now
forecasts
support near
70. We then
turn to
intraday…..
Former resistance
149
Daily for Support /intraday entry – slide 2 of 2
Near 70 we get a bullish engulfing
pattern on this 30 minute chart with
lighter volume on black candle and
increased volume on white.
Bearish shadows
confirming
resistance
150
Intraday Techniques
Intraday Techniques
Harnessing intraday charts for
signals not available on daily charts
151
Oversold? - Daily Chart (slide 1 of 2)
On this daily chart it
looks oversold
152
Look oversold now? – 30 minute charts (slide 2 of 2)
This intraday chart gives
a different perspective
153
Intra-day window – not a window on daily
27th
28th
154
Using intra-day charts for windows (slide 1 of 2)
no window on this
daily chart on June 7-
but check intra-day
chart
155
Top of falling
window
June 7
Using intra-day charts for windows (slide 2 of 2)
156
Using intraday charts – slide 1 of 2
Why is this market
having trouble near
1325 from Aug. 9-
13? Isn’t first
resistance at the
prior high near
1355?
Prior high
157
Using intraday charts – slide 2 of 2
This hourly chart shows something the daily
chart didn’t… there was a resistance zone
near 1325.
158
Using intra- charts for support - (slide 1 of 3)
On this daily chart on
this day (Oct.1) where is
1st support? Try shifting
to an intra-day chart…
159
Using intraday chart for support - slide 2 of 3
Oct. 1
On this 30
minute chart on
Oct.1 is there a
support area?
160
Using intraday chart for support - slide 3 of 3
This chart shows
action after Oct. 1.
Note how the 88 ½
area held as
support.
161
Intraday trading tactics – slide 1 of 3
On this daily chart, where’s R1
as of Dec. 3? Is it 955 or
something else? Let’s go to the
intra-day chart…
Dec. 3
162
Dec. 3
See any
resistance here
before 955 on
this 30 minute
chart?
Intraday trading tactics – slide 2 of 3
162
163
Intraday trading tactics – slide 3 of 3
Subsequent Price Action
Dec. 3
164
Using Intraday Charts – Daily Chart (Slide 1 of 3)
After this session
(March 20)
where’s R1?
165
Using Intraday Charts – Hourly Chart (Slide 2 of 3)
March 20
166
Using Intraday Charts – Daily Chart (Slide 3 of 3)
Candlecharts.com
Helping Clients Spot Market Turns Before the Competition
The Trading Triad
Candle Charts Western
Money Management
167
168
Trading Tactics
Timing
Market Chameleon
Trend
The Three Cs
Candlecharts.com
169
“
“His potential is that of
His potential is that of
the fully drawn bow, his
timing the release of the
trigger”
trigger”
Candlecharts.com
Market Timing
170
Trading Tactics – Timing
ember
10 24 1
October
8 15 22 29 5
November
19.0
19.5
20.0
20.5
21.0
21.5
22.0
22.5
23.0
23.5
24.0
24.5
25.0
25.5
26.0
26.5
27.0
27.5
INTEL CORP
Normally one waits for a
close to confirm a bullish
engulfing pattern, but
considering support was
holding on the open of this
session, once the candle gets
above the prior black candle
intraday one can consider
buying lightly.
171
Trading Tactics- Entering a Trade
The morning star pattern is not
completed until the third candle
line. However, in this scenario
the second session of that
potential pattern is confirming
the window’s support area. As
such, one could buy lightly there.
Morning star
Rising window
172
Trading Tactics – not waiting for the close
173
When to initiate a position
Although the
doji made a new
high close for
the move- it is
confirming a
resistance area.
As such we can
consider selling
lightly.
174
Trading Tactics –Case Study
6 7 8 11 12 13 14 15 19 20 21 22 25 26 27 28 1
March
4 5 6 7 8 11 12 13 14
37.0
37.5
38.0
38.5
39.0
39.5
40.0
40.5
41.0
41.5
42.0
42.5
43.0
43.5
44.0
44.5
FOMENTO MEXICANO
The close of this session
completes an island
bottom. But with the
gap higher opening one
could consider buying
on the opening.
Dark cloud
cover as
exit signal
175
Trade Tactics – Case Study
4
February
11 19 25 4
March
11
19.0
19.5
20.0
20.5
21.0
21.5
22.0
22.5
23.0
23.5
24.0
24.5
25.0
25.5
26.0
26.5
ADELPHIA STK C
Hammer
and Bullish
Shadows
to enter
Small
bearish
engulfing
pattern as
exit
or close
under
bull
channel
176
“
“Only those who
Only those who
understand adaptation
will win the battle”
Candlecharts.com
Market Chameleon -
adapt to changing
market conditions
177
Nison Trading
Nison Trading
Principle
Principle
Being a Market Chameleon:
As the market environment changes –
based on what the technical signals are
telling us – we should adapt our market
outlook
178
Market
Market Chemeleon
Chemeleon
Buy on these back to back
hammers. Original target is
resistance as defined by recent
high and falling window. With
the resistance and decline from
the shooting star that zone now
becomes the area to take
profits.
Falling
window
Buy
orginal
target
Shooting star
(new target)
179
Adapting to the Market
Breakout
Over
Resistance
Dark Cloud
Cover!
A prudent trader never
argues with the tape.
Markets are never
wrong-opinions often
are.
180
Adapting to the Market
Closed over
Window’s
Resistance
?
181
Being a Market Chameleon
The triangles show a support
level, but once broken we
should adapt our stance to
what the market is telling us.
(Observe the change of
polarity)
182
Adapting to the market
Normally we look for the
lows of the bullish engulfing
pattern as support. In this
case once the hammer is
formed (at the arrow) we
then adjust our buy point to
the hammer’s support area.
183
Nison Trading
Nison Trading
Principle
Principle
The If…Then Rule:
The If…Then Rule:
If the market does not act as forecasted then
exit the position
exit the position
Initiate a position when the market justifies
your potential trade (i.e. if near resistance, If the
market breaks above resistance, Then one can
buy.
183
184
If….Then Rule (slide 1 of 2)
Head and Shoulders
Top?
185
If….Then Rule (slide 2 of 2)
Was Head and Shoulders
Top Confirmed ?
186
If….Then Rule
The bullish
ascending triangle
and the new high
close for the move
strongly hints that
the market will
break out. But
resistance held.
“
“Take advantage of
Take advantage of
field conditions”
field conditions”
Candlecharts.com
Prevailing Trend
187
188
Nison Trading
Nison Trading
Principle
Principle
Initiate new trades in the direction of
the major trend (unless you are looking
for a small move):
for a small move):
On bullish signals in a bull market buy long. On bullish
signals in a bear trend, cover shorts.
On bearish signals in a bear trend, sell short. On bearish
signals in a bull market, liquidate longs.
189
Battle of the Windows – slide 1 of 2
Rising
window as
support (also
a breakaway
gap)
Falling
window as
resistance
Is there a way to forecast
which way the market will
break out?
190
Go with the trend –slide 2 of 2
Based on the market holding
above this 30 period moving
average the odds favor a
breakout to the upside
Rising
Window
Falling
window
191
Importance of Trend
Concept: place trade in
direction of prevailing trend.
Since this is down we should
look for bounce from bullish
engulfing pattern and then sell
short at change of polarity.
Change of
Polarity
Resistance zone
192
Go in the direction of the prevailing trend
Rising
windows
The bullish rising windows are within a
bear trend. This warrants covering shorts
at the window’s support, rather than
placing new long trades (unless you are
just looking for a small bounce)
Long upper
shadows and
spinning tops
are warning
signals
193
The Three Cs of Money
Management
Candlecharts.com
Confirmation
Confirmation
Consider Risk
Consider Risk-
-Reward
Reward
Candle in Context
Candle in Context
194
“
“Know the lay of the
Know the lay of the
land”
land”
Candlecharts.com
Candles in Context
195
Nison Trading
Nison Trading
Principle
Principle
Candle signals must be
evaluated and acted upon
within the market’s context
within the market’s context –
–
for example what happened
before the signal?
before the signal?
196
Candles in Context
Candles in Context
Would you
buy on this
hammer?
197
Patterns in Context
Patterns in Context –
– bullish signal at resistance
bullish signal at resistance
Although there was a
bullish engulfing
pattern, this
potentially bullish
signal came at a
resistance level at the
small falling window
window
198
4
bruary
5 6 7 8 11 12 13 14 15 19 20 21 22 25 26 27 28 1
March
4 5 6 7 8
36.5
37.0
37.5
38.0
38.5
39.0
39.5
40.0
40.5
41.0
41.5
42.0
42.5
43.0
43.5
44.0
44.5
45.0
TRIBUNE CO
Candle Signals within market context
Below the stomach pattern
is the rising window keeps
the uptrend intact.
199
Candles in Context
Candles in Context
What are two
reasons not to sell
on this doji?
200
Candles in Context
Candles in Context
Hammer,
but??
201
Candles in Context
Candles in Context
Not an ideal dark cloud
cover, but??
202
Trading Tactics
Trading Tactics -
- Candles in Context
Candles in Context
a) What are the candle lines at
the arrows at 1 and 2 ?
b) Where would you be more
bullish, at 1 or 2, and why?
c) On what candle line would
you buy after the signals at 1
and 2?
d) If you buy at 1 or 2 where
is a potential protective sell
stop?
1
2
203
Nison Trading
Nison Trading
Principle
Principle
Do not only consider the
market’s price. Analyze the
shape and size of candle
lines at that price.
204
204
How are new highs are made
205
How are new highs or lows made
New High Close
Bulls’ can’t sustain
rallies for more than
one session as shown
my the red arrow.
206
How are new highs made?
207
How are new highs/lows made?
208
The water looks fine!
209
“
“Those knowing when
Those knowing when
to fight and when not
will be victorious”
will be victorious”
Candlecharts.com
Consider risk-reward
210
Nison Trading
Nison Trading
Principle
Principle
Even a “perfect” candle signal
does not equal a good trade!
YOU MUST ALWAYS
YOU MUST ALWAYS
JUDGE THE POTENTIAL
JUDGE THE POTENTIAL
TRADE’S RISK
TRADE’S RISK-
-REWARD.
REWARD.
211
Stops
Stops
212
Stops
Stops
Window as support shown
by bullish shadows and
hammers at the arrows.
Once the support is broken
we must readjust our
bullish view.
window
213
Obtaining targets
Obtaining targets
Buy on the hammer
during the week of
April 8, an obvious
resistance area would
be towards 615.
hammer
214
Obtaining Price Targets
Shooting star confirms
resistance at top end of
box range. Sell on the
shooting star with a
potential target at bottom
of the box range near 55.
Shooting
Star
215
Using Western TA for target
19 25 4
March
11 18 25 1
April
8 15 22 29
May
6
970
975
980
985
990
995
1000
1005
1010
1015
1020
1025
1030
1035
1040
1045
1050
1055
1060
1065
1070
1075
x10
DJ INDU AVERAGE
Bullish engulfing
pattern gives a turning
signal with falling
resistance line as a
target
216
Trading Tactics
Trading Tactics-
- Case Study
Case Study
15 22 29
May
6 13 20 28
10.9
11.0
11.1
11.2
11.3
11.4
11.5
11.6
11.7
11.8
11.9
12.0
12.1
12.2
12.3
12.4
12.5
12.6
12.7
12.8
12.9
13.0
13.1
13.2
13.3
13.4
13.5
COMVERSE TECH
Bullish shadows at arrows show demand. A hammer is
a potential buy signal. If the trader feels that the
market was to high to buy on the next session’s open,
there is now a window as support. On a correction, we
can buy within the window. A potential target is the
April highs near 13.4. Once there a bearish engulfing
pattern confirms this resistance.
Hammer
Rising
window
Bearish
engulfing
pattern
217
Trading Tactics
Trading Tactics-
- Targets
Targets
3 20 28 3
June
10 17 24 1
July
8 15
300
400
500
600
700
800
900
1000
x1000
Volume
26.0
26.5
27.0
27.5
28.0
28.5
29.0
29.5
30.0
30.5
31.0
31.5
32.0
FIDELITY NATL
1) Buy on first hammer, exit at bearish engulfing
pattern (circled). This bearish engulfing pattern
took on extra significance since it also confirmed
resistance.
Or
2) Sell short at bearish engulfing pattern and exit
at second hammer (which confirmed the first
hammer’s support area).
hammers
218
Trading Tactics
Trading Tactics-
- Targets
Targets
Use hammer to buy
and window to exit
hammer
Falling window
219
Hammer and Risk/Reward
Risk
reward
220
Risk/Reward
Risk/Reward
14 22 28 4
February
11 19 25
Ma
60.0
60.5
61.0
61.5
62.0
62.5
63.0
63.5
64.0
64.5
65.0
65.5
66.0
66.5
67.0
67.5
68.0
68.5
69.0
69.5
INTL GAME TECH
Morning doji star as support. Buy on
hammer, target is recent pivot high. This
represents an attrive r/r.
Pivot
high
221
Risk/Reward
Risk/Reward
If you buy
here, what is
the target?
What is the
risk?
1
222
Risk/reward
Risk/reward
With a purchase at
the hammer and a
target to the falling
window we have a
good r/r trade.
223
Risk
Risk-
-reward
reward
1
2
Two hammers at 1
and 2. But due to
falling windows only
hammer 2 presents a
buying opportunity
due to the r/r.
224
Price targets
Price targets –
– slide 1 of 2
slide 1 of 2
On this morning
star pattern where
is the stop? And
where is a
potential price
target?
225
Price targets
Price targets -
- slide 2 of 2
slide 2 of 2
On this morning
star pattern where
is the stop? – The
low of the pattern.
And pick a
potential price
target. – The falling
window and the
high at H where the
sell off began.
Falling
window
H
Subsequent
action
Slide 226
226
Candlecharts.com
Confirmation
“
“He whose ranks are
He whose ranks are
united in purpose will
be victorious”
be victorious”
227
Nison Trading
Nison Trading
Principle
Principle
The more signals
The more signals-
- either
either
candle or Western or a
combination of both
combination of both –
–
converge at the same level,
the more likely a reversal.
228
Cluster of Candles
Cluster of Candles
1- falling window keeps trend
down
2- bullish shadows hint bears
losing force
3 and 4- bullish engulfing
pattern and rising window
prove bulls’ have taken full
control
229
Confirmation
Confirmation
Bullish engulfing
patterns and bullish
shadows confirming
support zone.
230
Bearish engulfing pattern but what is confirmation?
231
P.R.O.F.I.T.S
P
Potent Insights
otent Insights
R
Reduce Risks
educe Risks
O
Outmaneuver your competition
utmaneuver your competition
F
Find Pivotal Support /Resistance
ind Pivotal Support /Resistance
I
Identify False Breakouts
dentify False Breakouts
T
Terminate Bad Trades
erminate Bad Trades
S
Stay Alive!
tay Alive!
232
P
Potent Insights
otent Insights
233
P
Potent Insights
otent Insights
234
R
Reduce Risks
educe Risks
235
Reduce Risk
236
O
Outmaneuver your
utmaneuver your
competition
competition
237
Outmaneuver your competition
238
F
Find Pivotal
ind Pivotal
Support and
Support and
Resistance
Resistance
239
Find pivotal support /resistance
240
I
Identify False
dentify False
Breakouts
Breakouts
241
Identify False Breakouts
242
T
Terminate Bad
erminate Bad
Trades
Trades
243
Terminate Bad Trades
Do these candle
lines give you a
sense that the
bulls are in full
control?
244
S
Stay Alive!
tay Alive!
The race is not always to the
swiftest, but to those who keep
running.
running.
245
246
How it all comes together
How it all comes together (hourly)
(hourly)
247
1
5
4
3
2
1- Rising Resistance
Line
2- Shooting Star
2a – Bearish Engulfing
3- Falling Window
4- Bearish Divergence
5- Failure at window’s
resistance
Stay Alive- Confluence of signals for NASDAQ
Every time there is
Every time there is
a trade someone is
a trade someone is
wrong!
wrong!
248
249
Web site: www. candlecharts.com
E
E-
-mail: nison
mail: nison@candlecharts.com
@candlecharts.com
Telephone: 732.254.8660
Be sure to visit our site for our
newest products and services!

Secrets To Becoming A Samurai Trader.pdf

  • 1.
    1 Advanced Candlestick Advanced Candlestick ChartingTechniques: Charting Techniques: Secrets to Becoming a Secrets to Becoming a Samurai Trader Samurai Trader 1
  • 2.
    “ “He who iswell He who is well prepared has won prepared has won half the battle” half the battle” 2
  • 3.
    Slide 3 3 New refinementsand enhancements for high success New refinements and enhancements for high success trading with candle charts trading with candle charts See when to ignore a candle signal See when to ignore a candle signal Special section on Special section on on on intraday charts intraday charts Uncover the one rule every candlestick trader ignores at Uncover the one rule every candlestick trader ignores at their own peril their own peril The P.R.O.F.I.T.S methodology The P.R.O.F.I.T.S methodology Learn the six principles every candlestick trader must Learn the six principles every candlestick trader must know know Uncloak new uses for the most potent candle pattern Uncloak new uses for the most potent candle pattern - - the the window window Effective money management concepts to maximize the Effective money management concepts to maximize the effectiveness of candle charts effectiveness of candle charts Interactive practice sessions Interactive practice sessions 3
  • 4.
  • 5.
  • 6.
    6 Candles shine atPreserving Capital A tall white candle pierces this resistance in early March. For those who already are long this index, this was a green light to remain long. But observe what unfolded the next session—the doji. This doji line hinted the bulls had lost full of the market (note: it does not mean that the bears has taken control).
  • 7.
    Warren Buffet’s Rulesof Warren Buffet’s Rules of Money Management Money Management Rule 1 Rule 1 – – Not to lose money Not to lose money Rule 2 Rule 2 – – Don’t forget rule 1 Don’t forget rule 1 7
  • 8.
    Nison Trading Nison Trading Principle Principle Candlesticksdo not give Candlesticks do not give price targets. price targets. 8
  • 9.
    9 Gravestone Doji This dojitakes on extra significance because it confirms a resistance level
  • 10.
    Nison Trading Nison Trading Principle Principle Acandlestick line or pattern A candlestick line or pattern requires two criteria: requires two criteria: • • The shape of the line or pattern The shape of the line or pattern • • The preceding trend The preceding trend 10
  • 11.
    11 Doji and Trend Dojiand Trend Concept: To use a northern doji as a signal we need to have an uptrend to reverse Doji in a “Box Range” is not a trading signal
  • 12.
    12 Doji and trend “BoxRange” Doji A doji in the middle of a trading range has no trend change implications
  • 13.
    13 Northern and SouthernDoji A doji in an uptrend is a “Northern Doji” A doji in a downtrend is a “Southern Doji”
  • 14.
  • 15.
    Nison Trading Nison Trading Principle Principle Candlesignals must be Candle signals must be evaluated and acted upon evaluated and acted upon within the market’s context within the market’s context 15
  • 16.
    16 Doji in Context Dojiin Context Concept: If a doji makes a new high close for the move, wait for bearish confirmation with a close under the doji’s close Need a close under here to turn bearish
  • 17.
    17 Doji in Context Dojiin Context Scenario 1 Scenario 2 Which of these scenarios is a more likely top reversal?
  • 18.
    18 Doji, but NewHigh Close
  • 19.
    19 Doji, but NewHigh close
  • 20.
  • 21.
    21 Doji 28 4 February 11 1925 4 March 11 18 25 1 April 8 15 37.0 37.5 38.0 38.5 39.0 39.5 40.0 40.5 41.0 41.5 42.0 42.5 TJX 1 2 What makes doji 2 different than doji 1?
  • 22.
    Trading Tactics Trading Tactics 1)Name the two reversal signals at the arrows. 2) Would you use these signals to sell short? Liquidate longs? Why? 3) What is bearish confirmation of the reversal signals? 22
  • 23.
    23 Doji as Resistance Dojias Resistance Criteria: Use the highest high of those two sessions (top of upper shadow) as resistance Implication: Close over that area: market is “refreshed”
  • 24.
    24 Doji The red arrows showthe bulls have complete control. The doji session alters the trend (note also the spinning tops in mid and late June).
  • 25.
  • 26.
  • 27.
  • 28.
    Trading Tactics Trading Tactics- - Doji Doji Analyze these doji in the context of what happened before. Are any of these a more likely reversal and why? A -1 B-2 C-3 28
  • 29.
    Trading Tactics Trading Tactics– – Doji (answer) Doji (answer) Rally may just be starting Market not overextended Resistance confirmed by doji A-1 B-2 C-35 Analyze these doji in the context of what happened before. Are any of these a more likely reversal and why? 29
  • 30.
    Doji Overview Doji Overview– – Analyze Each Doji in Context of Trend Analyze Each Doji in Context of Trend 15 22 29 5 August 12 19 26 3 September 9 16 23 13.5 14.0 14.5 15.0 15.5 16.0 16.5 17.0 17.5 18.0 18.5 19.0 19.5 20.0 20.5 HEIDRICK STRUGG 1 2 3 4 5 6 30
  • 31.
    Shadows Remember: location andsize of the shadow should be considered when analyzing the market psychology. Implication: Bearish long upper shadow offsets “rallying strength.” Bullish long lower shadows hints bears losing force. 31
  • 32.
    32 Upper Shadows andslope of advance
  • 33.
    Scenario 1 Scenario 2 The Tools ofthe West with the The Tools of the West with the Light of the Candles Light of the Candles 33
  • 34.
    Hammer black or white Criteria: •Small real body at, or near top, of range • Lower shadow at least 2x real body • Market in down trend Implication: ‘Groping for a bottom” 34
  • 35.
    Shooting Star black orwhite black or white •Criteria: • Small real body at, or near bottom, of range • Upper shadow at least 2x real body • Market in an up trend •Implication: ‘Signaling Trouble Overhead” 35
  • 36.
    High Wave Candles HighWave Candles Criteria: very long shadows and lower small real body - color not important Implication: Trend is losing force 36
  • 37.
    High Wave Candle Who’sin Charge? Who’s in Charge Now? 37
  • 38.
    High Wave Candle NewHigh Close,but?? 38
  • 39.
    Criteria: very longshadows and lower small real body - color not important Implication: “Market has lost it’s sense of direction” Long Legged Doji – “Rickshaw Man” 39
  • 40.
    High-wave candle RDY The marketis at a new high- but the high wave candle shows the bulls are not in full control. 40
  • 41.
    Engulfing Patterns Bearish Bearish Engulfing Engulfing Pattern Pattern Bullish Bullish Engulfing Engulfing Pattern Pattern Criteria: • Blackreal body wraps around preceding white real body • Market in up trend Implication: ‘Bulls have been constrained” Criteria: • White real body wraps around preceding black real body • Market in down trend •Implication: Market bottoming out 41
  • 42.
    42 Bullish engulfing patternas support 16 23 30 October 7 14 21 7.4 7.5 7.6 7.7 7.8 7.9 8.0 8.1 8.2 8.3 8.4 8.5 8.6 8.7 8.8 8.9 9.0 9.1 9.2 9.3 9.4 9.5 9.6 9.7 9.8 9.9 10.0 10.1 10.2 10.3 ORACLE One of most powerful aspects of the bullish engulfing pattern is their use as support.
  • 43.
    43 Bullish engulfing pattern S&PContinuation Note how many black candles the white candle wrapped around Shooting star
  • 44.
    44 Bullish engulfing patternas support Center tall white While the low of the bullish engulfing pattern is support, for those who are more eager to buy you can use the center of the tall white real body as an entry point. Keep in the mind the risk –reward of the trade.
  • 45.
    45 Bearish engulfing patternas resistance If the first candle is a doji instead of a white real body it is still viewed as a bearish engulfing pattern.
  • 46.
    46 Bearish Engulfing Patterncompared to Western outside reversal
  • 47.
    47 Relative Strength On thisday Dow was down 150
  • 48.
    48 Is this a Bullish Engulfing Pattern? Bullish Engulfing Pattern
  • 49.
    49 Engulfing pattern –comparing size of real bodies 1 April 8 15 22 29 May 6 7.9 8.0 8.1 8.2 8.3 8.4 8.5 8.6 8.7 8.8 8.9 9.0 9.1 9.2 9.3 9.4 9.5 9.6 9.7 9.8 9.9 10.0 10.1 10.2 10.3 10.4 10.5 10.6 SIERRA WIRELESS Consider the relative size of the real bodies. Here they are equal size, so reversal is less likely. Final confirmation of it’s failure comes with the close under its support area.
  • 50.
  • 51.
  • 52.
    52 Last Engulfing Pattern 52Note: This is the same chart as slide 51
  • 53.
  • 54.
    Dark Cloud Cover Criteria: •Opens above prior high (or close) • Closes as long black real body • Close well into prior long white candle • Market moving north Implication: “Advance is exhausting itself” 54
  • 55.
    Nison Trading Nison Trading Principle Principle Notall candle signals should Not all candle signals should be used to buy or sell. Always be used to buy or sell. Always consider the risk/reward consider the risk/reward aspect of the trade. aspect of the trade. 55
  • 56.
    Dark Cloud Coverand Risk/Reward Pattern Completed Here 56
  • 57.
    The Blended CandleLine open 1 open 1 close 2 close 2 = Blended candle real body = open of the first session, close of the last session. Blended candle shadows = highest high and lowest close of all sessions 57
  • 58.
    The Blended CandleLine = = 58
  • 59.
    59 The Checkmate Principle: TheCheckmate Principle: A series of tall white candles followed by A series of tall white candles followed by black candles (or small real bodies) near the black candles (or small real bodies) near the same resistance level reveals that the bulls’ same resistance level reveals that the bulls’ drive is being “checkmated” drive is being “checkmated” A series of long black candles followed by A series of long black candles followed by white candles (or small real bodies) near the white candles (or small real bodies) near the same support level reveals that the bears’ same support level reveals that the bears’ drive is being “checkmated” drive is being “checkmated” 59
  • 60.
    60 Bearish Checkmate Bearish Checkmate =strong session = failure to sustain rally ☺ 9 ☺ ☺ ☺ ☺ 9 9 9 9 This shows lack of bullish follow through shows that each time this gets in the 60-64 range. 60
  • 61.
  • 62.
    62 The Checkmate Principle TheCheckmate Principle What What happened happened after each after each white white candle? candle? When there is a series of tall white candles followed by black candles or small real bodies near the same resistance level it reveals that the bulls’ drive is being “checkmated” 62
  • 63.
    Tweezers Tops andBottom Criteria: • First Candle is large real body • Second session same high and, ideally, small real body Implication: Prior trend doesn’t have a solid foundation 63
  • 64.
  • 65.
  • 66.
  • 67.
    Morning Star Morning Star whiteor black Criteria: • Market in down trend •First candle long black • Second real body (spinning top, black or white) doesn’t overlap first session’s real body • Third candle (white) closes deeply in first black real body Implication: Bulls are taking control 67
  • 68.
  • 69.
  • 70.
    70 Evening Star Evening Star whiteor black 1 2 3 Criteria: • Market in an up trend •First candle is long white • Second real body (black or white spinning top) doesn’t overlap first session’s real body • Third candle (black) closes deeply in first white real body Implication: Bears are taking control
  • 71.
    Nison Trading Nison Trading Principle Principle Candlesignals must be Candle signals must be evaluated and acted evaluated and acted upon within the market’s upon within the market’s context context 71
  • 72.
    Evening Star comparedto Morning Star Evening Star Morning Star Would you buy here? How about here? 72
  • 73.
    Evening Star andRisk/ Reward 24 1 July 8 15 22 29 5 August 12 19 26 3 9 September 16 2 14.0 14.5 15.0 15.5 16.0 16.5 17.0 17.5 18.0 18.5 19.0 19.5 20.0 HEIDRICK STRUGG Evening Star completed here. This is likely a poor risk/reward for a short sale. This doji confirms the resistance area set by the evening star and as such may offer a better r/r. 73
  • 74.
  • 75.
    75 Trading Tactics Trading Tactics– – practice practice 1. What pattern is highlighted? 2. When would you sell short based on this pattern? 75
  • 76.
    76 Trading Tactics Trading Tactics– – practice practice (answer) (answer) 1. What pattern is highlighted? Bearish engulfing pattern 2. When would you sell short based on this pattern? Because of the rising window we would not sell on the completion of this pattern. As such we could sell on (a) the resistance at the highs of the bearish engulfing pattern, or (b) on a break under the windows support. Rising window’s support Potential selling levels 76
  • 77.
  • 78.
    78 Breakaway Gap 1 April 8 1522 29 May 6 13 20 27 30.0 30.5 31.0 31.5 32.0 32.5 33.0 33.5 34.0 34.5 35.0 35.5 36.0 36.5 37.0 37.5 38.0 38.5 39.0 PRECISION DRILL
  • 79.
  • 80.
    80 Breakaway gap 22 284 February 11 19 25 4 March 11 18 25 1 April 8 15 2 53.5 54.0 54.5 55.0 55.5 56.0 56.5 57.0 57.5 58.0 58.5 59.0 59.5 60.0 60.5 61.0 61.5 62.0 62.5 63.0 63.5 64.0 64.5 65.0 65.5 66.0 66.5 67.0 67.5 68.0 68.5 69.0 69.5 70.0 70.5 INTL GAME TECH The stock not only breaks support – but does so with a falling window. This increases the potency of the window’s resistance. Note the shooting star and bearish engulfing pattern on the rebound
  • 81.
    81 31 2002 7 14 2228 4 February 11 19 25 4 March 11 18 25 57.0 57.5 58.0 58.5 59.0 59.5 60.0 60.5 61.0 61.5 62.0 62.5 63.0 63.5 64.0 64.5 65.0 65.5 66.0 66.5 67.0 67.5 68.0 68.5 69.0 69.5 70.0 MICROSOFT Breakaway Gap Small Small windows windows Gapped under Gapped under support support
  • 82.
  • 83.
    Nison Trading Nison Trading Principle Principle Withwindows size does With windows size does not matter. not matter. 83
  • 84.
    84 Large and smallwindows Large window with the bottom of this window as pivotal support Small window
  • 85.
  • 86.
    86 16 17 1819 22 23 24 25 26 29 30 31 1 August 2 5 6 7 8 23.5 24.0 24.5 25.0 25.5 26.0 26.5 27.0 27.5 28.0 28.5 29.0 29.5 30.0 30.5 31.0 31.5 NY CMNTY BANCP High on July 26 was 27.09, low the next session was 27.21 With windows size does not matter
  • 87.
  • 88.
    88 More than threewindows We need to wait until the top window is closed to confirm a change in trend Closed under the top window’s support
  • 89.
  • 90.
    90 Island Top andBottom Island Top Island Top Island Bottom Island Bottom
  • 91.
  • 92.
  • 93.
    93 Windows as Target Once under $21we have to go to 1993 for next support Rising Window Daily prices for 1993
  • 94.
    94 Window as atarget Buy here target
  • 95.
    95 Fry Pan Bottom FryPan Bottom Dumpling Top Dumpling Top Rounding Tops/Bottoms Rounding Tops/Bottoms
  • 96.
  • 97.
  • 98.
  • 99.
  • 100.
    100 High Price GappingPlay High Price Gapping Play
  • 101.
    101 High Price GappingPlay 8 15 22 29 July 6 13 20 10.8 10.9 11.0 11.1 11.2 11.3 11.4 11.5 11.6 11.7 11.8 11.9 12.0 12.1 12.2 12.3 12.4 12.5 12.6 12.7 12.8 12.9 13.0 13.1 13.2 13.3 13.4 13.5 13.6 13.7 13.8 13.9 14.0 14.1 14.2 14.3 14.4 99 CENTS STORES High price High price gapping gapping play play Congestion Congestion band band
  • 102.
  • 103.
  • 104.
    104 Interactive Chart 1. Whatcandle signals are at A and B? 2. What candle signals are at C and D? 3. Why did the rally stall at E and what was the candle signal formed? 4. After the decline from E why did the market find support near $18? A B C D E
  • 105.
    105 Interactive Chart -answers 1. What candle signals are at A and B? – Because of the trend neither are engulfing patterns. 2. What candle signals are at C and D? – Bullish engulfing pattern and a bullish counter- attack pattern 3. Why did the rally stall at E and what was the candle signal formed? –The falling window opened in early August. A bearish engulfing pattern 4. After the decline from E why did the market find support near $18?- The small rising window A B C D E Small rising window
  • 106.
    106 Record Sessions Overbought /Oversold Indicator low for move low for move 1 1 2 2 3 3 4 4 5 5 6 6 7 7 8 8 9 9 9 record session highs 9 record session highs 106
  • 107.
  • 108.
  • 109.
  • 110.
    110 Three White Soliders Threeadvancing soldiers 110
  • 111.
  • 112.
  • 113.
    113 Three Black Crows 825 2 July 9 16 23 30 August 6 13 20 27 4 September 10 24 25 26 27 28 29 30 31 32 33 34 35 36 37 38 39 40 41 42 43 44 45 46 47 48 49 50 PULTE CORP (44.8600, 45.6600, 43.7600, 43.9000, -0.95000) 113
  • 114.
    114 Rising and FallingThree Methods Falling Three Falling Three Rising Three Rising Three 114
  • 115.
    115 Rising Three Methods 1920 21 22 25 26 27 28 1 4 March 5 6 7 8 11 12 13 14 15 18 19 20 21 22 25 26 27 28 1 Ap 39.0 39.5 40.0 40.5 41.0 41.5 42.0 42.5 43.0 43.5 44.0 44.5 45.0 45.5 46.0 46.5 47.0 PHARMACIA 115
  • 116.
    116 Open below/above theStomach Below Middle White Below Middle White close Above Middle Black Above Middle Black
  • 117.
    117 Open below thestomach 117
  • 118.
  • 119.
  • 120.
  • 121.
  • 122.
  • 123.
    123 Not Counter AttackLines Second session did not open high enough Both sessions were not long real bodies
  • 124.
  • 125.
  • 126.
    126 Bullish Counter-attack First signof a turn was bullish counter- attack
  • 127.
    127 Convergence of Clues-Counter Attack Bearish counter attack doji Bearish engulfing pattern
  • 128.
    128 Bearish Counter-attack Counter- attack also confirming resistance Whydoes this candle hint bears’ are not in complete control in spite of the large price drop? What happened the next session?
  • 129.
    129 The “Phantom” method The“Phantom” method What was support before this session? 129
  • 130.
  • 131.
  • 132.
    132 Phantom method Phantom method– – where’s R1? where’s R1? (slide 1 of 2) (slide 1 of 2)
  • 133.
    133 Phantom method Phantom method(slide 2 of 2) (slide 2 of 2)
  • 134.
    Using Candles ina “Box” Range 134
  • 135.
    135 Box range Box range Dothe bears or bulls have the greater control?
  • 136.
    136 Box Range Box Range Dothe bears or bulls have the greater control?
  • 137.
    137 Flexibility reading candlesignals Combining intraday signals with longer time frame support or resistance. Harnessing intraday charts for signals not available on daily charts Intraday Techniques Intraday Techniques
  • 138.
    138 Bearish engulfing patternand Intraday charts We are less strict with the definition of some patterns on intra-day charts. Classic bearish engulfing pattern has open above prior session close. With intraday open can = prior close.
  • 139.
    139 Intra-day candle patterns al Althoughopen and close are the same, view this as dark cloud Open and closings are about the same, still view this as a morning star Bullish engulfing pattern
  • 140.
    140 Windows on intraday Mostintraday windows will be between the last candle yesterday and the first candle today
  • 141.
    141 Intraday Techniques Intraday Techniques Combiningintraday signals with longer time frame support or resistance.
  • 142.
    142 Daily chart forsupport (slide 1 of 2) We see a solid band of support near 43 ¼ at the circles dual bullish engulfing patterns on the week of June 3. There was a test of this support on June 14. We are thinking of buying on the session at the arrow as the stock gets near this support on June 26. We then turn to an intra-day chart to see if there are any buy signals as the stock as it approaches 43 ¼ ….. (see next chart). June 14 Buying area
  • 143.
    143 Intra-day to placetrade on confirmation of support level obtained from daily chart (slide 2 or 2) On this 5 minute chart on June 26, the dashed line shows support area obtained from prior daily chart near 43 ¼. This level was confirmed by a hammer which held as support on a retest. Hammer
  • 144.
    144 Use time frameof higher degree for resistance (slide 1 of 2) 8 15 22 29 May 6 13 20 28 3 June 10 17 4000 5000 6000 7000 8000 x1000 Volume 35.5 36.0 36.5 37.0 37.5 38.0 38.5 39.0 39.5 40.0 40.5 41.0 41.5 42.0 42.5 43.0 43.5 44.0 44.5 45.0 45.5 AMER EXPRESS CO The volume spike on the falling window on this daily chart increases the significance of this resistance. So we have resistance near $40. Now let’s shift to the intra-day chart to see if there are any bearish signals as the market approached this resistance near $40…..
  • 145.
    145 Intra-day chart toposition trade (slide 2 of 2) The The spinning spinning tops helped tops helped confirm the confirm the importance importance of the of the falling falling window’s window’s resistance resistance near $40 near $40 Falling Falling window window
  • 146.
    146 Chart of higherdegree (slide 1 of 2) – Daily On session X stock broke the support level of rising window 1. We therefore look for next support at rising window 2 at 2090 to 2080. We then turn to the intraday chart after session X to see if there are any buy signals at 2090/2080….. 1 2 X
  • 147.
    147 Chart of higherdegree (slide 2 of 2) – 5 Minute Support level based on daily chart confirmed by a hammer and morning star on this 5 minute chart
  • 148.
    148 Daily for Support/intraday for positioning – slide 1 of 2 Change of polarity now forecasts support near 70. We then turn to intraday….. Former resistance
  • 149.
    149 Daily for Support/intraday entry – slide 2 of 2 Near 70 we get a bullish engulfing pattern on this 30 minute chart with lighter volume on black candle and increased volume on white. Bearish shadows confirming resistance
  • 150.
    150 Intraday Techniques Intraday Techniques Harnessingintraday charts for signals not available on daily charts
  • 151.
    151 Oversold? - DailyChart (slide 1 of 2) On this daily chart it looks oversold
  • 152.
    152 Look oversold now?– 30 minute charts (slide 2 of 2) This intraday chart gives a different perspective
  • 153.
    153 Intra-day window –not a window on daily 27th 28th
  • 154.
    154 Using intra-day chartsfor windows (slide 1 of 2) no window on this daily chart on June 7- but check intra-day chart
  • 155.
    155 Top of falling window June7 Using intra-day charts for windows (slide 2 of 2)
  • 156.
    156 Using intraday charts– slide 1 of 2 Why is this market having trouble near 1325 from Aug. 9- 13? Isn’t first resistance at the prior high near 1355? Prior high
  • 157.
    157 Using intraday charts– slide 2 of 2 This hourly chart shows something the daily chart didn’t… there was a resistance zone near 1325.
  • 158.
    158 Using intra- chartsfor support - (slide 1 of 3) On this daily chart on this day (Oct.1) where is 1st support? Try shifting to an intra-day chart…
  • 159.
    159 Using intraday chartfor support - slide 2 of 3 Oct. 1 On this 30 minute chart on Oct.1 is there a support area?
  • 160.
    160 Using intraday chartfor support - slide 3 of 3 This chart shows action after Oct. 1. Note how the 88 ½ area held as support.
  • 161.
    161 Intraday trading tactics– slide 1 of 3 On this daily chart, where’s R1 as of Dec. 3? Is it 955 or something else? Let’s go to the intra-day chart… Dec. 3
  • 162.
    162 Dec. 3 See any resistancehere before 955 on this 30 minute chart? Intraday trading tactics – slide 2 of 3 162
  • 163.
    163 Intraday trading tactics– slide 3 of 3 Subsequent Price Action Dec. 3
  • 164.
    164 Using Intraday Charts– Daily Chart (Slide 1 of 3) After this session (March 20) where’s R1?
  • 165.
    165 Using Intraday Charts– Hourly Chart (Slide 2 of 3) March 20
  • 166.
    166 Using Intraday Charts– Daily Chart (Slide 3 of 3)
  • 167.
    Candlecharts.com Helping Clients SpotMarket Turns Before the Competition The Trading Triad Candle Charts Western Money Management 167
  • 168.
  • 169.
    169 “ “His potential isthat of His potential is that of the fully drawn bow, his the fully drawn bow, his timing the release of the timing the release of the trigger” trigger” Candlecharts.com Market Timing
  • 170.
    170 Trading Tactics –Timing ember 10 24 1 October 8 15 22 29 5 November 19.0 19.5 20.0 20.5 21.0 21.5 22.0 22.5 23.0 23.5 24.0 24.5 25.0 25.5 26.0 26.5 27.0 27.5 INTEL CORP Normally one waits for a close to confirm a bullish engulfing pattern, but considering support was holding on the open of this session, once the candle gets above the prior black candle intraday one can consider buying lightly.
  • 171.
    171 Trading Tactics- Enteringa Trade The morning star pattern is not completed until the third candle line. However, in this scenario the second session of that potential pattern is confirming the window’s support area. As such, one could buy lightly there. Morning star Rising window
  • 172.
    172 Trading Tactics –not waiting for the close
  • 173.
    173 When to initiatea position Although the doji made a new high close for the move- it is confirming a resistance area. As such we can consider selling lightly.
  • 174.
    174 Trading Tactics –CaseStudy 6 7 8 11 12 13 14 15 19 20 21 22 25 26 27 28 1 March 4 5 6 7 8 11 12 13 14 37.0 37.5 38.0 38.5 39.0 39.5 40.0 40.5 41.0 41.5 42.0 42.5 43.0 43.5 44.0 44.5 FOMENTO MEXICANO The close of this session completes an island bottom. But with the gap higher opening one could consider buying on the opening. Dark cloud cover as exit signal
  • 175.
    175 Trade Tactics –Case Study 4 February 11 19 25 4 March 11 19.0 19.5 20.0 20.5 21.0 21.5 22.0 22.5 23.0 23.5 24.0 24.5 25.0 25.5 26.0 26.5 ADELPHIA STK C Hammer and Bullish Shadows to enter Small bearish engulfing pattern as exit or close under bull channel
  • 176.
    176 “ “Only those who Onlythose who understand adaptation understand adaptation will win the battle” will win the battle” Candlecharts.com Market Chameleon - adapt to changing market conditions
  • 177.
    177 Nison Trading Nison Trading Principle Principle Beinga Market Chameleon: Being a Market Chameleon: As the market environment changes – based on what the technical signals are telling us – we should adapt our market outlook
  • 178.
    178 Market Market Chemeleon Chemeleon Buy onthese back to back hammers. Original target is resistance as defined by recent high and falling window. With the resistance and decline from the shooting star that zone now becomes the area to take profits. Falling window Buy orginal target Shooting star (new target)
  • 179.
    179 Adapting to theMarket Adapting to the Market Breakout Over Resistance Dark Cloud Cover! A prudent trader never argues with the tape. Markets are never wrong-opinions often are.
  • 180.
    180 Adapting to theMarket Adapting to the Market Closed over Window’s Resistance ?
  • 181.
    181 Being a MarketChameleon Being a Market Chameleon The triangles show a support level, but once broken we should adapt our stance to what the market is telling us. (Observe the change of polarity)
  • 182.
    182 Adapting to themarket Adapting to the market Normally we look for the lows of the bullish engulfing pattern as support. In this case once the hammer is formed (at the arrow) we then adjust our buy point to the hammer’s support area.
  • 183.
    183 Nison Trading Nison Trading Principle Principle TheIf…Then Rule: The If…Then Rule: If the market does not act as forecasted then If the market does not act as forecasted then exit the position exit the position Initiate a position when the market justifies your potential trade (i.e. if near resistance, If the market breaks above resistance, Then one can buy. 183
  • 184.
    184 If….Then Rule (slide1 of 2) Head and Shoulders Top?
  • 185.
    185 If….Then Rule (slide2 of 2) Was Head and Shoulders Top Confirmed ?
  • 186.
    186 If….Then Rule The bullish ascendingtriangle and the new high close for the move strongly hints that the market will break out. But resistance held.
  • 187.
    “ “Take advantage of Takeadvantage of field conditions” field conditions” Candlecharts.com Prevailing Trend 187
  • 188.
    188 Nison Trading Nison Trading Principle Principle Initiatenew trades in the direction of Initiate new trades in the direction of the major trend (unless you are looking the major trend (unless you are looking for a small move): for a small move): On bullish signals in a bull market buy long. On bullish On bullish signals in a bull market buy long. On bullish signals in a bear trend, cover shorts. signals in a bear trend, cover shorts. On bearish signals in a bear trend, sell short. On bearish On bearish signals in a bear trend, sell short. On bearish signals in a bull market, liquidate longs. signals in a bull market, liquidate longs.
  • 189.
    189 Battle of theWindows – slide 1 of 2 Rising window as support (also a breakaway gap) Falling window as resistance Is there a way to forecast which way the market will break out?
  • 190.
    190 Go with thetrend –slide 2 of 2 Based on the market holding above this 30 period moving average the odds favor a breakout to the upside Rising Window Falling window
  • 191.
    191 Importance of Trend Concept:place trade in direction of prevailing trend. Since this is down we should look for bounce from bullish engulfing pattern and then sell short at change of polarity. Change of Polarity Resistance zone
  • 192.
    192 Go in thedirection of the prevailing trend Rising windows The bullish rising windows are within a bear trend. This warrants covering shorts at the window’s support, rather than placing new long trades (unless you are just looking for a small bounce) Long upper shadows and spinning tops are warning signals
  • 193.
    193 The Three Csof Money Management Candlecharts.com Confirmation Confirmation Consider Risk Consider Risk- -Reward Reward Candle in Context Candle in Context
  • 194.
    194 “ “Know the layof the Know the lay of the land” land” Candlecharts.com Candles in Context
  • 195.
    195 Nison Trading Nison Trading Principle Principle Candlesignals must be Candle signals must be evaluated and acted upon evaluated and acted upon within the market’s context within the market’s context – – for example what happened for example what happened before the signal? before the signal?
  • 196.
    196 Candles in Context Candlesin Context Would you buy on this hammer?
  • 197.
    197 Patterns in Context Patternsin Context – – bullish signal at resistance bullish signal at resistance Although there was a bullish engulfing pattern, this potentially bullish signal came at a resistance level at the small falling window window
  • 198.
    198 4 bruary 5 6 78 11 12 13 14 15 19 20 21 22 25 26 27 28 1 March 4 5 6 7 8 36.5 37.0 37.5 38.0 38.5 39.0 39.5 40.0 40.5 41.0 41.5 42.0 42.5 43.0 43.5 44.0 44.5 45.0 TRIBUNE CO Candle Signals within market context Candle Signals within market context Below the stomach pattern is the rising window keeps the uptrend intact.
  • 199.
    199 Candles in Context Candlesin Context What are two reasons not to sell on this doji?
  • 200.
    200 Candles in Context Candlesin Context Hammer, but??
  • 201.
    201 Candles in Context Candlesin Context Not an ideal dark cloud cover, but??
  • 202.
    202 Trading Tactics Trading Tactics- - Candles in Context Candles in Context a) What are the candle lines at the arrows at 1 and 2 ? b) Where would you be more bullish, at 1 or 2, and why? c) On what candle line would you buy after the signals at 1 and 2? d) If you buy at 1 or 2 where is a potential protective sell stop? 1 2
  • 203.
    203 Nison Trading Nison Trading Principle Principle Donot only consider the Do not only consider the market’s price. Analyze the market’s price. Analyze the shape and size of candle shape and size of candle lines at that price. lines at that price.
  • 204.
    204 204 How are newhighs are made
  • 205.
    205 How are newhighs or lows made How are new highs or lows made New High Close Bulls’ can’t sustain rallies for more than one session as shown my the red arrow.
  • 206.
    206 How are newhighs made? How are new highs made?
  • 207.
    207 How are newhighs/lows made? How are new highs/lows made?
  • 208.
    208 The water looksfine! The water looks fine!
  • 209.
    209 “ “Those knowing when Thoseknowing when to fight and when not to fight and when not will be victorious” will be victorious” Candlecharts.com Consider risk-reward
  • 210.
    210 Nison Trading Nison Trading Principle Principle Evena “perfect” candle signal Even a “perfect” candle signal does not equal a good trade! does not equal a good trade! YOU MUST ALWAYS YOU MUST ALWAYS JUDGE THE POTENTIAL JUDGE THE POTENTIAL TRADE’S RISK TRADE’S RISK- -REWARD. REWARD.
  • 211.
  • 212.
    212 Stops Stops Window as supportshown by bullish shadows and hammers at the arrows. Once the support is broken we must readjust our bullish view. window
  • 213.
    213 Obtaining targets Obtaining targets Buyon the hammer during the week of April 8, an obvious resistance area would be towards 615. hammer
  • 214.
    214 Obtaining Price Targets ObtainingPrice Targets Shooting star confirms resistance at top end of box range. Sell on the shooting star with a potential target at bottom of the box range near 55. Shooting Star
  • 215.
    215 Using Western TAfor target Using Western TA for target 19 25 4 March 11 18 25 1 April 8 15 22 29 May 6 970 975 980 985 990 995 1000 1005 1010 1015 1020 1025 1030 1035 1040 1045 1050 1055 1060 1065 1070 1075 x10 DJ INDU AVERAGE Bullish engulfing pattern gives a turning signal with falling resistance line as a target
  • 216.
    216 Trading Tactics Trading Tactics- -Case Study Case Study 15 22 29 May 6 13 20 28 10.9 11.0 11.1 11.2 11.3 11.4 11.5 11.6 11.7 11.8 11.9 12.0 12.1 12.2 12.3 12.4 12.5 12.6 12.7 12.8 12.9 13.0 13.1 13.2 13.3 13.4 13.5 COMVERSE TECH Bullish shadows at arrows show demand. A hammer is a potential buy signal. If the trader feels that the market was to high to buy on the next session’s open, there is now a window as support. On a correction, we can buy within the window. A potential target is the April highs near 13.4. Once there a bearish engulfing pattern confirms this resistance. Hammer Rising window Bearish engulfing pattern
  • 217.
    217 Trading Tactics Trading Tactics- -Targets Targets 3 20 28 3 June 10 17 24 1 July 8 15 300 400 500 600 700 800 900 1000 x1000 Volume 26.0 26.5 27.0 27.5 28.0 28.5 29.0 29.5 30.0 30.5 31.0 31.5 32.0 FIDELITY NATL 1) Buy on first hammer, exit at bearish engulfing pattern (circled). This bearish engulfing pattern took on extra significance since it also confirmed resistance. Or 2) Sell short at bearish engulfing pattern and exit at second hammer (which confirmed the first hammer’s support area). hammers
  • 218.
    218 Trading Tactics Trading Tactics- -Targets Targets Use hammer to buy and window to exit hammer Falling window
  • 219.
    219 Hammer and Risk/Reward Hammerand Risk/Reward Risk reward
  • 220.
    220 Risk/Reward Risk/Reward 14 22 284 February 11 19 25 Ma 60.0 60.5 61.0 61.5 62.0 62.5 63.0 63.5 64.0 64.5 65.0 65.5 66.0 66.5 67.0 67.5 68.0 68.5 69.0 69.5 INTL GAME TECH Morning doji star as support. Buy on hammer, target is recent pivot high. This represents an attrive r/r. Pivot high
  • 221.
    221 Risk/Reward Risk/Reward If you buy here,what is the target? What is the risk? 1
  • 222.
    222 Risk/reward Risk/reward With a purchaseat the hammer and a target to the falling window we have a good r/r trade.
  • 223.
    223 Risk Risk- -reward reward 1 2 Two hammers at1 and 2. But due to falling windows only hammer 2 presents a buying opportunity due to the r/r.
  • 224.
    224 Price targets Price targets– – slide 1 of 2 slide 1 of 2 On this morning star pattern where is the stop? And where is a potential price target?
  • 225.
    225 Price targets Price targets- - slide 2 of 2 slide 2 of 2 On this morning star pattern where is the stop? – The low of the pattern. And pick a potential price target. – The falling window and the high at H where the sell off began. Falling window H Subsequent action
  • 226.
    Slide 226 226 Candlecharts.com Confirmation “ “He whoseranks are He whose ranks are united in purpose will united in purpose will be victorious” be victorious”
  • 227.
    227 Nison Trading Nison Trading Principle Principle Themore signals The more signals- - either either candle or Western or a candle or Western or a combination of both combination of both – – converge at the same level, converge at the same level, the more likely a reversal. the more likely a reversal.
  • 228.
    228 Cluster of Candles Clusterof Candles 1- falling window keeps trend down 2- bullish shadows hint bears losing force 3 and 4- bullish engulfing pattern and rising window prove bulls’ have taken full control
  • 229.
    229 Confirmation Confirmation Bullish engulfing patterns andbullish shadows confirming support zone.
  • 230.
    230 Bearish engulfing patternbut what is confirmation? Bearish engulfing pattern but what is confirmation?
  • 231.
    231 P.R.O.F.I.T.S P Potent Insights otent Insights R ReduceRisks educe Risks O Outmaneuver your competition utmaneuver your competition F Find Pivotal Support /Resistance ind Pivotal Support /Resistance I Identify False Breakouts dentify False Breakouts T Terminate Bad Trades erminate Bad Trades S Stay Alive! tay Alive!
  • 232.
  • 233.
  • 234.
  • 235.
  • 236.
  • 237.
  • 238.
    238 F Find Pivotal ind Pivotal Supportand Support and Resistance Resistance
  • 239.
  • 240.
  • 241.
  • 242.
  • 243.
    243 Terminate Bad Trades Dothese candle lines give you a sense that the bulls are in full control?
  • 244.
  • 245.
    The race isnot always to the The race is not always to the swiftest, but to those who keep swiftest, but to those who keep running. running. 245
  • 246.
    246 How it allcomes together How it all comes together (hourly) (hourly)
  • 247.
    247 1 5 4 3 2 1- Rising Resistance Line 2-Shooting Star 2a – Bearish Engulfing 3- Falling Window 4- Bearish Divergence 5- Failure at window’s resistance Stay Alive- Confluence of signals for NASDAQ
  • 248.
    Every time thereis Every time there is a trade someone is a trade someone is wrong! wrong! 248
  • 249.
    249 Web site: www.candlecharts.com Web site: www. candlecharts.com E E- -mail: nison mail: nison@candlecharts.com @candlecharts.com Telephone: 732.254.8660 Telephone: 732.254.8660 Be sure to visit our site for our newest products and services!