Download to read offline
![IOSR Journal of Electronics and Communication Engineering (IOSR-JECE)
e-ISSN: 2278-2834,p- ISSN: 2278-8735.Volume 10, Issue 3, Ver. IV (May - Jun.2015), PP 62-68
www.iosrjournals.org
DOI: 10.9790/2834-10346268 www.iosrjournals.org 62 | Page
Comparative Study of Major Telecom Providers in India
Ashutosh Mishra, Mratyunjay Singh, Dr. Arvind Mittal, Prof.ArchanaSoni
M. Tech., Energy Centre, M.A.N.I.T. BhopalAssociate professor, Energy Centre, M.A.N.I.T. Bhopal
Abstract:Every company has its prime aim to Growth. With the changing times increase in competition has
become their core competencies and has a competitive edge over others. Business matrices like Net sales, Profit
(%) after tax,Total Income (Capitalization), Total Expenditures and level of satisfaction of the customers are
important indicators representing the stand of companies in the market. A comparative analysis of the major
telecom providers like Bharti AirtelLimited, Tata Communications Limited, Idea Cellular Limited, Reliance
Communications Limited,Vodafone India Limited and Bharat Sanchar Nigam Limited (BSNL)and in India has
been presented in this paper on the basis of secondary data which includes last five year Profit (%) after tax,
Total Income and Total Expenditures. This data has been collected to measure the level of satisfaction (LOS) of
the Indian telecommunication customers. This LOS was evaluated for various factors like network coverage;
customer service,tariffrates, plan and accountability of bill. An empirical study has been done and conclusions
have been brought out on the basis of the data collected though an online field surveyto achieve this objective.
An online questionnaire was prepared and was distributed to mobile phone users viasocial networking
sitesandemail for this purpose. The collected data was analysed with the help of prowess software. A sensitivity
analysis was done to verify the significance of the factors considered for determining the LOS. In this paper, it
was concluded that Bharti Airtel is the overall leader in all business matrices mentioned above.
1. Introduction
The Information and Communication Technology (ICT) Industry in India has perceived a tremendous
growth in the past 1.5 decade. With the boom in technology, the ICT Industry has experienced exciting
possibilities, ranging from a speedy expansion in size to gaining importance in the overall Indian economy. The
escalated effect of the ICT industry has led to the formation of a larger and more significant constituent of the
overall export market. It is aiding the improvement of the local and global competitiveness of Indian companies
across industries. The fact that the Indian ICT market is one of the mostrapidly growing ICT market in the world
for the third yearstands as a secured testament to the increased leverage ofICT by the domestic industry [2].
Talking about theTelecommunications sector, which is a sub domain of the ICT industry, the sector is growing
at a remarkable paceand India is the second largest telecom market globally since 2010. In April 2008,
Indiasurpassed the US as the second largest wireless market and as an indicator to the swelling global influence
ofIndian telecom companies. Seven Indians have featured inthe list of the world's 100 most prominent and
influentialtelecom leaders, compiled by Global Telecoms Business industry magazine [1]. Forthcoming services
such as4G will further augment the growth rate. Theworld's leading telecom handsets manufacturers, such
asNokia, Samsung, Micromax have their presence inIndia, along with leading global service companies
andinfrastructure majors, such as AT&T, Ericsson, Alcatel, Singapore Telecom and Siemens.India reached the
target of having 300 million telephonesubscribers; becoming the second largesttelecommunications network in
the world after China in June 2008. As per the report [3] India is having 800 million mobile subscribers and it
expected to reach 900 million by 2015. India is emerging as one of the fastest growing telecom markets in the
world. According to the report titled 'Mobile BRIC: Extreme Growth Ahead', BRIC (Brazil, Russia India and
China) India is the secondlargest mobile market in the BRIC nations, with 650 million mobile users, since 2012
(after China with 800million users). Indian telecom industry has had a long way and is expected to soar even
higher and the growth rate is expected to double with every passing year. To make full use of this opportunity, a
large number of players has entered into the telecom industry, the major being Airtel,Vodafone, Idea, BSNL,
Tata, Reliance.In today’s era, with the increase in telecom serviceproviders, it has become essential for the
variouscompanies to excel and have a competitive edge over the others. The firms must innovate and come up
with groundbreaking and novel services so as to stand out in the globalmarket. It would be quite interesting to
know about the performance of the various telecom service providers and to do a comparative analysis of them.
This can disclose a number of facts about their stand in the market and also what image do they carry among
their customers. A range of business matrices like year Total Expenses, net sales, Profit (%) after tax and
capitalization reflect the health and wealth of thecompanies and also affect the subscriber base. At the same time
it is essential to satisfy their customers in order to expand their subscriber base. Customer satisfaction is
significant to be cashed upon for an accentuated growth. The companies can be compared on the basis of a
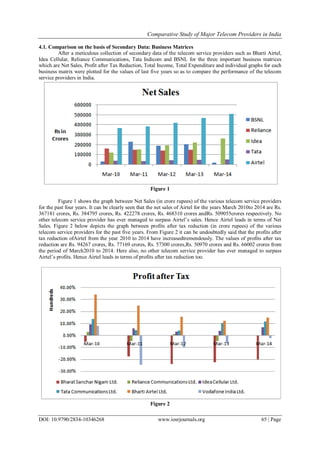
number of parameters. The most significant ones can be, total net sales profit after tax reduction, market
capitalization and level of satisfaction of the customers. Firstly, net sales is an important index of measuring a](https://image.slidesharecdn.com/j010346268-160805094407/85/J010346268-1-320.jpg)
![Comparative Study of Major Telecom Providers in India
DOI: 10.9790/2834-10346268 www.iosrjournals.org 63 | Page
company’s growth as it is the amount of sales generated by a company after the deduction of returns, allowances
for damaged or missing goods and any discounts allowed. The sales number reported on a company's financial
statements is a net sales number, reflecting these deductions. It gives a more accurate picture of the actual sales
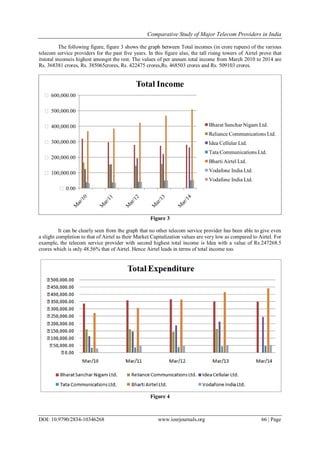
generated by the company, or the money that it expects to receive. Secondly, profit after tax reduction, is the
bottom line that reflects the position of the company as it is the net profits of a company after taxation. Thirdly,
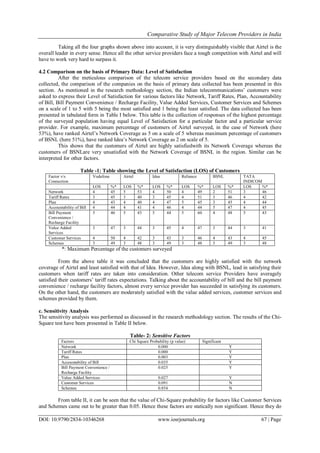
market capitalization, which is a measurement of corporate or economic size equal to the share price times the
number of shares outstanding of a public company, is regarded as a valuable index to appraise a firm. And
finally, level of satisfaction is the key indicator of the popularity of the service among the customers. Higher the
level of satisfaction of the customers, greater will be the net sales,profit after tax and market capitalization.
Thus, net sales, profit after tax, market capitalization and level of satisfaction have been included in our factors
to measure the performance of the telecom service providers in India. As a matter of fact, not much literature is
available concerning our present study. Thus, we have come up with a novel research which compares the
telecom companies’ onthe basis of the important business matrices as discussed above.
In this paper, a comparative analysis of the leading telecom service providers has been presented.
Companieslike Bharti Airtel, Vodafone Communication, Idea Cellular, RelianceCommunications and Tata
Communication in India have been chosenfor the analysis on the basis of secondary data whichincludes last five
year values of net sales, profit after taxreduction, and market capitalization. The Level ofSatisfaction (LOS) of
the Indian telecommunications’customers has also been compared. The LOS has beendetermined on the basis of
various factors like networkcoverage; tariff rates, plan, bill accountability, paymentconvenience, customer
service etc. To achieve thisobjective, an empirical study has been done andconclusions have been brought out
on the basis of the datacollected though an online field survey. Section IIdiscusses the notable features of the
leading telecomservice providers in the Bhopal region ofIndia. It is then followed by Section III which
illustratesthe research methodology adopted for the present study.Section IV explains the data analysis and
findings. Thelast section presents conclusions, limitations andrecommendations.
2. Telecom Service Providers in India
The major telecom service providers in India are as follows:-
2.1BSNL
Bharat Sanchar Nigam Limited (abbreviated BSNL) is an Indian state-owned Telecommunications
company headquartered in New Delhi, India. It was incorporated on 15 September 2000 and took over the
business of providing of telecom services and network management from the erstwhile Central Government
Departments of Telecom Services (DTS) and Telecom Operations (DTO), with effect from 1 October 2000 on a
going concern basis. It is the largest provider of fixed telephony, largest broadband services provider with more
than 60% Market share, and fifth largest mobile telephony provider in India. However, in recent years the
company's revenues and market share have plummeted into heavy losses due to intense competition in the
Indian telecommunications sector. BSNL is India's oldest and largest communication service provider (CSP). It
had a customer base of 117 million as of January 2014.
2.2Bharti Airtel
Bharti Airtel, formerly known as Bharti Tele-VenturesLimited (BTVL) is India's largest cellular
service providerwith more than 75 million subscribers as of August 2008[5]. It also offers fixed line services
and broadbandservices. It offers its TELECOM services under the Airtelbrand and is headed by Sunil Mittal.
The company alsoprovides telephone services and Internet access over DSLin 14 circles. The company
complements its mobile,broadband & telephone services with national andinternational long distance services.
The company also hasa submarine cable landing station at Chennai, whichconnects the submarine cable
connecting Chennai andSingapore. The company provides end-to-end data andenterprise services to the
corporate customers through itsnationwide fibre optic backbone, last mile connectivity infixed-line and mobile
circles, VSATs, ISP andinternational bandwidth access through the gateways andlanding station.
2.3 Vodafone Communication
Vodafone Communication, previously Hutchison Essar is a cellularoperator in India that covers 21
telecom circles in India.Despite the official name being Vodafone Communication, itsproducts are simply
branded Vodafone. It offers bothprepaid and postpaid GSM cellular phone coveragethroughout India and is
especially strong in the majormetros.Vodafone Communication provides 2G services based on 900 MHzand
1800 MHz digital GSM technology, offering voiceand data services in 21 of the country's 23 license areas [6].
2.4 Idea Cellular](https://image.slidesharecdn.com/j010346268-160805094407/85/J010346268-2-320.jpg)
![Comparative Study of Major Telecom Providers in India
DOI: 10.9790/2834-10346268 www.iosrjournals.org 64 | Page
Idea Cellular is a wireless telephony company operating invarious states in India. It initially started in
1995 as a joint venture between the Tatas, Aditya Birla Group and AT&Tby merging "'Wings Cellular'"
operating in MadhyaPradesh, UP West, Rajasthan and Tata Cellular as well asBirla AT&T
Communications.Initially having a very limited footprint in the GSM arena,the acquisition of Escotel in 2004
gave Idea a truly pan-India presence covering Maharashtra, Goa, Gujarat,Andhra Pradesh, Madhya Pradesh,
Chhattisgarh, UttarPradesh (East and West), Haryana, Kerala, Rajasthan andDelhi (inclusive of NCR) [7].The
company has its retail outlets under the "Idea n' U"banner. The company has also been the first to offerflexible
tariff plans for prepaid customers. It also offersGPRS services in urban areas.
2.5 Reliance Communications
Reliance Communications (formerly Reliance Infocomm),along with Reliance Telecom and Flag
Telecom, is part ofReliance Communications Ventures (RCoVL). Accordingto National Stock Exchange data,
Anil Ambani controls Telecommunications Company. It is the flagship company of the Reliance-Anil
DhirubhaiAmbani Group, comprising of power (Reliance Energy), financial services (Reliance Capital) and
telecom initiatives of the Reliance ADA Group. Reliance Infocomm is currently managed by Anil
DhirubhaiAmbani. It uses CDMA2000 1x technology. RelCom is also into Wireline Business throughout India
and has the largest OFC backbone architecture [roughly 110,000 km] in the country. The company also has
licenses in the GSM telecom services space for most of the Telecom Circles (zones in layman's words). It
currently operates in 8 circles and plans to launch in the others soon.
2.6 Tata Communication
Tata Teleservices Limited (TTSL) is a part of the Tata Group of companies, an Indian conglomerate. It
runs under the brand name Tata Communication in India, in various telecom circles of India. The company
forms part of the Tata Group's presence in the Telecommunication Industry in India, along with Tata
Teleservices (Maharashtra) Limited (TTML) and TATA COMMUNICATIONS LTD. It was founded in the
year 2000 and its chairman is Mr. Ratan Tata. In February this year, TTSL announced that it would provide
CDMA mobile services targeted towards the youth, in a joint venture with Virgin, UK, on a Franchisee model
basis [9].
3. Research Methodology
In this paper, a study to compare the major telecom service providers in India is presented. Telecom
Service Providers such as Bharti Airtel, Idea Cellular, Reliance Communications, Tata Indicom and BSNL are
compared. For this purpose secondary data was collected pertaining to last five year values of three important
business matrices which are Market Capitalization, Net Sales and Profit after Tax Reduction. This data was
collected from Capitaline Database [10] which is an online corporate database consisting of financial and
nonfinancial information on more than 12000 companies. After collection of secondary data, graphs were
plotted for each of the business matrices which present the comparison of the performance of the telecom
service providers for the last five years for that particular business matrix. In the present study, the comparison
of the telecom service providers is also presented in terms level of satisfaction of their customers. This was done
for factors such as Tariff Rates, Plan, Accountability of Bill, Bill PaymentConvenience / Recharge Facility,
Value Added Services, Customer Services, and Schemes. In order to determine the level of satisfaction of Indian
telecommunication customers, an online field survey was conducted. For this purpose, an online questionnaire
was prepared on the website qualtricsand was sent to a number of people in Bhopal Region via e-mail and
various social networking sites. Hence primary data was collected to get real time results. A total of 596
respondents filled the questionnaire out of which 480 were completely filled. The questionnaire comprised of
questions regarding the demographics of the respondents, the name of the service provider whose service they
are availing and their monthly expenditure. The respondents were also asked to express their level of satisfaction
forthe various factors on a scale of 1 to 5, 5 being the most satisfied and 1 being the least satisfied.
The factors used for determining the level of satisfaction of Indian telecommunication customers may
or may not be significant in determining it. Hence, in order to find out which of these factors are significant and
to justify that the factors used truly help in determining the level of satisfaction, a sensitivity analysis was done
with the help of SPSS (Statistical Package for the Social Sciences) software version 12.0 for windows. A
statistical hypothesis test namely Chi Square test was applied on the responses received to the question
enquiring the level of satisfaction of the customers. Chi Square Test gives thevalue of a probability called Chi
Square Probability, say P.If the value of P is less than 0.05 then the factor on whichit is applied is said to be
Sensitive Factor otherwiseNonsensitive Factor. The findings obtained by analysing the data are shown in the
following section.
4. Data Analysis and Findings](https://image.slidesharecdn.com/j010346268-160805094407/85/J010346268-3-320.jpg)
![Comparative Study of Major Telecom Providers in India
DOI: 10.9790/2834-10346268 www.iosrjournals.org 68 | Page
no play an important role in determining the level of satisfaction of the customers. Rest six factors which are
Network, Tariff Rates, Plan, Accountability of Bill, Bill Payment Convenience / Recharge Facility and Value
Added Services came out to be statically significant and are hence called as Sensitive Factors. This analysis
proves that the factors chosen for determining the level of satisfaction of the customers are Significant except
for customer services and schemes. Therefore, the responses collected for these two factors can be ignored.
5. Conclusions, Limitations and Recommendations
After a detailed comparison of the telecom service provider companies in India, it was found out that
Airtel outdoes its rest of the competitors in the case of all the three business matrices used which are Net Sales,
Profit after Tax Reduction and Market capitalization. Also the level of satisfaction of the customers of Airtel is
higher than that of other customers. As the analysis done in this paper is totally based on thedata collected from
the online survey, therefore the data collection could be biased as mostly young people in the age group of 15 to
35 years use the internet. Therefore responses of users more than 35 or say 40 years may not have been
recorded. To overcome this limitation, a paperback form of the questionnaire can be used and data can be
collected by personally going to users from all age groups. Secondly, the scope of the research done in this
paper is limited to the Bhopal region. So, the results achieved show the LOS and LOA of the mobile users in
Bhopal region only. This scope could be widened to cover whole of India to get a nationwide picture.
References
[1]. IBEF 2008, http://www.ibef.org/artdispview.aspx?in
[2]. Gartner 2006, http://www.gartner.com/DisplayDocument?doc_cd=138416.
[3]. Annual Report 2013-14
[4]. http://en.wikipedia.org/wiki/BSNL
[5]. http://en.wikipedia.org/wiki/Bharti_Airtel
[6]. http://en.wikipedia.org/wiki/Vodafone
[7]. http://en.wikipedia.org/wiki/Idea_cellular
[8]. http://en.wikipedia.org/wiki/Reliance_Communications
[9]. http://en.wikipedia.org/wiki/Tata_Indicom
[10]. www.capitalince.com](https://image.slidesharecdn.com/j010346268-160805094407/85/J010346268-7-320.jpg)

This document presents a comparative study of major telecom service providers in India based on secondary data analysis and a customer satisfaction survey. It analyzes the providers over the last five years on business metrics like net sales, profit after tax, total income, total expenditures, and market capitalization. It also evaluates customer satisfaction levels for the providers based on factors like network coverage, tariffs, plans, billing, and customer service. The study found that Bharti Airtel led in all business metrics over the period analyzed and had the highest overall customer satisfaction levels among the major Indian telecom providers.


