Download to read offline


![Logstash
grok
2013-11-10 19:41:25.321 [main]
INFO o.a.camel.impl.DefaultCamelContext
!
- Apache Camel 2.11.1 (CamelContext: camel-1) started in 4.450 seconds
!28](https://image.slidesharecdn.com/jdaylisteningtoyourapp-131116134154-phpapp01/85/J-Day-Krakow-Listen-to-the-sounds-of-your-application-52-320.jpg)
![Logstash
grok
2013-11-10 19:41:25.321 [main]
INFO o.a.camel.impl.DefaultCamelContext
!
- Apache Camel 2.11.1 (CamelContext: camel-1) started in 4.450 seconds
time
2013-11-10 19:41:25.321
thread
main
loglevel
INFO
source
o.a.camel.impl.DefaultCamelContext
message
Apache Camel 2.11.1 (CamelContext: camel-1) started in 4.450 seconds
!28](https://image.slidesharecdn.com/jdaylisteningtoyourapp-131116134154-phpapp01/85/J-Day-Krakow-Listen-to-the-sounds-of-your-application-53-320.jpg)
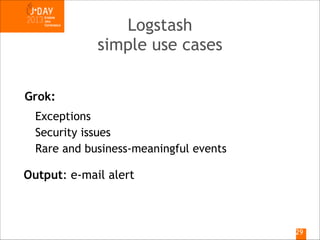
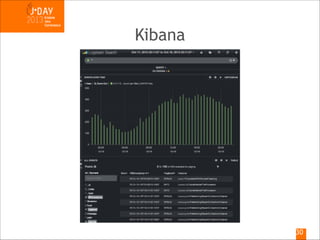
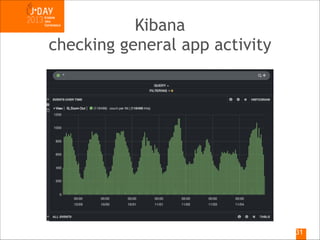
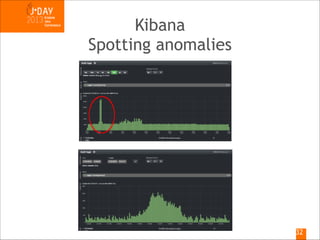
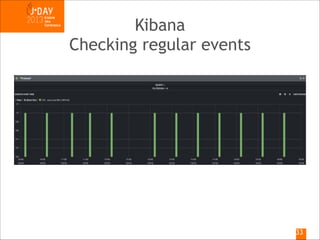
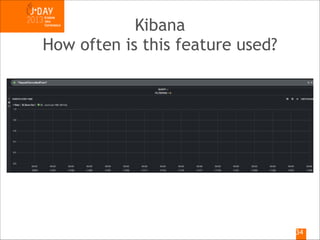
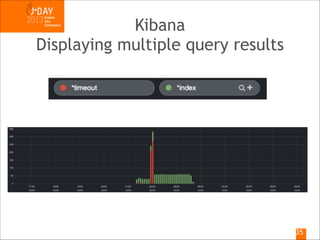


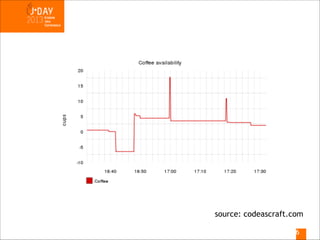
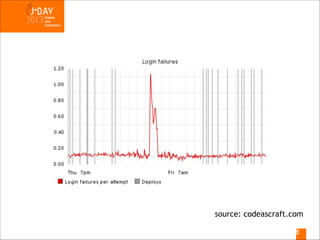
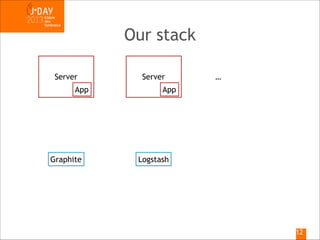
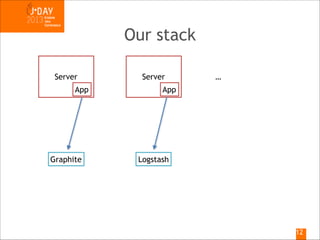
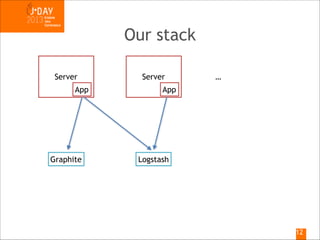
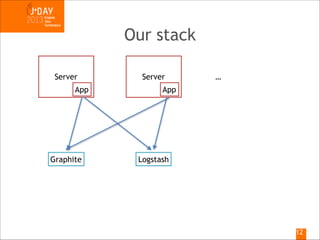
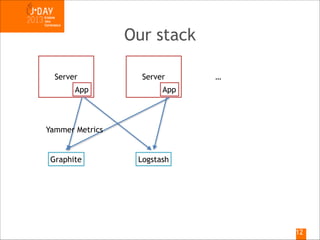
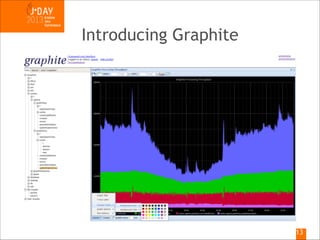
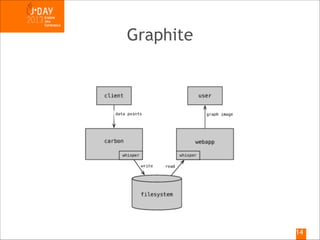
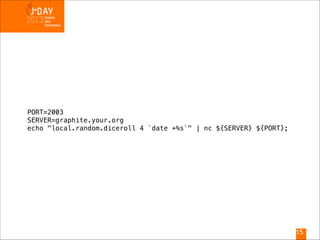
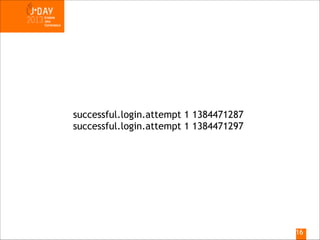
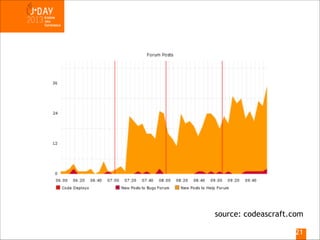
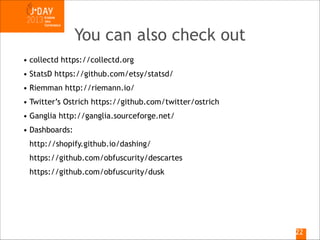
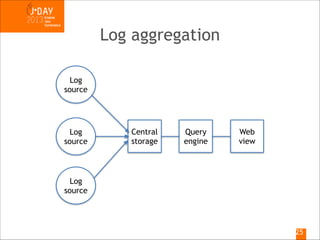
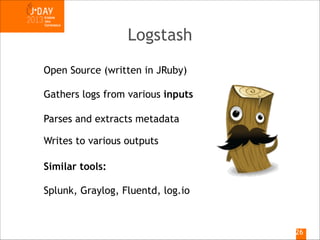
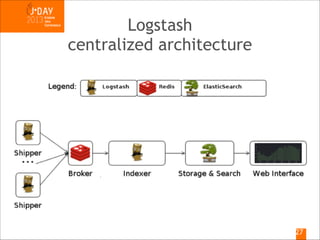
This document discusses monitoring application performance and logs. It introduces the Graphite tool for collecting and visualizing metrics. Logstash is presented as a tool for collecting logs from various sources, parsing them, and outputting to destinations like Elasticsearch. Kibana is shown to provide a web interface for visualizing and querying logs stored in Elasticsearch. The document provides examples of using these tools to monitor application usage patterns, detect anomalies, and troubleshoot issues.