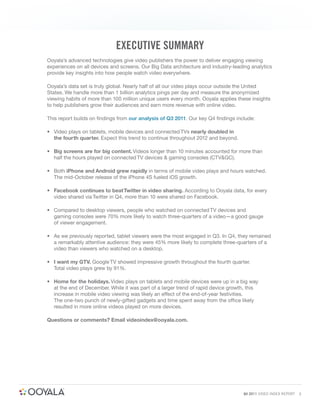
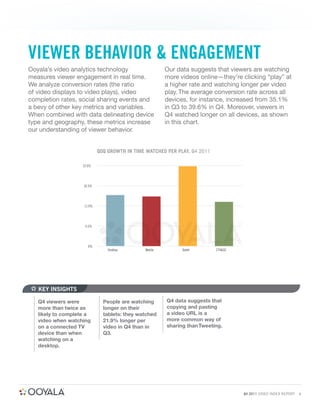
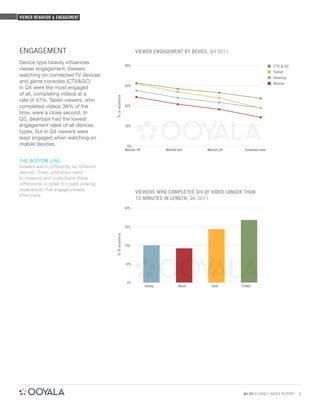
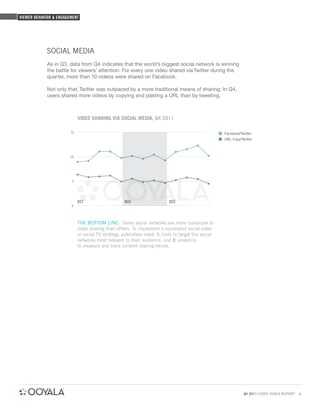
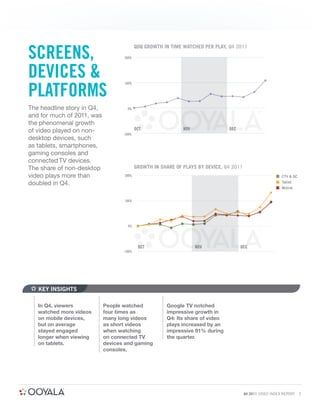
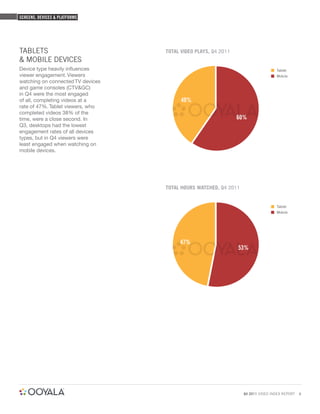
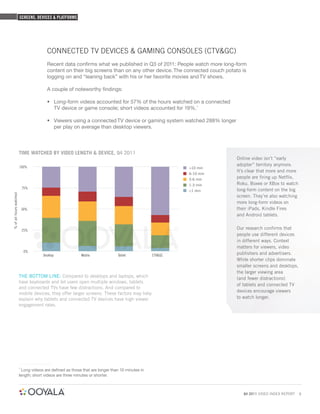
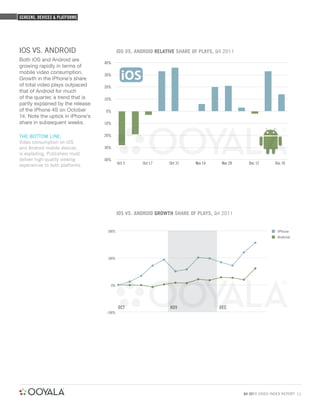
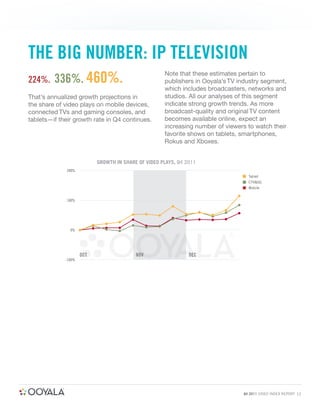
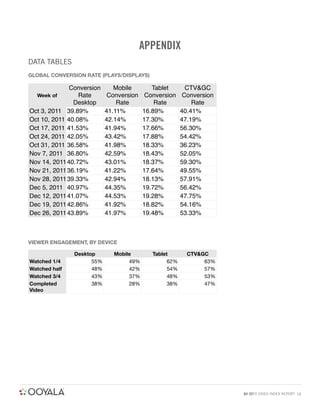
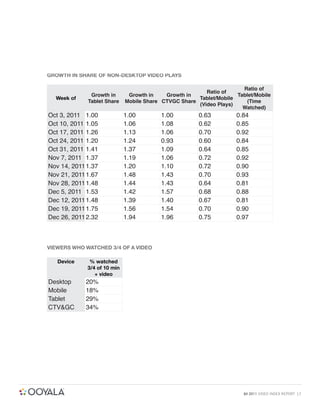
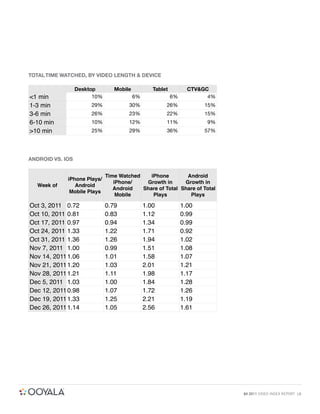
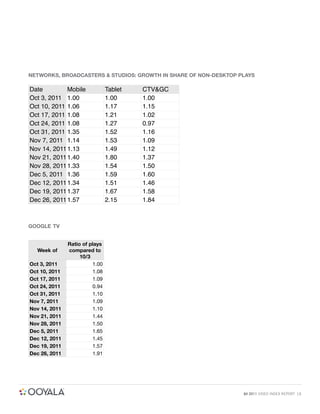
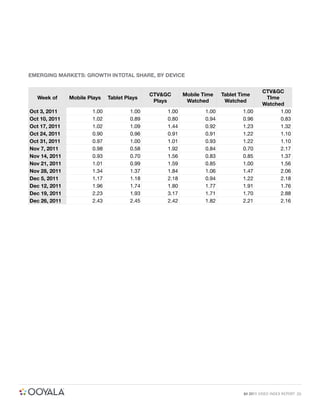
This document analyzes video viewing trends in Q4 2011 based on data from Ooyala. Some key findings include:
- Video plays on tablets, mobile devices, and connected TVs nearly doubled in Q4 from Q3. Engagement also increased across all devices as viewers watched longer videos per play.
- Connected TV devices and gaming consoles saw the highest engagement, with viewers 70% more likely to watch 3/4 of longer videos (>10 min). Tablet viewers were also highly engaged.
- Both iOS and Android platforms grew significantly in Q4 for mobile video plays and hours watched. iPhone growth was boosted by the October release of the iPhone 4S.
- Facebook remained
Since it launched August 2015 and became available to all users this January 2016, Facebook Live has quickly become a game changer. Media companies like CNN, Viacom, the New York Times, and Buzz Feed have used Live to experiment with new video formats and expand their audiences.
More free ebooks here at www.freepdfonline.co.uk
New Business Model Exercice: CrowdTV, a platform dedicated to TV channels, TV content producers and viewers, where new content is viewed, rated and commented by invited users. TV channels and producers can get quality insights on their new content
Social TV: making TV a social & participative experienceYann Ruello
Talking about Social TV:
- Where is Social TV today?
- What are the main trends?
- Return on experience from the Orange Social TV program.
Keynote presented during TV Connect 2016.
Social TV: making TV a social & participative experienceYann Ruello
Talking about Social TV:
- Where is Social TV today?
- What are the main trends?
- Return on experience from the Orange Social TV program.
Keynote presented during TV Connect 2016.
Adobe Digital Index Q1 2015 Digital Video ReportAdobe
Driven by an increase in the number of connected TV devices (Roku, Apple TV, X-Box One, and Smart TV's) given as gifts during the 2014 holiday season, the first quarter of 2015 continued the record breaking trend of viewers watching video content on devices plugged in to the
Internet. Video viewing behaviors shifted in year-over-year (YoY) terms and varied depending on the type of content being viewed; which ranged from free video clips supported primarily by advertising (Online Video) to premium shows accessed through an authenticated app-based or TV subscription service (TV Everywhere). This report covers both the established and the evolving trends within the digital video viewing space. It aims to provide insightful viewpoints for content providers, consumers, and advertisers.
Watching online video is growing massively and is changing how video content is viewed, when and by whom.
Mediabrands Marketing Sciences initiated a research study to report a full overview of trends in online video and TV consumption in The Netherlands, based on the data gathered by SKO, GfK Media Efficiency Panel and other sources.
Every year for the past few years seems to have been heralded as “The Year of the Connected TV”. Few doubt that the big screen in the living room will be an important channel for everything the web has to offer, but there are question marks over the extent to which Connected or Smart TV, as it stands, has captured the imagination and viewing hours of consumers today.
Is it the year of connected TV already, or is it still to be realised?
In this report we find out the views of the GB general public. We find out who has them, do they actually connect, what their experience is and what services do they really want.
The mobile video experience: A viewer’s journey from discovery to advocacyData N Charts
This report looks into the factors driving mobile video growth and maps the consumer journey from mobile discovery to advocacy uncovering consumer attitudes towards paid video and the kind of mobile ads they prefer to see.
Pesquisa Accenture Multi-tasking and Taking Control. O estudo realizado com 3,5 mil pessoas, em seis países, apontou que conquistar a atenção exclusiva dos telespectadores está mais difícil. O consumidor moderno concilia a TV com outras atividades.
Media and Mobile Trends 2015: Where and How Are Consumers Tuning In?Deloitte United States
Explore the results of Deloitte’s ninth edition of the Digital Democracy Survey, including:
•Evolving media consumption habits, including preferences related to binge watching, streaming video, and over-the-top viewing habits
•Effectiveness of various advertising methods, both traditional and online
•Changing consumer behaviors related to mobile device ownership and usage
For more information visit www.deloitte.com/us/tmtrends.
You can't just "tell" your story anymore. You need to jazz it up. You need to get above the noise of everyone else being a storyteller. How do you do that? Video. This slide presentation provides 5 helpful tips on using video to "add some fight" to your story!
Check out the recorded webinar and a slide-by-slide walkthrough at:
http://blog.limelight.com/2013/02/add-some-fight-into-your-story-with-video/
What is the TDS Return Filing Due Date for FY 2024-25.pdfseoforlegalpillers
It is crucial for the taxpayers to understand about the TDS Return Filing Due Date, so that they can fulfill your TDS obligations efficiently. Taxpayers can avoid penalties by sticking to the deadlines and by accurate filing of TDS. Timely filing of TDS will make sure about the availability of tax credits. You can also seek the professional guidance of experts like Legal Pillers for timely filing of the TDS Return.
The world of search engine optimization (SEO) is buzzing with discussions after Google confirmed that around 2,500 leaked internal documents related to its Search feature are indeed authentic. The revelation has sparked significant concerns within the SEO community. The leaked documents were initially reported by SEO experts Rand Fishkin and Mike King, igniting widespread analysis and discourse. For More Info:- https://news.arihantwebtech.com/search-disrupted-googles-leaked-documents-rock-the-seo-world/
3.0 Project 2_ Developing My Brand Identity Kit.pptxtanyjahb
A personal brand exploration presentation summarizes an individual's unique qualities and goals, covering strengths, values, passions, and target audience. It helps individuals understand what makes them stand out, their desired image, and how they aim to achieve it.
LA HUG - Video Testimonials with Chynna Morgan - June 2024Lital Barkan
Have you ever heard that user-generated content or video testimonials can take your brand to the next level? We will explore how you can effectively use video testimonials to leverage and boost your sales, content strategy, and increase your CRM data.🤯
We will dig deeper into:
1. How to capture video testimonials that convert from your audience 🎥
2. How to leverage your testimonials to boost your sales 💲
3. How you can capture more CRM data to understand your audience better through video testimonials. 📊
Unveiling the Secrets How Does Generative AI Work.pdfSam H
At its core, generative artificial intelligence relies on the concept of generative models, which serve as engines that churn out entirely new data resembling their training data. It is like a sculptor who has studied so many forms found in nature and then uses this knowledge to create sculptures from his imagination that have never been seen before anywhere else. If taken to cyberspace, gans work almost the same way.
Discover the innovative and creative projects that highlight my journey throu...dylandmeas
Discover the innovative and creative projects that highlight my journey through Full Sail University. Below, you’ll find a collection of my work showcasing my skills and expertise in digital marketing, event planning, and media production.
Premium MEAN Stack Development Solutions for Modern BusinessesSynapseIndia
Stay ahead of the curve with our premium MEAN Stack Development Solutions. Our expert developers utilize MongoDB, Express.js, AngularJS, and Node.js to create modern and responsive web applications. Trust us for cutting-edge solutions that drive your business growth and success.
Know more: https://www.synapseindia.com/technology/mean-stack-development-company.html
RMD24 | Retail media: hoe zet je dit in als je geen AH of Unilever bent? Heid...BBPMedia1
Grote partijen zijn al een tijdje onderweg met retail media. Ondertussen worden in dit domein ook de kansen zichtbaar voor andere spelers in de markt. Maar met die kansen ontstaan ook vragen: Zelf retail media worden of erop adverteren? In welke fase van de funnel past het en hoe integreer je het in een mediaplan? Wat is nu precies het verschil met marketplaces en Programmatic ads? In dit half uur beslechten we de dilemma's en krijg je antwoorden op wanneer het voor jou tijd is om de volgende stap te zetten.
Enterprise Excellence is Inclusive Excellence.pdfKaiNexus
Enterprise excellence and inclusive excellence are closely linked, and real-world challenges have shown that both are essential to the success of any organization. To achieve enterprise excellence, organizations must focus on improving their operations and processes while creating an inclusive environment that engages everyone. In this interactive session, the facilitator will highlight commonly established business practices and how they limit our ability to engage everyone every day. More importantly, though, participants will likely gain increased awareness of what we can do differently to maximize enterprise excellence through deliberate inclusion.
What is Enterprise Excellence?
Enterprise Excellence is a holistic approach that's aimed at achieving world-class performance across all aspects of the organization.
What might I learn?
A way to engage all in creating Inclusive Excellence. Lessons from the US military and their parallels to the story of Harry Potter. How belt systems and CI teams can destroy inclusive practices. How leadership language invites people to the party. There are three things leaders can do to engage everyone every day: maximizing psychological safety to create environments where folks learn, contribute, and challenge the status quo.
Who might benefit? Anyone and everyone leading folks from the shop floor to top floor.
Dr. William Harvey is a seasoned Operations Leader with extensive experience in chemical processing, manufacturing, and operations management. At Michelman, he currently oversees multiple sites, leading teams in strategic planning and coaching/practicing continuous improvement. William is set to start his eighth year of teaching at the University of Cincinnati where he teaches marketing, finance, and management. William holds various certifications in change management, quality, leadership, operational excellence, team building, and DiSC, among others.
Business Valuation Principles for EntrepreneursBen Wann
This insightful presentation is designed to equip entrepreneurs with the essential knowledge and tools needed to accurately value their businesses. Understanding business valuation is crucial for making informed decisions, whether you're seeking investment, planning to sell, or simply want to gauge your company's worth.
Personal Brand Statement:
As an Army veteran dedicated to lifelong learning, I bring a disciplined, strategic mindset to my pursuits. I am constantly expanding my knowledge to innovate and lead effectively. My journey is driven by a commitment to excellence, and to make a meaningful impact in the world.
[Note: This is a partial preview. To download this presentation, visit:
https://www.oeconsulting.com.sg/training-presentations]
Sustainability has become an increasingly critical topic as the world recognizes the need to protect our planet and its resources for future generations. Sustainability means meeting our current needs without compromising the ability of future generations to meet theirs. It involves long-term planning and consideration of the consequences of our actions. The goal is to create strategies that ensure the long-term viability of People, Planet, and Profit.
Leading companies such as Nike, Toyota, and Siemens are prioritizing sustainable innovation in their business models, setting an example for others to follow. In this Sustainability training presentation, you will learn key concepts, principles, and practices of sustainability applicable across industries. This training aims to create awareness and educate employees, senior executives, consultants, and other key stakeholders, including investors, policymakers, and supply chain partners, on the importance and implementation of sustainability.
LEARNING OBJECTIVES
1. Develop a comprehensive understanding of the fundamental principles and concepts that form the foundation of sustainability within corporate environments.
2. Explore the sustainability implementation model, focusing on effective measures and reporting strategies to track and communicate sustainability efforts.
3. Identify and define best practices and critical success factors essential for achieving sustainability goals within organizations.
CONTENTS
1. Introduction and Key Concepts of Sustainability
2. Principles and Practices of Sustainability
3. Measures and Reporting in Sustainability
4. Sustainability Implementation & Best Practices
To download the complete presentation, visit: https://www.oeconsulting.com.sg/training-presentations
RMD24 | Debunking the non-endemic revenue myth Marvin Vacquier Droop | First ...BBPMedia1
Marvin neemt je in deze presentatie mee in de voordelen van non-endemic advertising op retail media netwerken. Hij brengt ook de uitdagingen in beeld die de markt op dit moment heeft op het gebied van retail media voor niet-leveranciers.
Retail media wordt gezien als het nieuwe advertising-medium en ook mediabureaus richten massaal retail media-afdelingen op. Merken die niet in de betreffende winkel liggen staan ook nog niet in de rij om op de retail media netwerken te adverteren. Marvin belicht de uitdagingen die er zijn om echt aansluiting te vinden op die markt van non-endemic advertising.
2. TABLE OF CONTENTS
EXECUTIVE SUMMARY .................................................................... 3
VIEWER BEHAVIOR & ENGAGEMENT ............................................. 4
Engagement ........................................................................................ 5
Social Media ........................................................................................ 6
SCREENS, DEVICES & PLATFORMS ............................................... 7
Tablets & Mobile Devices..................................................................... 8
Connected TV Devices & Gaming Consoles ....................................... 9
Video Trends: Google TV .....................................................................10
iOS vs. Android ..................................................................................11
THE BIG NUMBER: IP TELEVISION ................................................12
GLOBAL AUDIENCES.......................................................................13
Bit Rate & Connection Speed ............................................................14
Emerging Media Markets ...................................................................15
APPENDIX .........................................................................................16
Data Tables .........................................................................................16
Methodology ..................................................................................... 21
Glossary ............................................................................................ 22
Metrics & Definitions ......................................................................... 22
Disclaimers & Assumptions ............................................................... 23
Q4 2011 VIDEO INDEX REPORT 2
3. EXECUTIVE SUMMARY
Ooyala’s advanced technologies give video publishers the power to deliver engaging viewing
experiences on all devices and screens. Our Big Data architecture and industry-leading analytics
provide key insights into how people watch video everywhere.
Ooyala’s data set is truly global. Nearly half of all our video plays occur outside the United
States. We handle more than 1 billion analytics pings per day and measure the anonymized
viewing habits of more than 100 million unique users every month. Ooyala applies these insights
to help publishers grow their audiences and earn more revenue with online video.
This report builds on findings from our analysis of Q3 2011. Our key Q4 findings include:
• Video plays on tablets, mobile devices and connected TVs nearly doubled in
the fourth quarter. Expect this trend to continue throughout 2012 and beyond.
• Big screens are for big content. Videos longer than 10 minutes accounted for more than
half the hours played on connected TV devices & gaming consoles (CTV&GC).
• Both iPhone and Android grew rapidly in terms of mobile video plays and hours watched.
The mid-October release of the iPhone 4S fueled iOS growth.
• Facebook continues to beat Twitter in video sharing. According to Ooyala data, for every
video shared via Twitter in Q4, more than 10 were shared on Facebook.
• Compared to desktop viewers, people who watched on connected TV devices and
gaming consoles were 70% more likely to watch three-quarters of a video—a good gauge
of viewer engagement.
• As we previously reported, tablet viewers were the most engaged in Q3. In Q4, they remained
a remarkably attentive audience: they were 45% more likely to complete three-quarters of a
video than viewers who watched on a desktop.
• I want my GTV. Google TV showed impressive growth throughout the fourth quarter.
Total video plays grew by 91%.
• Home for the holidays. Video plays on tablets and mobile devices were up in a big way
at the end of December. While it was part of a larger trend of rapid device growth, this
increase in mobile video viewing was likely an effect of the end-of-year festivities.
The one-two punch of newly-gifted gadgets and time spent away from the office likely
resulted in more online videos played on more devices.
Questions or comments? Email videoindex@ooyala.com.
Q4 2011 VIDEO INDEX REPORT 3
4. VIEWER BEHAVIOR & ENGAGEMENT
Ooyala’s video analytics technology Our data suggests that viewers are watching
measures viewer engagement in real time. more videos online—they’re clicking “play” at
We analyze conversion rates (the ratio a higher rate and watching longer per video
of video displays to video plays), video play. The average conversion rate across all
completion rates, social sharing events and devices, for instance, increased from 35.1%
a bevy of other key metrics and variables. in Q3 to 39.6% in Q4. Moreover, viewers in
When combined with data delineating device Q4 watched longer on all devices, as shown
type and geography, these metrics increase in this chart.
our understanding of viewer behavior.
QOQ GROWTH IN TIME WATCHED PER PLAY, Q4 2011
22.0%
16.5%
11.0%
5.5%
0%
Desktop Mobile Tablet CTV&GC
KEY INSIGHTS
Q4 viewers were People are watching Q4 data suggests that
more than twice as longer on their copying and pasting
likely to complete a tablets: they watched a video URL is a
video when watching 21.9% longer per more common way of
on a connected TV video in Q4 than in sharing than Tweeting.
device than when Q3.
watching on a
desktop.
Q4 2011 VIDEO INDEX REPORT 4
5. VIEWER BEHAVIOR & ENGAGEMENT
ENGAGEMENT VIEWER ENGAGEMENT BY DEVICE, Q4 2011
Device type heavily influences
80% CTV & GC
viewer engagement. Viewers
Tablet
watching on connected TV devices Desktop
and game consoles (CTV&GC) Mobile
60%
in Q4 were the most engaged
of all, completing videos at a
% of audience
rate of 47%. Tablet viewers, who
completed videos 38% of the 40%
time, were a close second. In
Q3, desktops had the lowest
engagement rates of all devices 20%
types, but in Q4 viewers were
least engaged when watching on
mobile devices. 0%
Watched 1/4 Watched half Watched 3/4 Completed video
THE BOTTOM LINE:
Viewers watch differently on different
devices. Video publishers need
to measure and understand these
differences in order to create viewing
experiences that engage viewers
VIEWERS WHO COMPLETED 3/4 OF VIDEO LONGER THAN
effectively.
10 MINUTES IN LENGTH, Q4 2011
40%
30%
% of audience
20%
10%
0%
Desktop Mobile Tablet CTV&GC
Q4 2011 VIDEO INDEX REPORT 5
6. VIEWER BEHAVIOR & ENGAGEMENT
SOCIAL MEDIA
As in Q3, data from Q4 indicates that the world’s biggest social network is winning
the battle for viewers’ attention. For every one video shared via Twitter during the
quarter, more than 10 videos were shared on Facebook.
Not only that, Twitter was outpaced by a more traditional means of sharing: In Q4,
users shared more videos by copying and pasting a URL than by tweeting.
VIDEO SHARING VIA SOCIAL MEDIA, Q4 2011
15 Facebook/Twitter
URL Copy/Twitter
10
5
OCT NOV DEC
0
THE BOTTOM LINE: Some social networks are more conducive to
video sharing than others. To implement a successful social video
or social TV strategy, publishers need: 1: tools to target the social
networks most relevant to their audience, and 2: analytics
to measure and track content sharing trends.
Q4 2011 VIDEO INDEX REPORT 6
7. SCREENS,
QOQ GROWTH IN TIME WATCHED PER PLAY, Q4 2011
200%
DEVICES &
PLATFORMS
100%
The headline story in Q4, 0%
and for much of 2011, was
the phenomenal growth
of video played on non- OCT NOV DEC
-100%
desktop devices, such
as tablets, smartphones,
gaming consoles and
connected TV devices.
The share of non-desktop GROWTH IN SHARE OF PLAYS BY DEVICE, Q4 2011
video plays more than 200% CTV & GC
doubled in Q4. Tablet
Mobile
100%
0%
OCT NOV DEC
-100%
KEY INSIGHTS
In Q4, viewers People watched Google TV notched
watched more videos four times as impressive growth in
on mobile devices, many long videos Q4: Its share of video
but on average as short videos plays increased by an
stayed engaged when watching impressive 91% during
longer when viewing on connected TV the quarter.
on tablets. devices and gaming
consoles.
Q4 2011 VIDEO INDEX REPORT 7
8. SCREENS, DEVICES & PLATFORMS
TABLETS TOTAL VIDEO PLAYS, Q4 2011
& MOBILE DEVICES
Device type heavily influences Tablet
viewer engagement. Viewers Mobile
watching on connected TV devices
and game consoles (CTV&GC)
in Q4 were the most engaged
of all, completing videos at a 40%
rate of 47%. Tablet viewers, who
completed videos 38% of the
time, were a close second. In 60%
Q3, desktops had the lowest
engagement rates of all devices
types, but in Q4 viewers were
least engaged when watching on
mobile devices.
TOTAL HOURS WATCHED, Q4 2011
Tablet
Mobile
47%
53%
Q4 2011 VIDEO INDEX REPORT 8
9. SCREENS, DEVICES & PLATFORMS
CONNECTED TV DEVICES & GAMING CONSOLES (CTV&GC)
Recent data confirms what we published in Q3 of 2011: People watch more long-form
content on their big screens than on any other device. The connected couch potato is
logging on and “leaning back” with his or her favorite movies and TV shows.
A couple of noteworthy findings:
• Long-form videos accounted for 57% of the hours watched on a connected
TV device or game console; short videos accounted for 19%.1
• Viewers using a connected TV device or gaming system watched 288% longer
per play on average than desktop viewers.
TIME WATCHED BY VIDEO LENGTH & DEVICE, Q4 2011
Online video isn’t “early
100%
adopter” territory anymore.
>10 min
It’s clear that more and more
6-10 min
3-6 min
people are firing up Netflix,
1-3 min Roku, Boxee or XBox to watch
75%
<1 min long-form content on the big
% of all hours watched
screen. They’re also watching
more long-form videos on
50% their iPads, Kindle Fires
and Android tablets.
25%
Our research confirms that
people use different devices
in different ways. Context
matters for viewers, video
0%
Desktop Mobile Tablet CTV&GC publishers and advertisers.
While shorter clips dominate
smaller screens and desktops,
the larger viewing area
THE BOTTOM LINE: Compared to desktops and laptops, which (and fewer distractions)
have keyboards and let users open multiple windows, tablets
of tablets and connected TV
and connected TVs have few distractions. And compared to
devices encourage viewers
mobile devices, they offer larger screens. These factors may help
explain why tablets and connected TV devices have high viewer to watch longer.
engagement rates.
1
Long videos are defined as those that are longer than 10 minutes in
length; short videos are three minutes or shorter.
Q4 2011 VIDEO INDEX REPORT 9
10. SCREENS, DEVICES & PLATFORMS
VIDEO TRENDS: GOOGLE TV
While still small when compared to all online video watched in Q4, Google TV’s share
of video plays increased by an impressive 91% during the quarter. After a series of
false starts, Google TV may finally be gaining broader traction with consumers.
GOOGLE TV: GROWTH IN SHARE OF VIDEO PLAYS, Q4 2011
100%
50%
0%
-50%
OCT NOV DEC
-100%
Ratio of plays compared to 10/1
Q4 2011 VIDEO INDEX REPORT 10
11. SCREENS, DEVICES & PLATFORMS
IOS VS. ANDROID IOS VS. ANDROID RELATIVE SHARE OF PLAYS, Q4 2011
Both iOS and Android are
40%
growing rapidly in terms of
mobile video consumption. 30%
Growth in the iPhone’s share
of total video plays outpaced 20%
that of Android for much
of the quarter, a trend that is 10%
partly explained by the release
of the iPhone 4S on October 0%
14. Note the uptick in iPhone’s
share in subsequent weeks. 10%
THE BOTTOM LINE: 20%
Video consumption on iOS
and Android mobile devices 30%
is exploding. Publishers must
deliver high-quality viewing 40%
Oct 3 Oct 17 Oct 31 Nov 14 Nov 28 Dec 12 Dec 26
experiences to both platforms.
IOS VS. ANDROID GROWTH SHARE OF PLAYS, Q4 2011
200% IPhone
Android
100%
0%
OCT NOV DEC
-100%
Q4 2011 VIDEO INDEX REPORT 11
12. THE BIG NUMBER: IP TELEVISION
336%. 460%.
Note that these estimates pertain to
224%. publishers in Ooyala’s TV industry segment,
which includes broadcasters, networks and
That’s annualized growth projections in studios. All our analyses of this segment
the share of video plays on mobile devices, indicate strong growth trends. As more
connected TVs and gaming consoles, and broadcast-quality and original TV content
tablets—if their growth rate in Q4 continues. becomes available online, expect an
increasing number of viewers to watch their
favorite shows on tablets, smartphones,
Rokus and Xboxes.
GROWTH IN SHARE OF VIDEO PLAYS, Q4 2011
200%
Tablet
CTV&GC
Mobile
100%
0%
OCT NOV DEC
-100%
Q4 2011 VIDEO INDEX REPORT 12
13. GLOBAL AUDIENCES
Ooyala’s data set covers video plays across The growth in online video exhibited during
more than 5,000 domains in more than Q4 is reflective of a global trend: Viewers
130 countries. On a monthly basis, more are buying more devices, everywhere, and
than 100 million viewers watch video watching more online video than ever before.
on an Ooyala-powered site. Various analysts project that worldwide
by 2015 there will be 500 million connected
TVs,2 1 billion smartphones3 and 325 million
tablets.4 These new screens make up a global
audience of 1.2 billion viewers.5
KEY INSIGHTS
Connection speeds, as measured by Emerging economies are recording
Ooyala’s video technology, vary by remarkable growth in online video
region, with relatively high bit rates in consumption on mobiles, tablets
much of North America, Europe and and connected TV devices
parts of Asia, such as South Korea. and gaming consoles.
2
“Connected TV Shipments to Exceed 138 Million Units in 2015, Putting Total Worldwide at 500 Million,” via Display Research, July 5, 2011.
3
“Worldwide Smartphone Market Expected to Grow 55% in 2011 and Approach Shipments of One Billion in 2015,” via IDC, June 9, 2011.
4
“Gartner Says Apple Will Have a Free Run in Tablet Market Holiday Season as Competitors Continue to Lag,” via Gartner, September 11, 2011.
5
“More than 200 Billion Online Videos Viewed Globally in October,” via comScore, October 2011.
Q4 2011 VIDEO INDEX REPORT 13
14. GLOBAL AUDIENCES
BIT RATE & CONNECTION SPEED
When Ooyala’s video player loads, it gauges a number of variables, including CPU
status, network connection speed and available encodings. Accordingly, Ooyala’s
technology delivers the appropriate video encoding to ensure optimal playback.6
The resulting data paints an interesting picture of prevailing network speeds
throughout the world, as shown in the map below.
AVG. BITRATE FOR DESKTOP PLAYS, Q4 2011
Desktop bit rate (kbps): Mobile bit rate (kbps): Tablet bit rate (kbps): CTV&GC bit rate (kbps):
1. United States 1,748 1. Greece 1,617 1. Ukraine 1,789 1. Italy 2,000
2. Taiwan 1,610 2. Germany 1,361 2. Sweden 1,496 2. New Zealand 1,947
3. Rep. of Korea 1,574 3. Russia 1,289 3. Netherlands 1,408 3. Japan 1,885
4. Sweden 1,506 4. Austria 1,237 4. Israel 1,405 4. Ireland 1,855
5. Germany 1,486 5. Sweden 1,232 5. Russia 1,271 5. Taiwan 1,792
6. Netherlands 1,484 6. Belgium 1,224 6. Argentina 1,187 6. United Kingdom 1,660
7. Belgium 1,465 7. Norway 1,219 7. United Kingdom 1,187 7. Israel 1,616
8. Canada 1,395 8. Italy 1,162 8. Switzerland 1,143 8. Canada 1,587
9. Italy 1,380 9. Ukraine 1,134 9. United States 1,005 9. Brazil 1,555
10. Switzerland 1,365 10. France 1,083 10. Greece 993 10. United States 1,502
6
The bit-rate numbers included in this report reflect more variables than available bandwidth. Ooyala’s
technology gauges CPU status, screen size, and network capacity and availability before selecting the
appropriate video encoding to minimize buffering and ensure high-quality playback. Because more variables
are included, Ooyala’s measure of average bit rate is likely to diverge somewhat from industry estimates
for average bandwidth rates by country.
Q4 2011 VIDEO INDEX REPORT 14
15. SCREENS, DEVICES & PLATFORMS
EMERGING EMERGING MARKETS: GROWTH IN SHARE OF PLAYS, Q4 2011
MEDIA MARKETS 300% CTV & GC
Growth in online video plays Tablet
and time watched wasn’t limited Mobile
to developed markets like the 200%
U.S. and Europe. High-growth
economies like Brazil, China,
100%
Russia and India also grew
strongly throughout the quarter.
Connected TV devices and gaming 0%
consoles led in terms of total
video plays and time watched
OCT NOV DEC
during much of the quarter, though -100%
mobile devices and tablets also
notched explosive growth. Each
device’s share of total online
video plays more than doubled in
a single quarter, reflecting robust
annualized growth rates of around
1,000%. 7 EMERGING MARKETS: GROWTH IN SHARE OF TIME WATCHED, Q4 2011
200% CTV & GC
THE BOTTOM LINE:
Tablet
While slow connection speeds may
Mobile
pose constraints to growth in some
emerging markets, viewers’ appetite
for new devices and online video is 100%
creating record growth the world over.
0%
OCT NOV DEC
-100%
7
It’s important to note that the December vacation effect may be skewing these growth numbers.
Stay tuned for the Q1 Video Index to see if this growth is part of larger trend.
Q4 2011 VIDEO INDEX REPORT 15
16. APPENDIX
DATA TABLES
GLOBAL CONVERSION RATE (PLAYS/DISPLAYS)
Conversion Mobile Tablet CTV&GC
Week of Rate Conversion Conversion Conversion
Desktop Rate Rate Rate
Oct 3, 2011 39.89% 41.11% 16.89% 40.41%
Oct 10, 2011 40.08% 42.14% 17.30% 47.19%
Oct 17, 2011 41.53% 41.94% 17.66% 56.30%
Oct 24, 2011 42.05% 43.42% 17.88% 54.42%
Oct 31, 2011 36.58% 41.98% 18.33% 36.23%
Nov 7, 2011 36.80% 42.59% 18.43% 52.05%
Nov 14, 2011 40.72% 43.01% 18.37% 59.30%
Nov 21, 2011 36.19% 41.22% 17.64% 49.55%
Nov 28, 2011 39.33% 42.94% 18.13% 57.91%
Dec 5, 2011 40.97% 44.35% 19.72% 56.42%
Dec 12, 2011 41.07% 44.53% 19.28% 47.75%
Dec 19, 2011 42.86% 41.92% 18.82% 54.16%
Dec 26, 2011 43.89% 41.97% 19.48% 53.33%
VIEWER ENGAGEMENT, BY DEVICE
Desktop Mobile Tablet CTV&GC
Watched 1/4 55% 49% 62% 63%
Watched half 48% 42% 54% 57%
Watched 3/4 43% 37% 48% 53%
Completed 38% 28% 38% 47%
Video
Q4 2011 VIDEO INDEX REPORT 16
17. GROWTH IN SHARE OF NON-DESKTOP VIDEO PLAYS
Ratio of
Ratio of
Growth in Growth in Growth in Tablet/Mobile
Week of Tablet/Mobile
Tablet Share Mobile Share CTVGC Share (Time
(Video Plays)
Watched)
Oct 3, 2011 1.00 1.00 1.00 0.63 0.84
Oct 10, 2011 1.05 1.06 1.08 0.62 0.85
Oct 17, 2011 1.26 1.13 1.06 0.70 0.92
Oct 24, 2011 1.20 1.24 0.93 0.60 0.84
Oct 31, 2011 1.41 1.37 1.09 0.64 0.85
Nov 7, 2011 1.37 1.19 1.06 0.72 0.92
Nov 14, 2011 1.37 1.20 1.10 0.72 0.90
Nov 21, 2011 1.67 1.48 1.43 0.70 0.93
Nov 28, 2011 1.48 1.44 1.43 0.64 0.81
Dec 5, 2011 1.53 1.42 1.57 0.68 0.88
Dec 12, 2011 1.48 1.39 1.40 0.67 0.81
Dec 19, 2011 1.75 1.56 1.54 0.70 0.90
Dec 26, 2011 2.32 1.94 1.96 0.75 0.97
VIEWERS WHO WATCHED 3/4 OF A VIDEO
Device % watched
3/4 of 10 min
+ video
Desktop 20%
Mobile 18%
Tablet 29%
CTV&GC 34%
Q4 2011 VIDEO INDEX REPORT 17
18. TOTAL TIME WATCHED, BY VIDEO LENGTH & DEVICE
Desktop Mobile Tablet CTV&GC
<1 min 10% 6% 6% 4%
1-3 min 29% 30% 26% 15%
3-6 min 26% 23% 22% 15%
6-10 min 10% 12% 11% 9%
>10 min 25% 29% 36% 57%
ANDROID VS. IOS
Time Watched iPhone Android
iPhone Plays/
iPhone/ Growth in Growth in
Week of Android
Android Share of Total Share of Total
Mobile Plays
Mobile Plays Plays
Oct 3, 2011 0.72 0.79 1.00 1.00
Oct 10, 2011 0.81 0.83 1.12 0.99
Oct 17, 2011 0.97 0.94 1.34 0.99
Oct 24, 2011 1.33 1.22 1.71 0.92
Oct 31, 2011 1.36 1.26 1.94 1.02
Nov 7, 2011 1.00 0.99 1.51 1.08
Nov 14, 2011 1.06 1.01 1.58 1.07
Nov 21, 2011 1.20 1.03 2.01 1.21
Nov 28, 2011 1.21 1.11 1.98 1.17
Dec 5, 2011 1.03 1.00 1.84 1.28
Dec 12, 2011 0.98 1.07 1.72 1.26
Dec 19, 2011 1.33 1.25 2.21 1.19
Dec 26, 2011 1.14 1.05 2.56 1.61
Q4 2011 VIDEO INDEX REPORT 18
19. NETWORKS, BROADCASTERS & STUDIOS: GROWTH IN SHARE OF NON-DESKTOP PLAYS
Date Mobile Tablet CTV&GC
Oct 3, 2011 1.00 1.00 1.00
Oct 10, 2011 1.06 1.17 1.15
Oct 17, 2011 1.08 1.21 1.02
Oct 24, 2011 1.08 1.27 0.97
Oct 31, 2011 1.35 1.52 1.16
Nov 7, 2011 1.14 1.53 1.09
Nov 14, 2011 1.13 1.49 1.12
Nov 21, 2011 1.40 1.80 1.37
Nov 28, 2011 1.33 1.54 1.50
Dec 5, 2011 1.36 1.59 1.60
Dec 12, 2011 1.34 1.51 1.46
Dec 19, 2011 1.37 1.67 1.58
Dec 26, 2011 1.57 2.15 1.84
GOOGLE TV
Ratio of plays
Week of compared to
10/3
Oct 3, 2011 1.00
Oct 10, 2011 1.08
Oct 17, 2011 1.09
Oct 24, 2011 0.94
Oct 31, 2011 1.10
Nov 7, 2011 1.09
Nov 14, 2011 1.10
Nov 21, 2011 1.44
Nov 28, 2011 1.50
Dec 5, 2011 1.65
Dec 12, 2011 1.45
Dec 19, 2011 1.57
Dec 26, 2011 1.91
Q4 2011 VIDEO INDEX REPORT 19
20. EMERGING MARKETS: GROWTH IN TOTAL SHARE, BY DEVICE
CTV&GC
CTV&GC Mobile Time Tablet Time
Week of Mobile Plays Tablet Plays TIme
Plays Watched Watched
Watched
Oct 3, 2011 1.00 1.00 1.00 1.00 1.00 1.00
Oct 10, 2011 1.02 0.89 0.80 0.94 0.96 0.83
Oct 17, 2011 1.02 1.09 1.44 0.92 1.23 1.32
Oct 24, 2011 0.90 0.96 0.91 0.91 1.22 1.10
Oct 31, 2011 0.97 1.00 1.01 0.93 1.22 1.10
Nov 7, 2011 0.98 0.58 1.92 0.84 0.70 2.17
Nov 14, 2011 0.93 0.70 1.56 0.83 0.85 1.37
Nov 21, 2011 1.01 0.99 1.59 0.85 1.00 1.56
Nov 28, 2011 1.34 1.37 1.84 1.06 1.47 2.06
Dec 5, 2011 1.17 1.18 2.18 0.94 1.22 2.18
Dec 12, 2011 1.96 1.74 1.80 1.77 1.91 1.76
Dec 19, 2011 2.23 1.93 3.17 1.71 1.70 2.88
Dec 26, 2011 2.43 2.45 2.42 1.82 2.21 2.16
Q4 2011 VIDEO INDEX REPORT 20
21. METHODOLOGY
DATA SOURCES & SAMPLE SIZE
The data sample used in this report covers the fourth quarter of 2011, from October 1 through
December 31. All data was taken from an anonymous cross-section of Ooyala’s global customer
and partner database—an array of broadcasters, studios, cable operators, print publications,
online media companies and consumer brands. These firms broadcast video to over 100
different countries from more than 5,000 unique domains. More than 100 million unique viewers
watch an Ooyala-powered video every month.
This data sample is not intended to represent the entire Internet or all online video viewers.
DATA COLLECTION
Ooyala’s video analytics technology collects all anonymized video data in real time. During
playback, Ooyala’s video player continuously gathers information and relays it to an analytics
module, which then stores the data in a distributed file system, Hadoop. Viewer statistics are
then complied and stored in a Cassandra data cluster, where the information is made readily
available for analysis.
ANALYSIS & METRICS
• Ooyala’s video analytics module tracks a range of standard variables, such as:
• Displays, plays and time watched
• Viewer engagement and video completion rates
• Sharing by social network
• Geography (region, state, city, Designated Marketing Areas)
• Device type (mobile, desktop, tablet, connected TV devices & game consoles)
• Operating system (Windows, Android, iOS)
• Browser (Safari, Chrome, Firefox, Internet Explorer)
For more details on specific metrics and measures, please see the Metrics & Definitions section
in the appendix.
Q4 2011 VIDEO INDEX REPORT 21
22. GLOSSARY
Conversion Rate: The ratio of plays to displays. 10 displays with 1 play is a conversion rate of
10%.
Completion Rate: The rate at which viewers watch a specified portion of a given video.
Sometimes used interchangeably with “play-through rate.”
Display: Each (and any) time a video is loaded in a browser and displayed to the viewer
Mobile Devices: All smart phones, including iOS, Android, Blackberry and others.
Video Play: Each time a video starts playing.
Connected TV Devices & Gaming Consoles: Set-top-boxes and OTT devices, including Wii,
Playstation, Boxee, Roku, Xbox and Google TV.
Tablets: All media tablets, including iOS and Android.
METRICS & DEFINITIONS
v ) an online video
p ) a publisher that owns many videos
v ! p ) a video owned by a publisher p
S ) is a set of publishers (e.g., the TV vertical)
p ! S ) p is a member of set S
"(v) ) a metric " (e.g., number of plays in Q3) evaluated over video v
P
"S = "p ) "S is the sum of "p for all publishers p in set S
p!S
r(v) = "1(v)="2(v) ) r(v) is the ratio of two metrics "1(v); "2(v)
rp; rS ) the same ratios over a single publisher p or set of publishers S
P P
rp = ( "1(v))=( "2(v))
v!p v!p
PP PP
rS = ( "1(v))=( "2(v))
p!S v!p p!S v!p
P P
#p = ( #(v) ! w(v))=( w(v)) ) a weighted sum.
v!p v!p
For instance, the average length of a video played weighted by the number of plays for each
video, #(v) would be the length of video, and the weight w(v) is the number of plays. Since #p is
a ratio, it would also be possible to determine #S for a set of publishers using the rule above.
Examples
Engagement is a ratio r(v) = "1(v)="2(v) where "1 is the number of times the video was
watched some percentage of the way through (25, 50, 75, 100) and "2 is the number of times it
was played.
Some metrics are more complex. For instance, " may be the number of times a video that was
of length greater than 10 minutes was watched on a tablet device. Only videos that are longer 10
minutes contribute to this total.
Q4 2011 VIDEO INDEX REPORT 22
23. DISCLAIMERS & ASSUMPTIONS
Data is not aggregated across all videos or providers for vertical data, and only publishers with
a meaningful amount of videos watched are included. Publishers with incomplete data for Q4
have been excluded.
When selecting items for inclusion in the report, Ooyala’s data science team selected metrics
that were clear and meaningful. Granular measures were broken down along many categories,
which resulted in a large amount of data. Rather than reporting all of this data, the Ooyala team
chose to highlight those measures that give a good impression for the data set as a whole.
Q4 2011 VIDEO INDEX REPORT 23