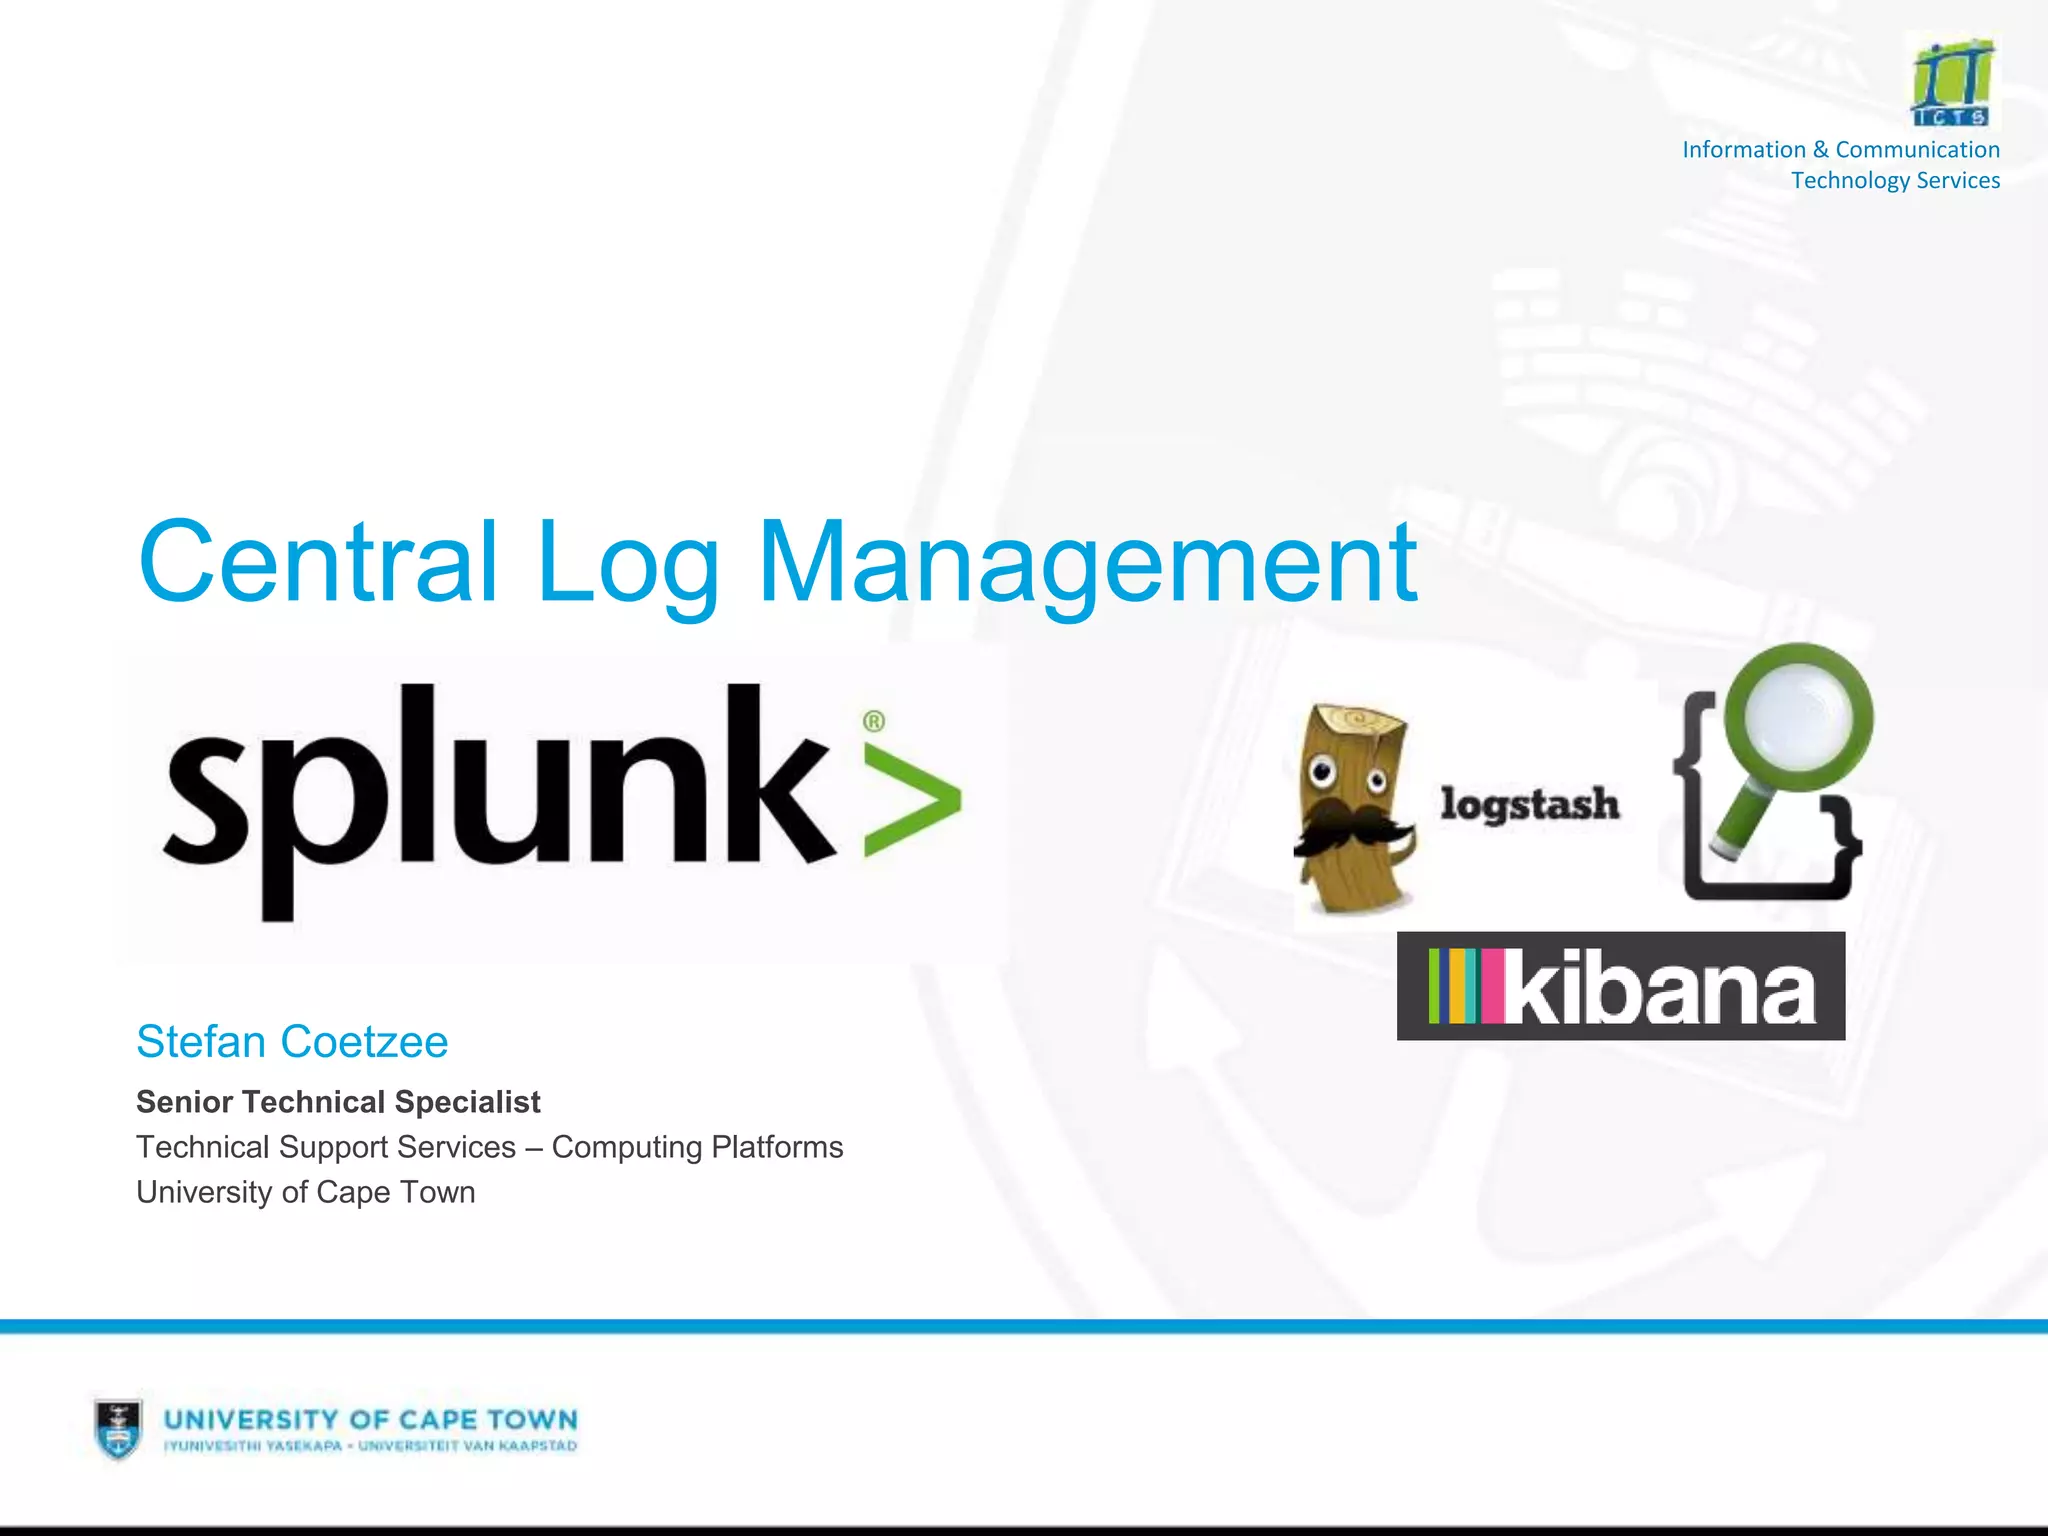
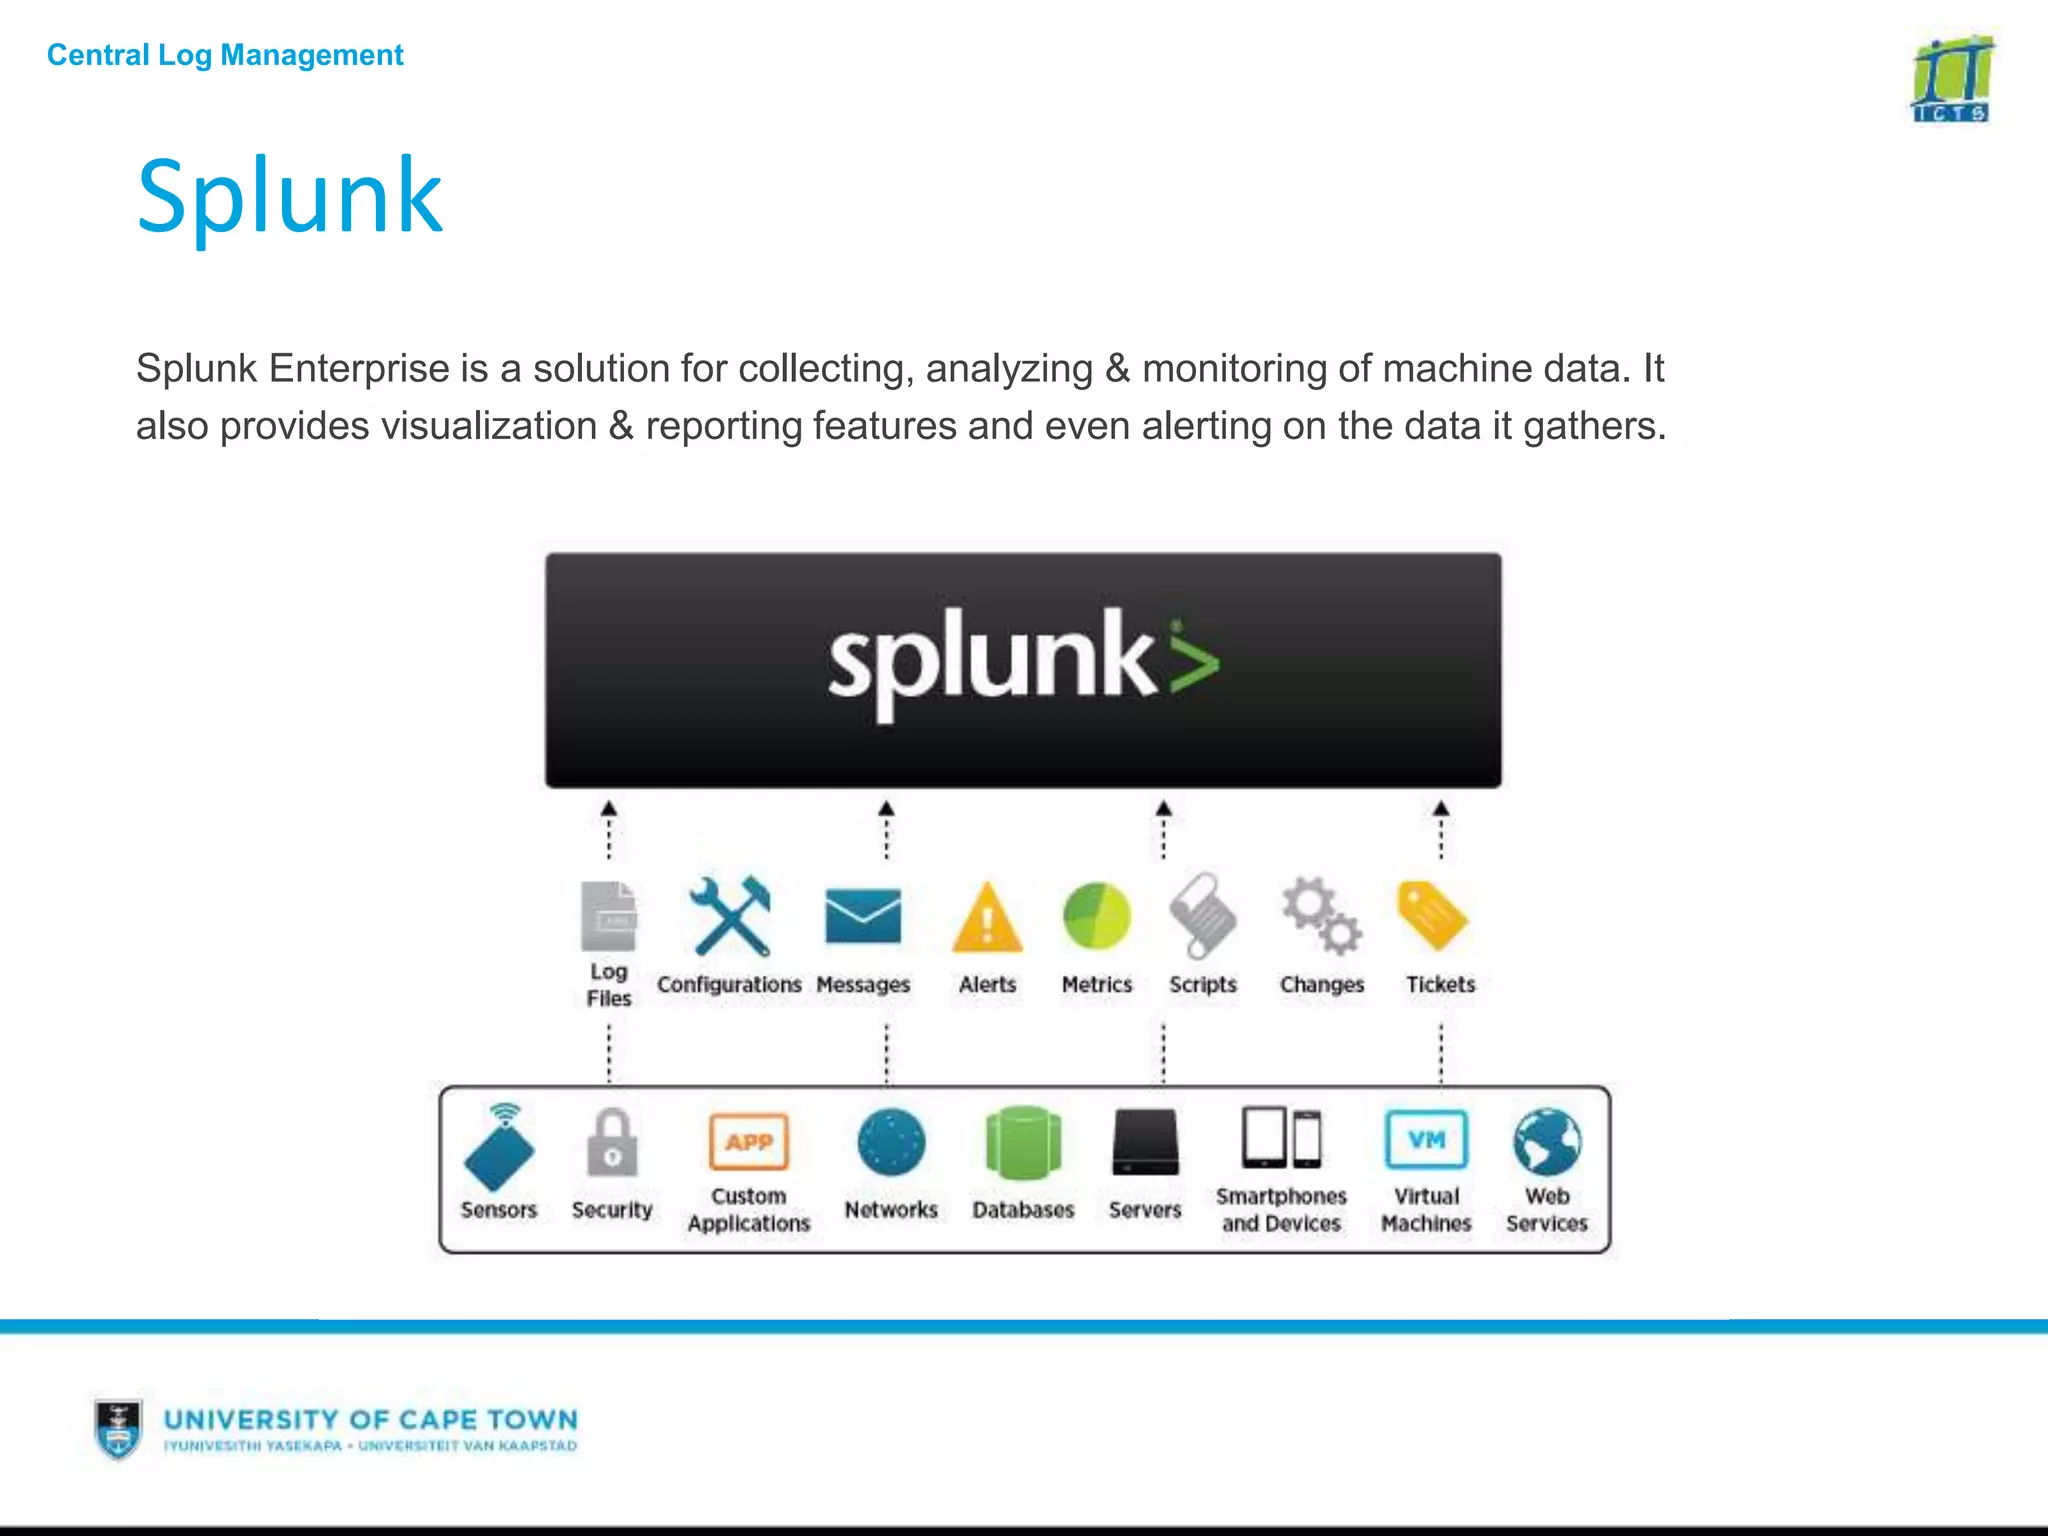
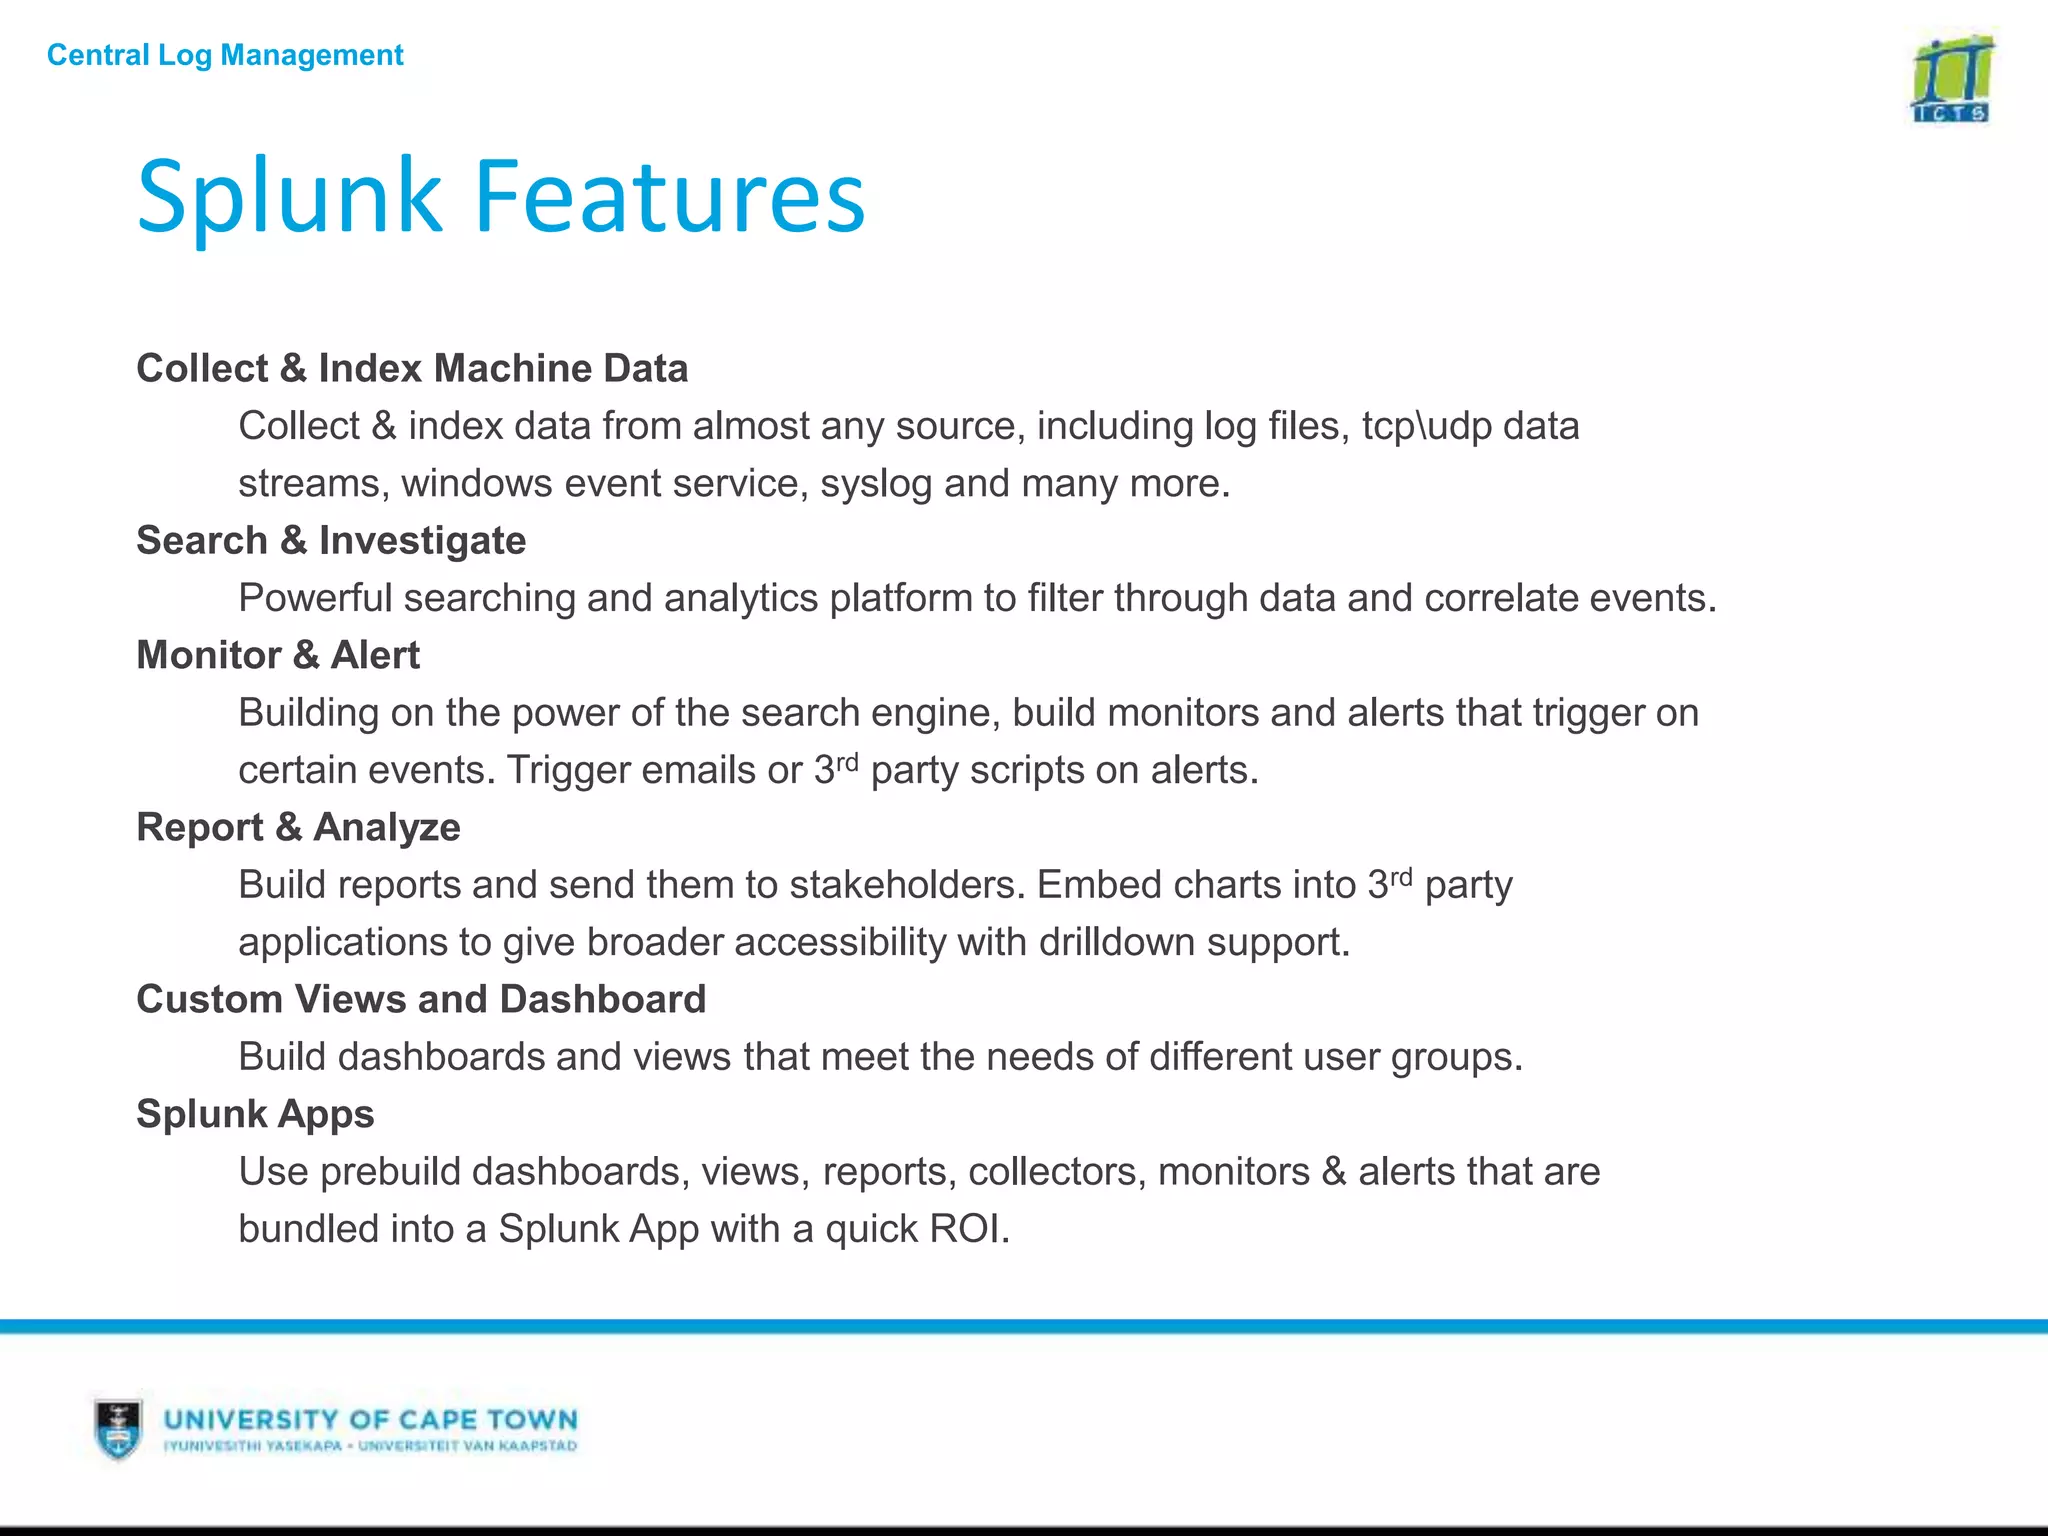
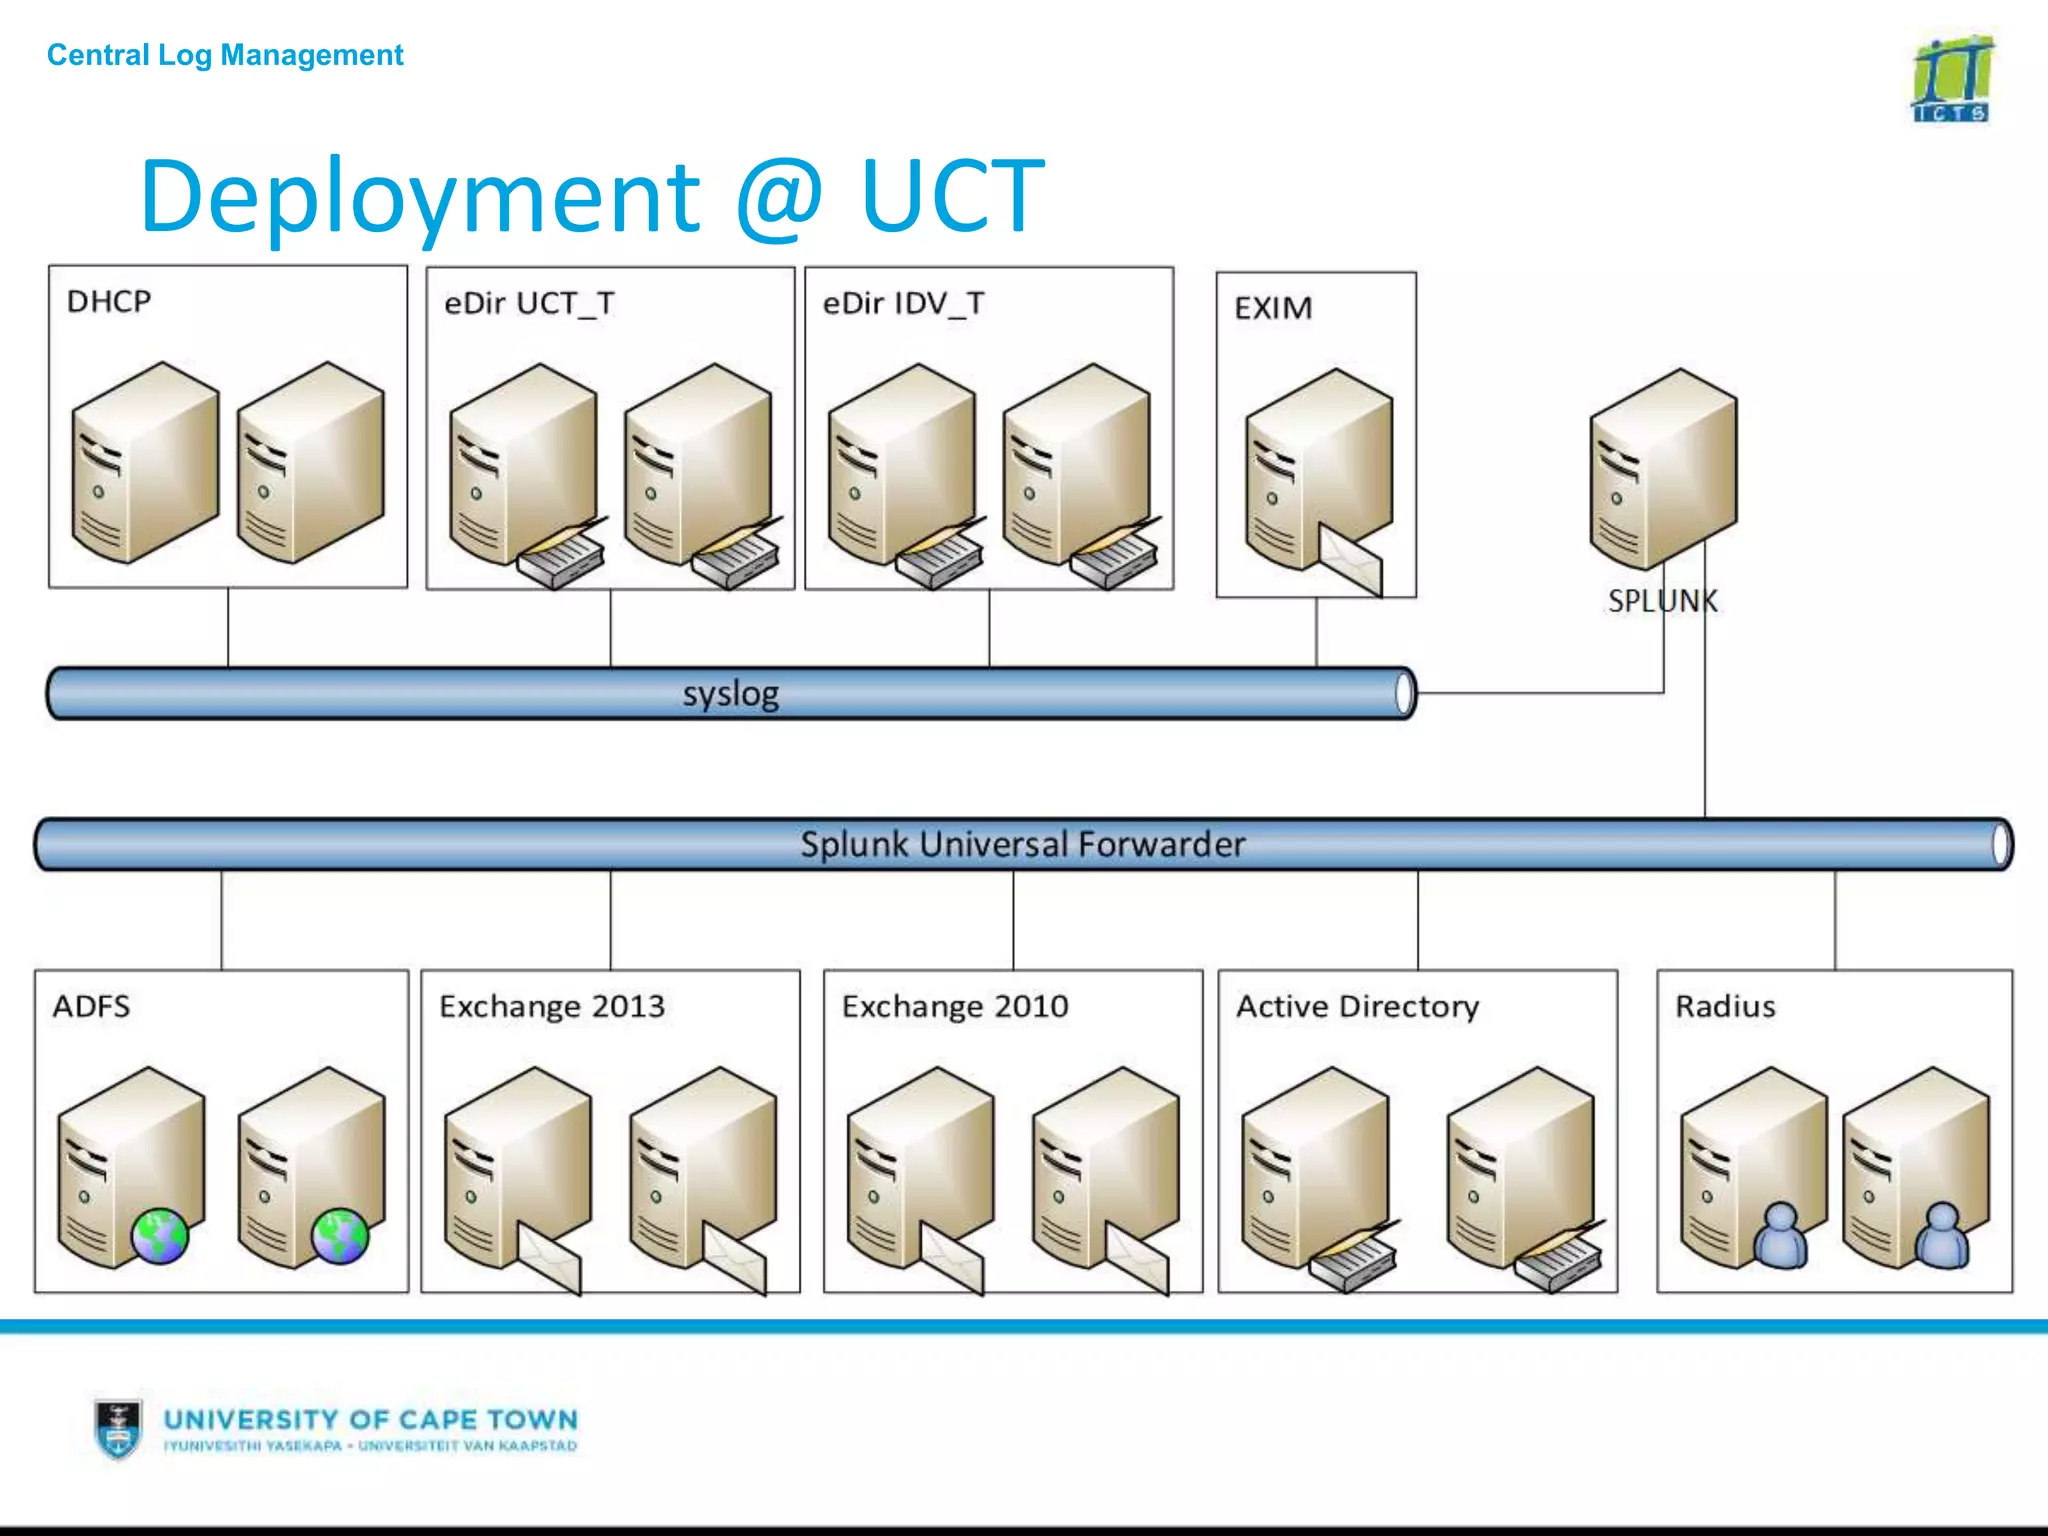
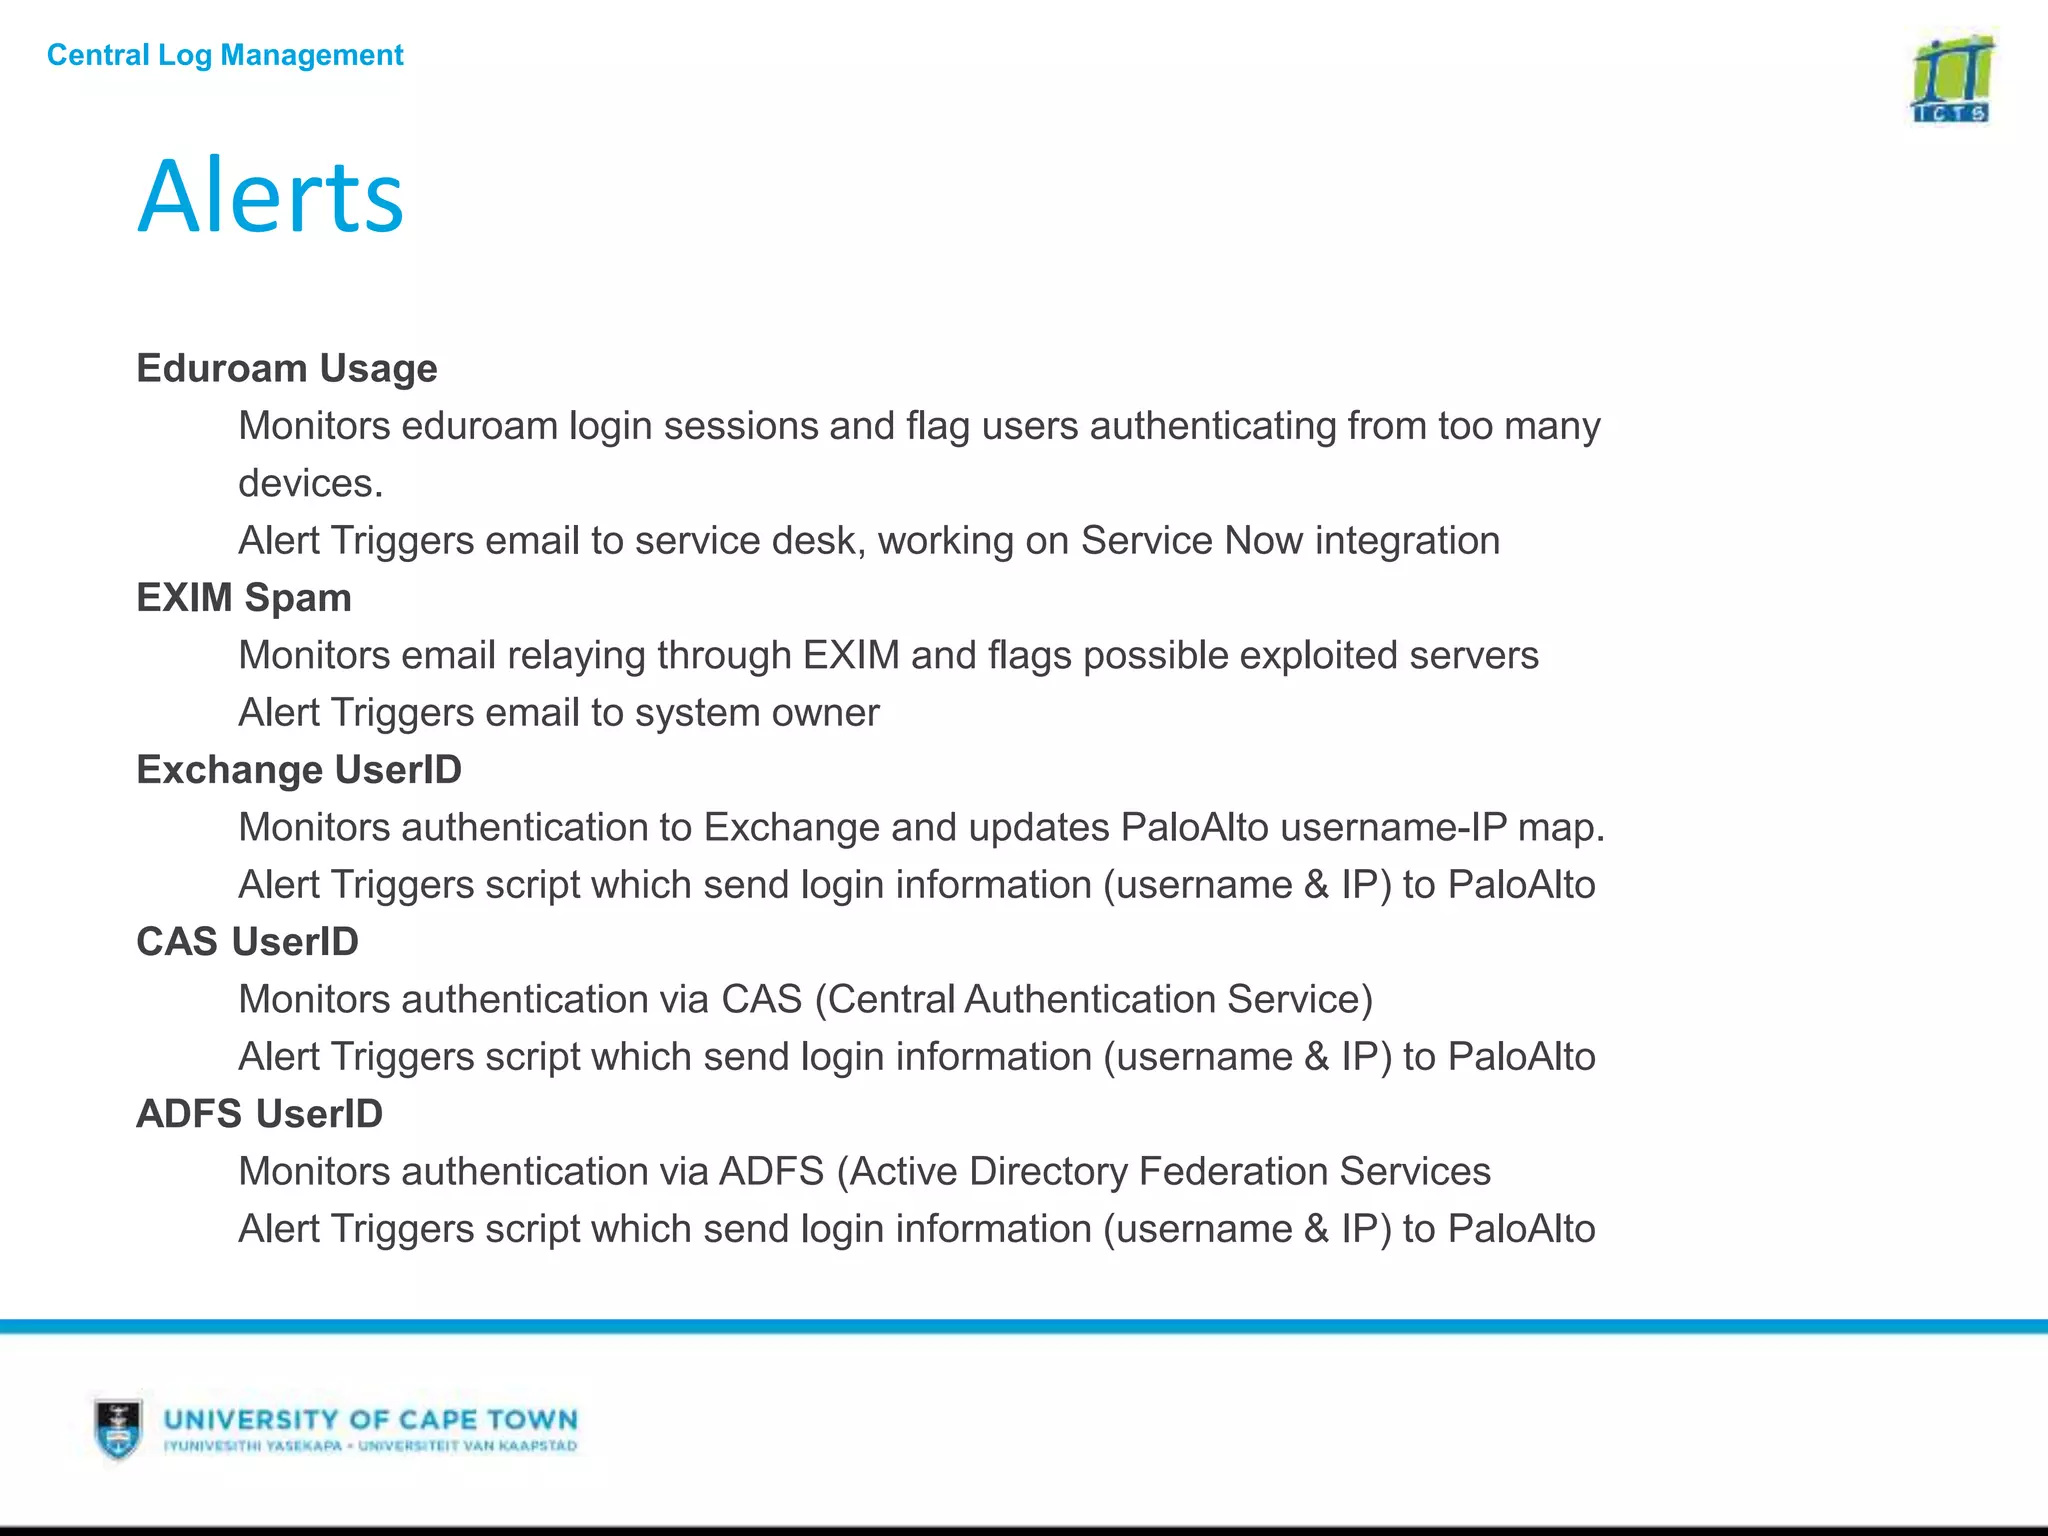
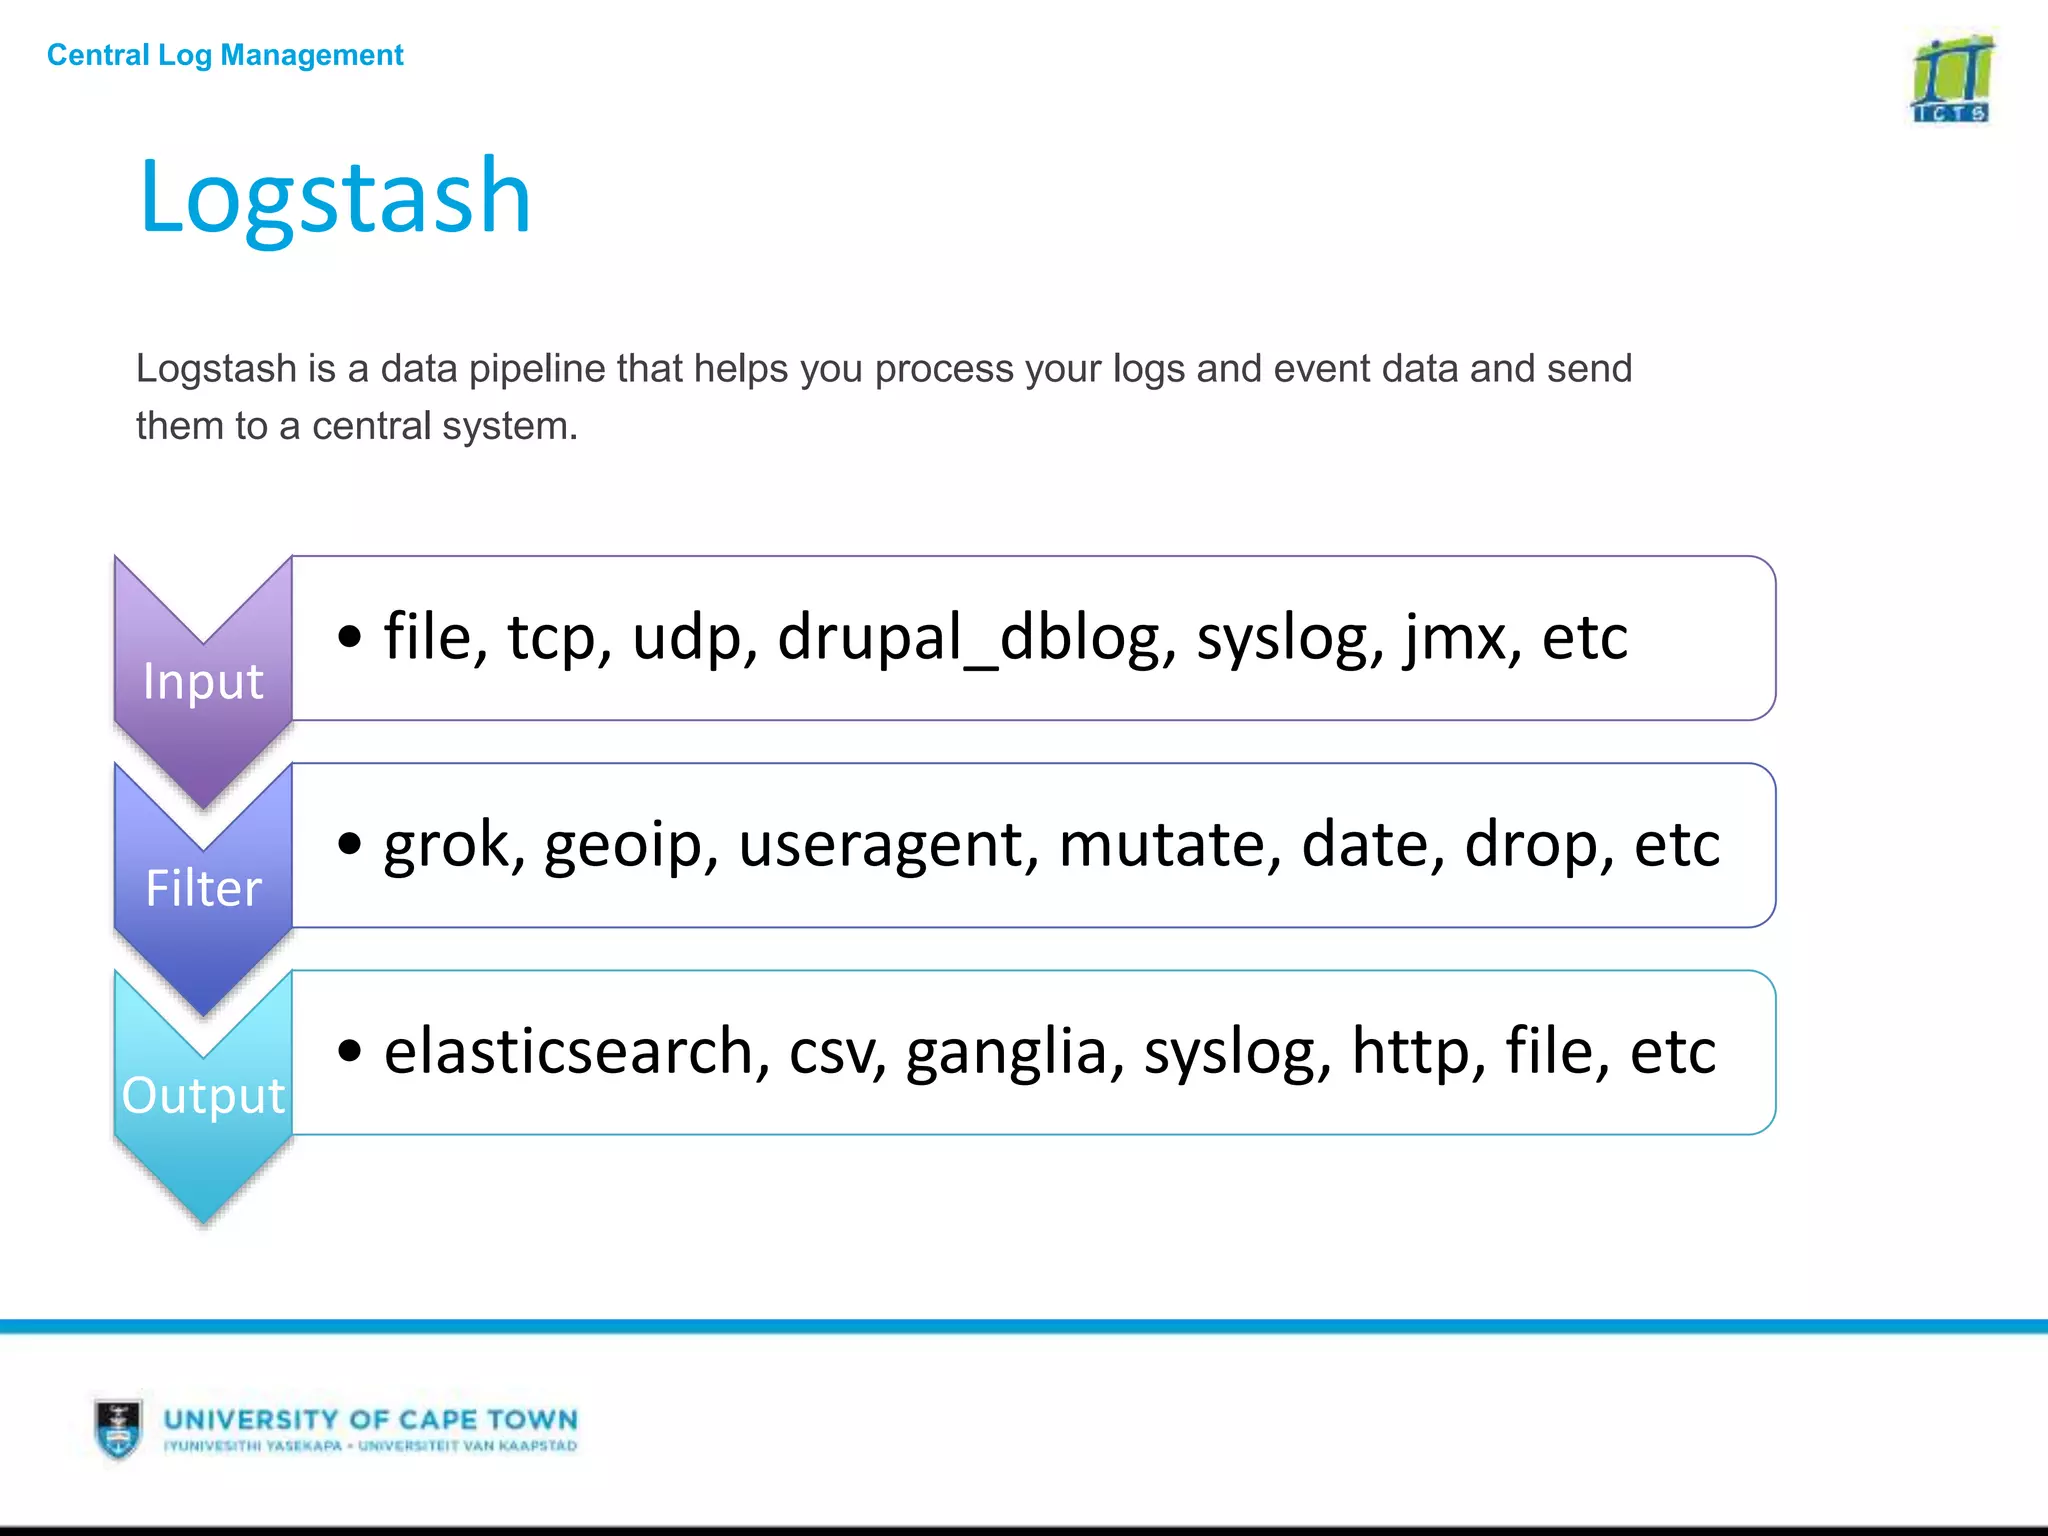
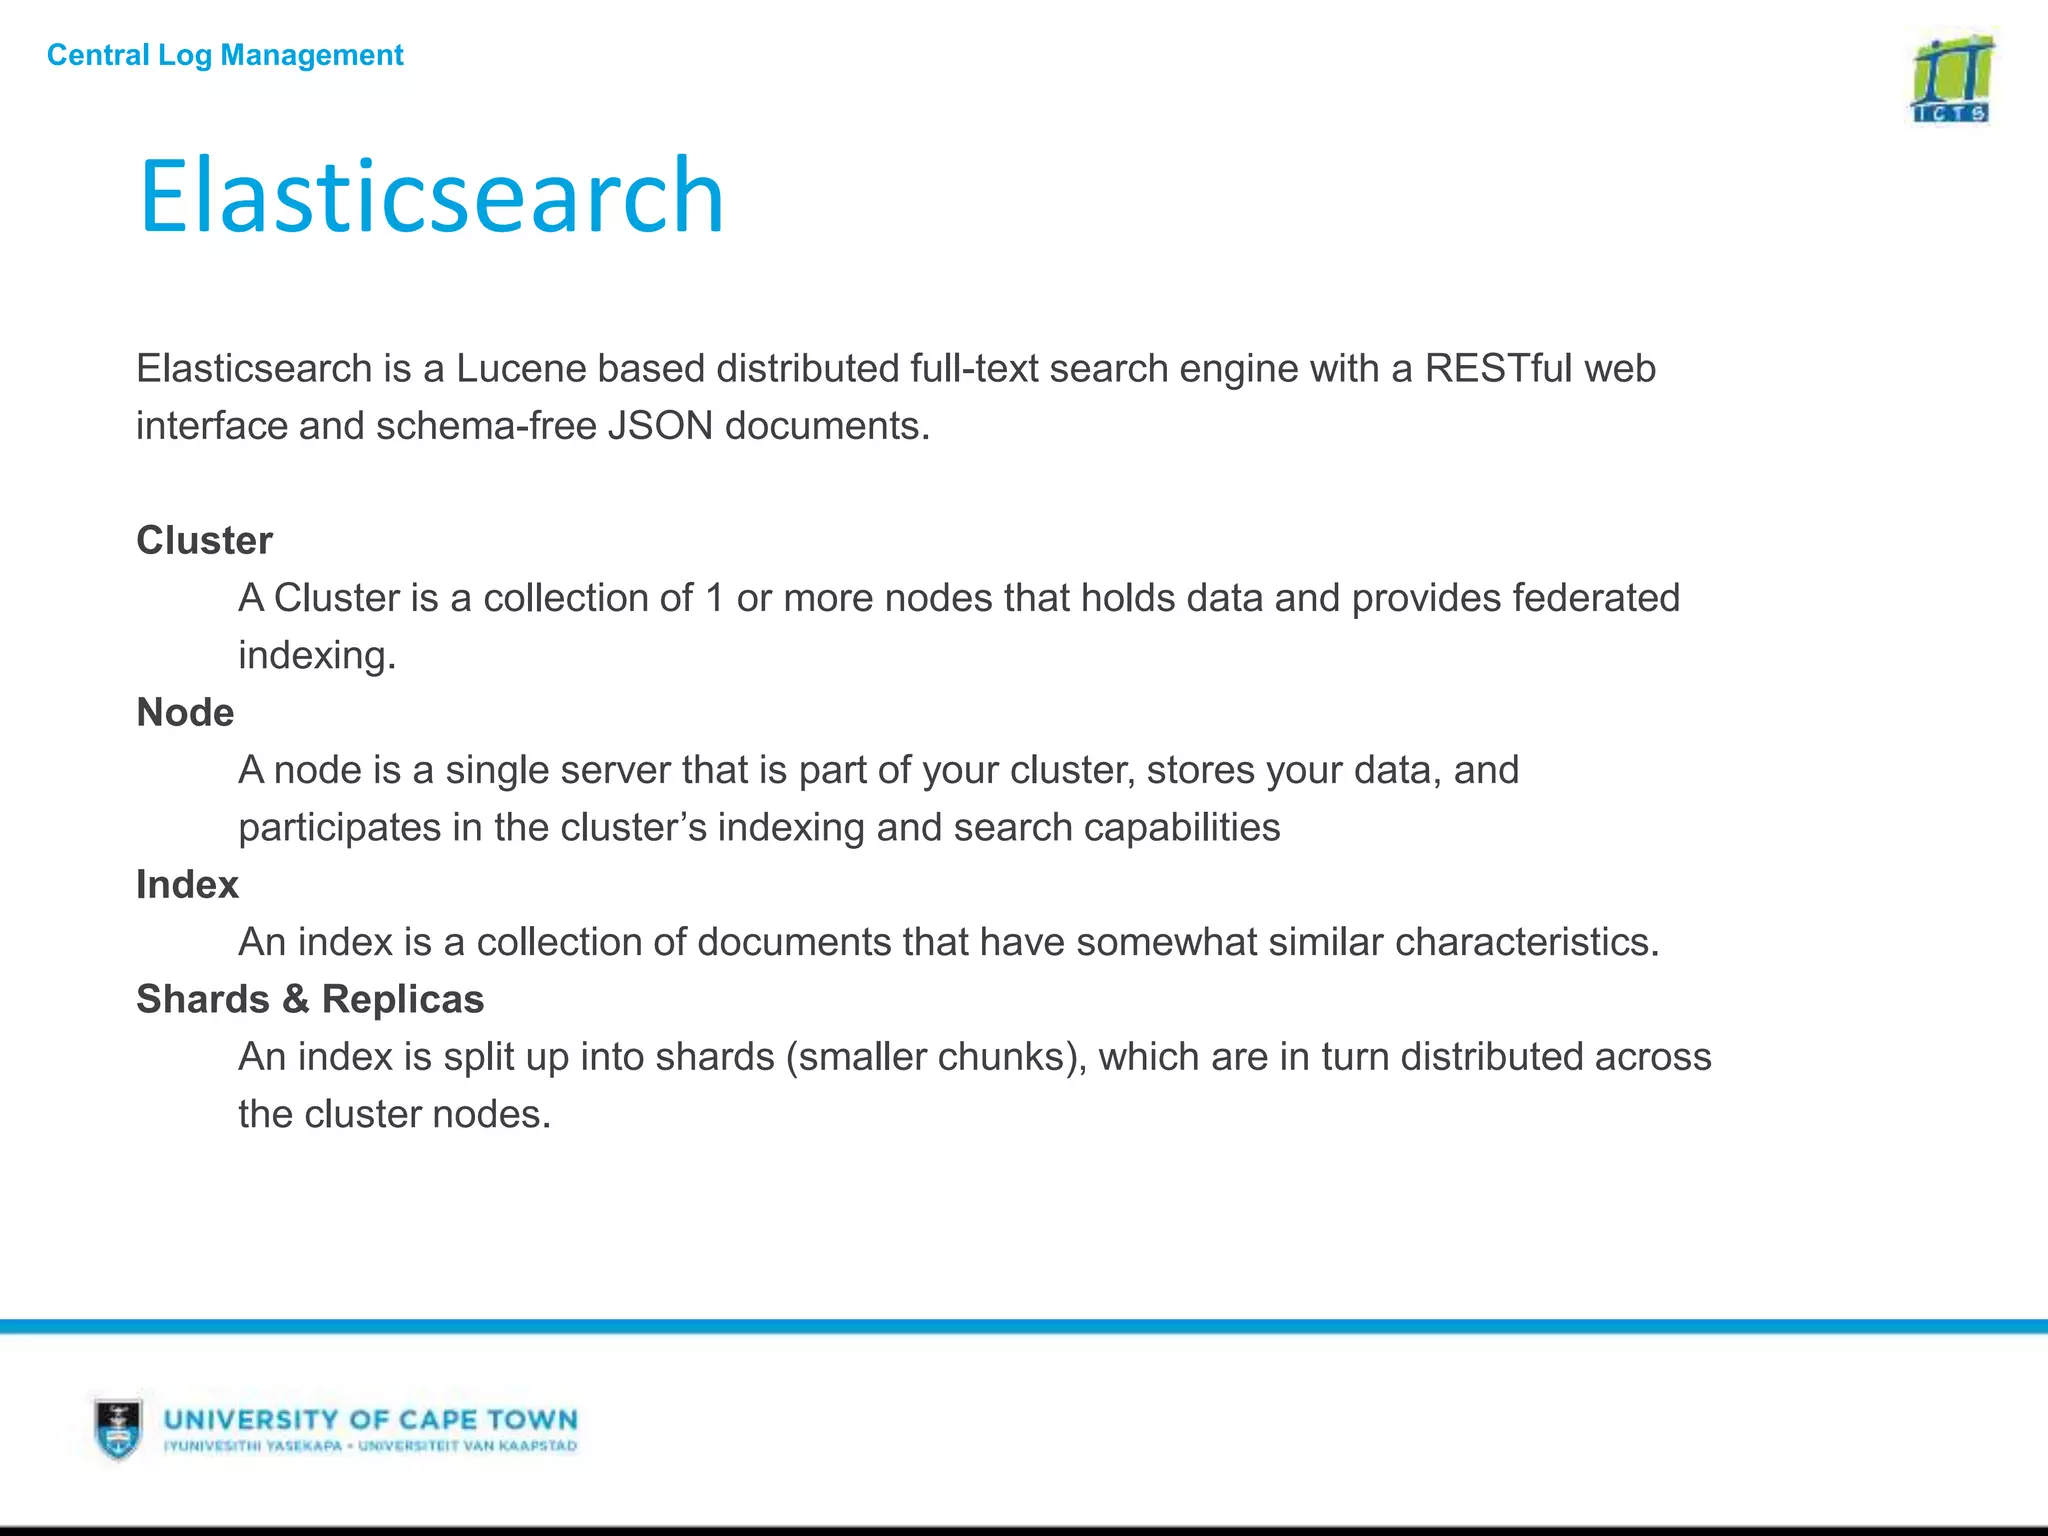
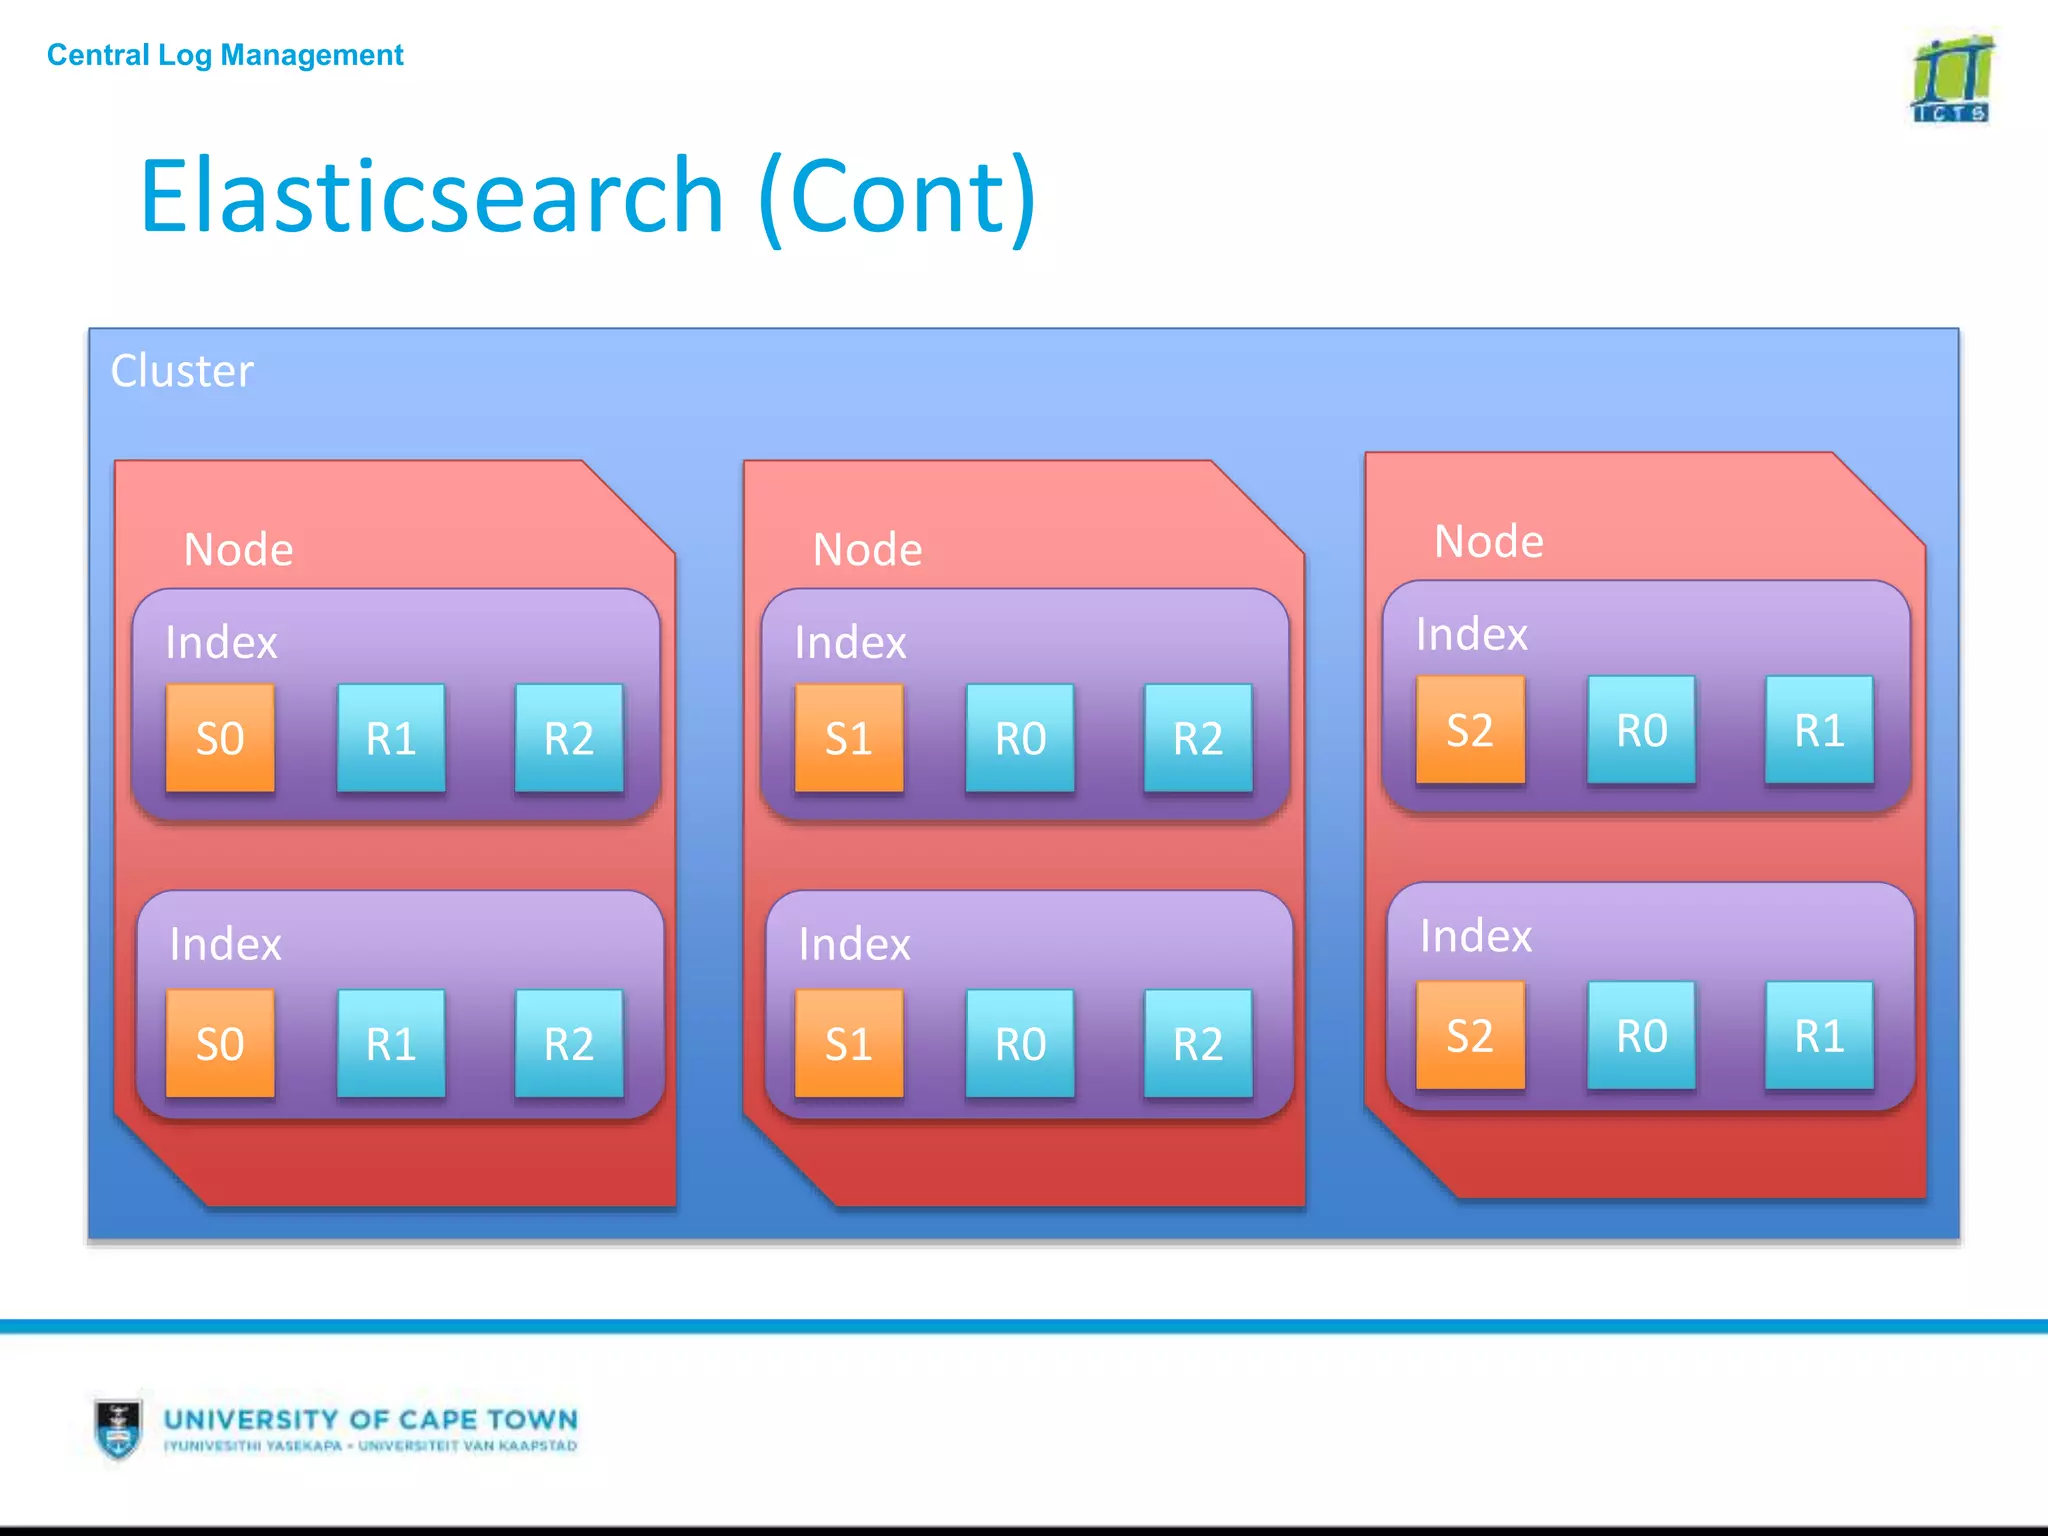
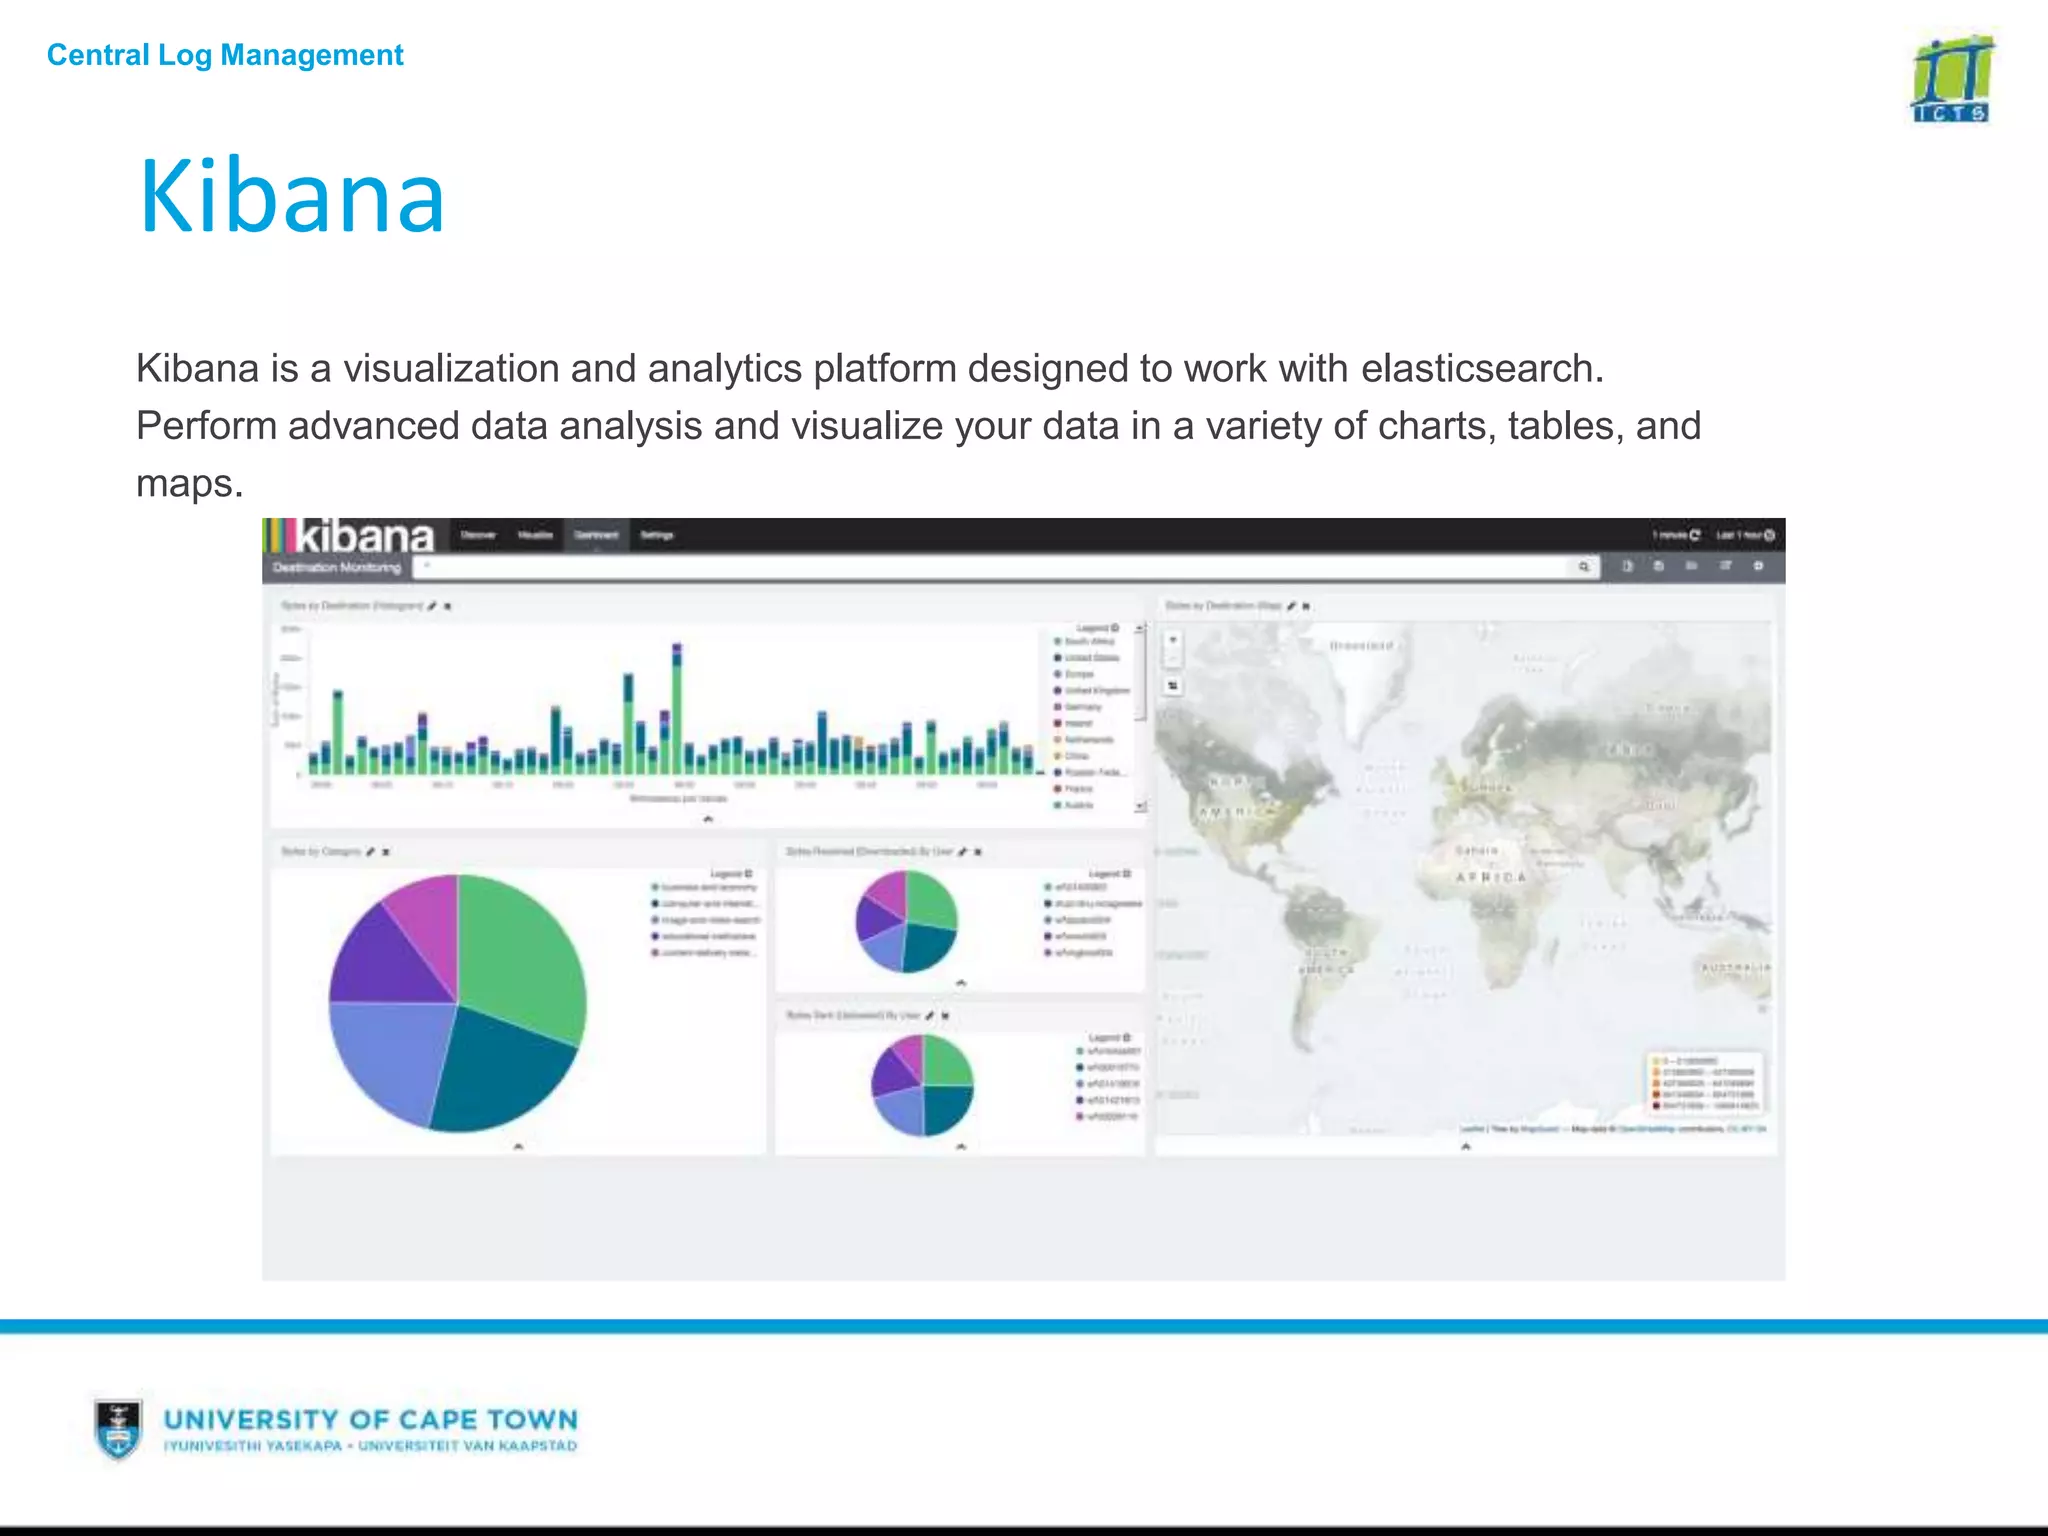
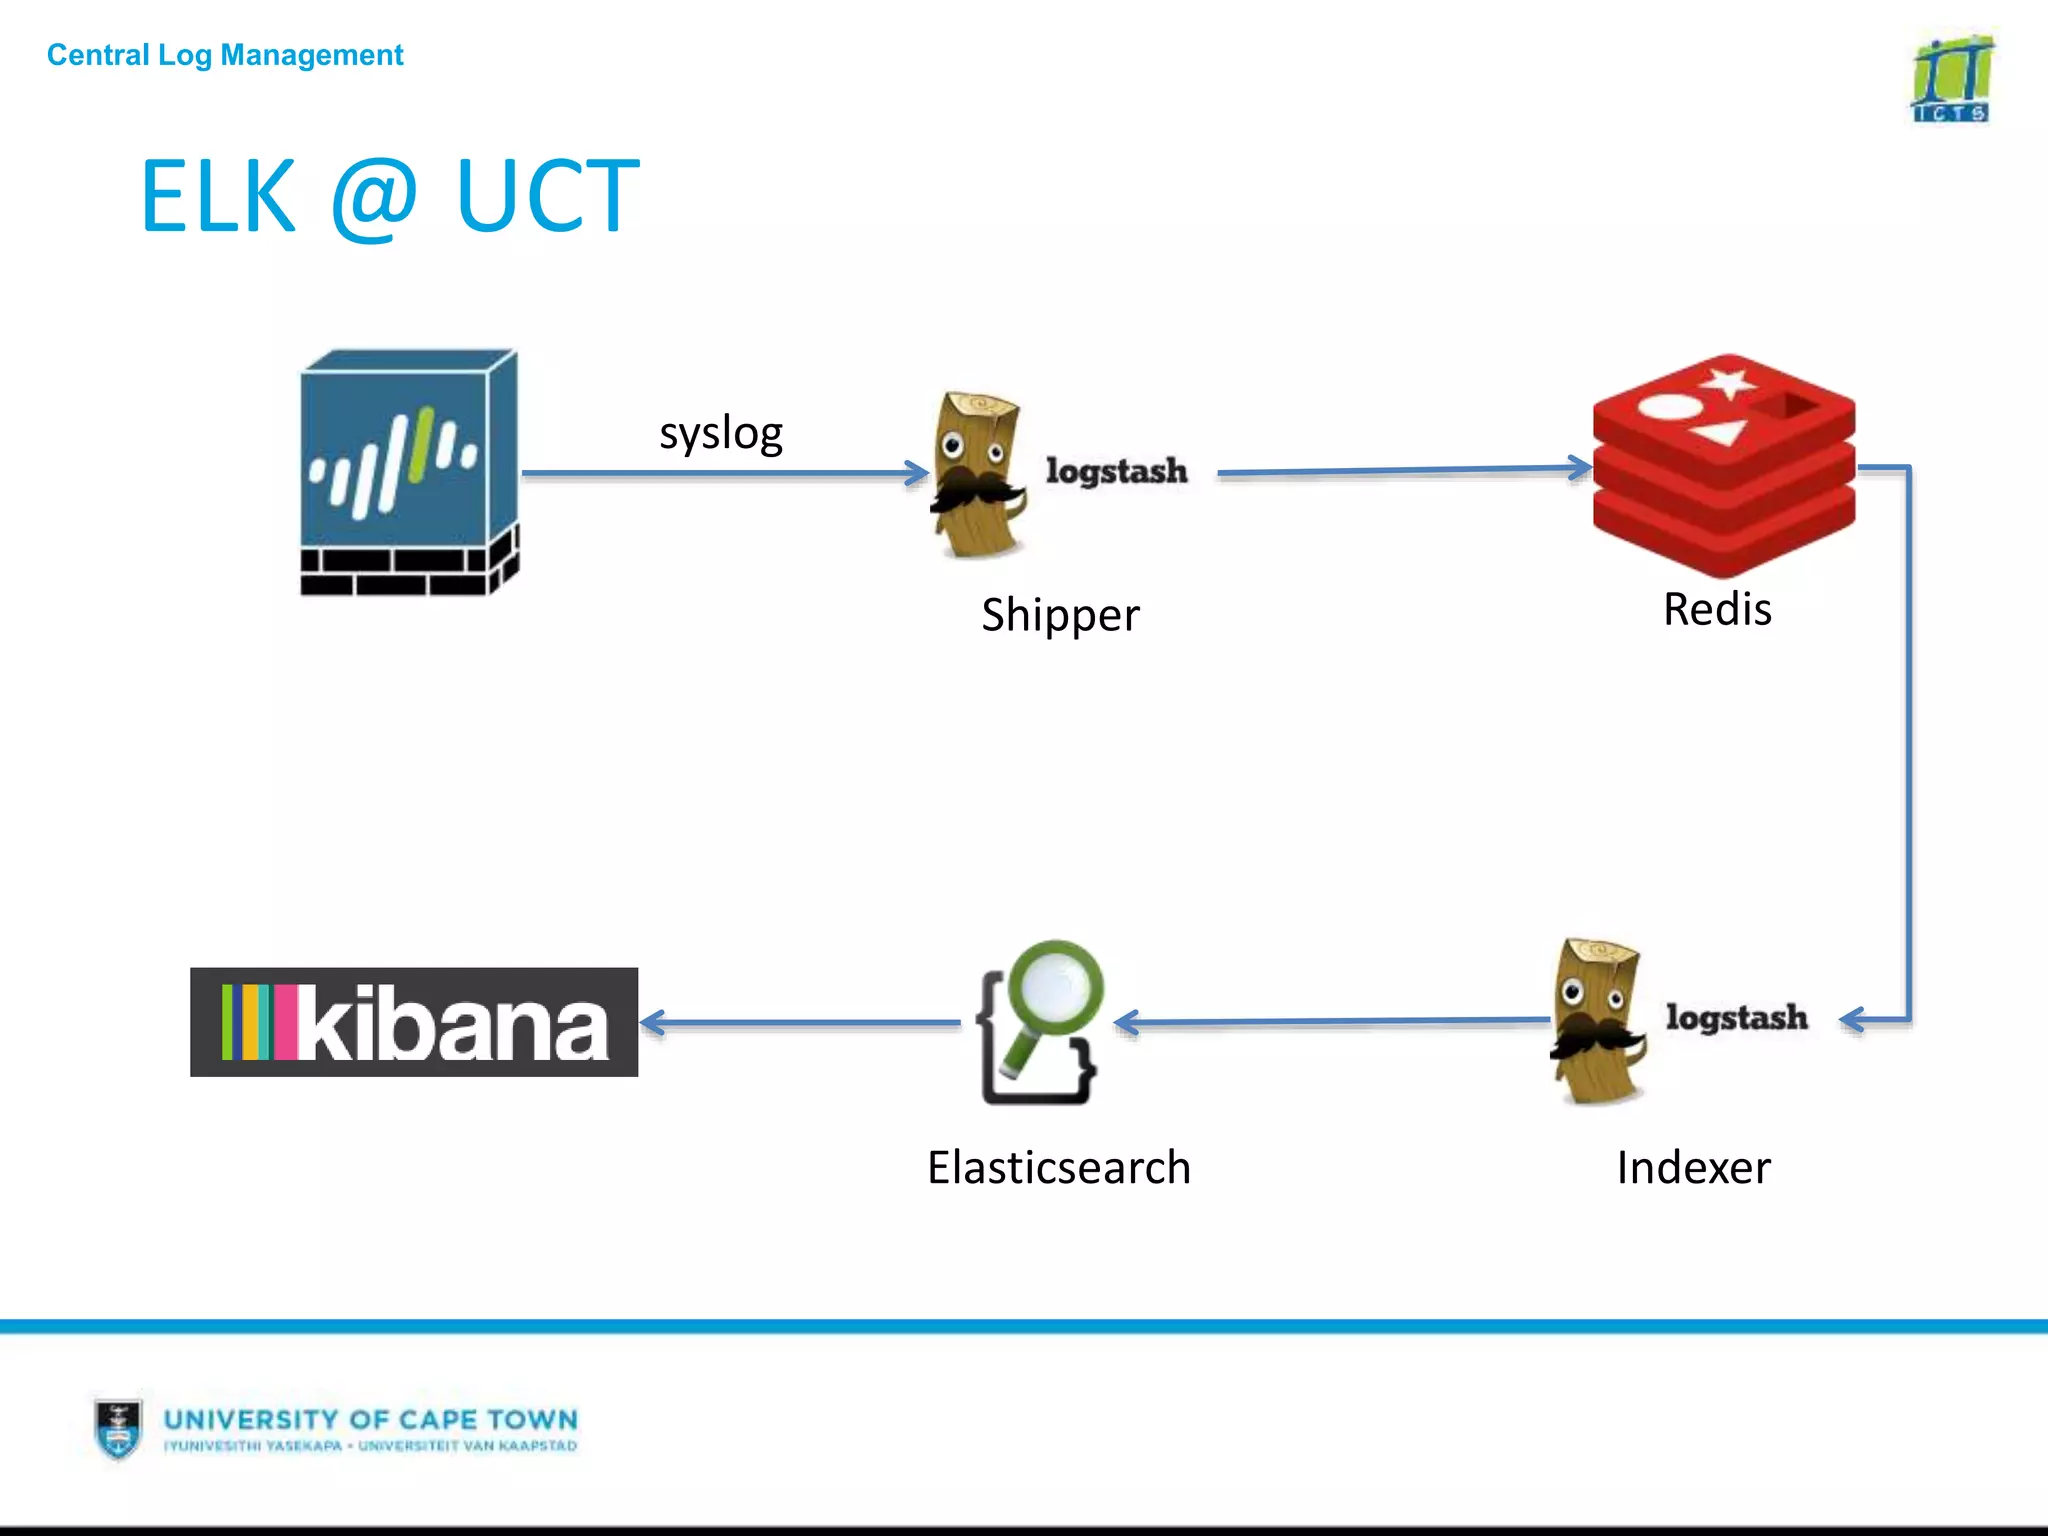
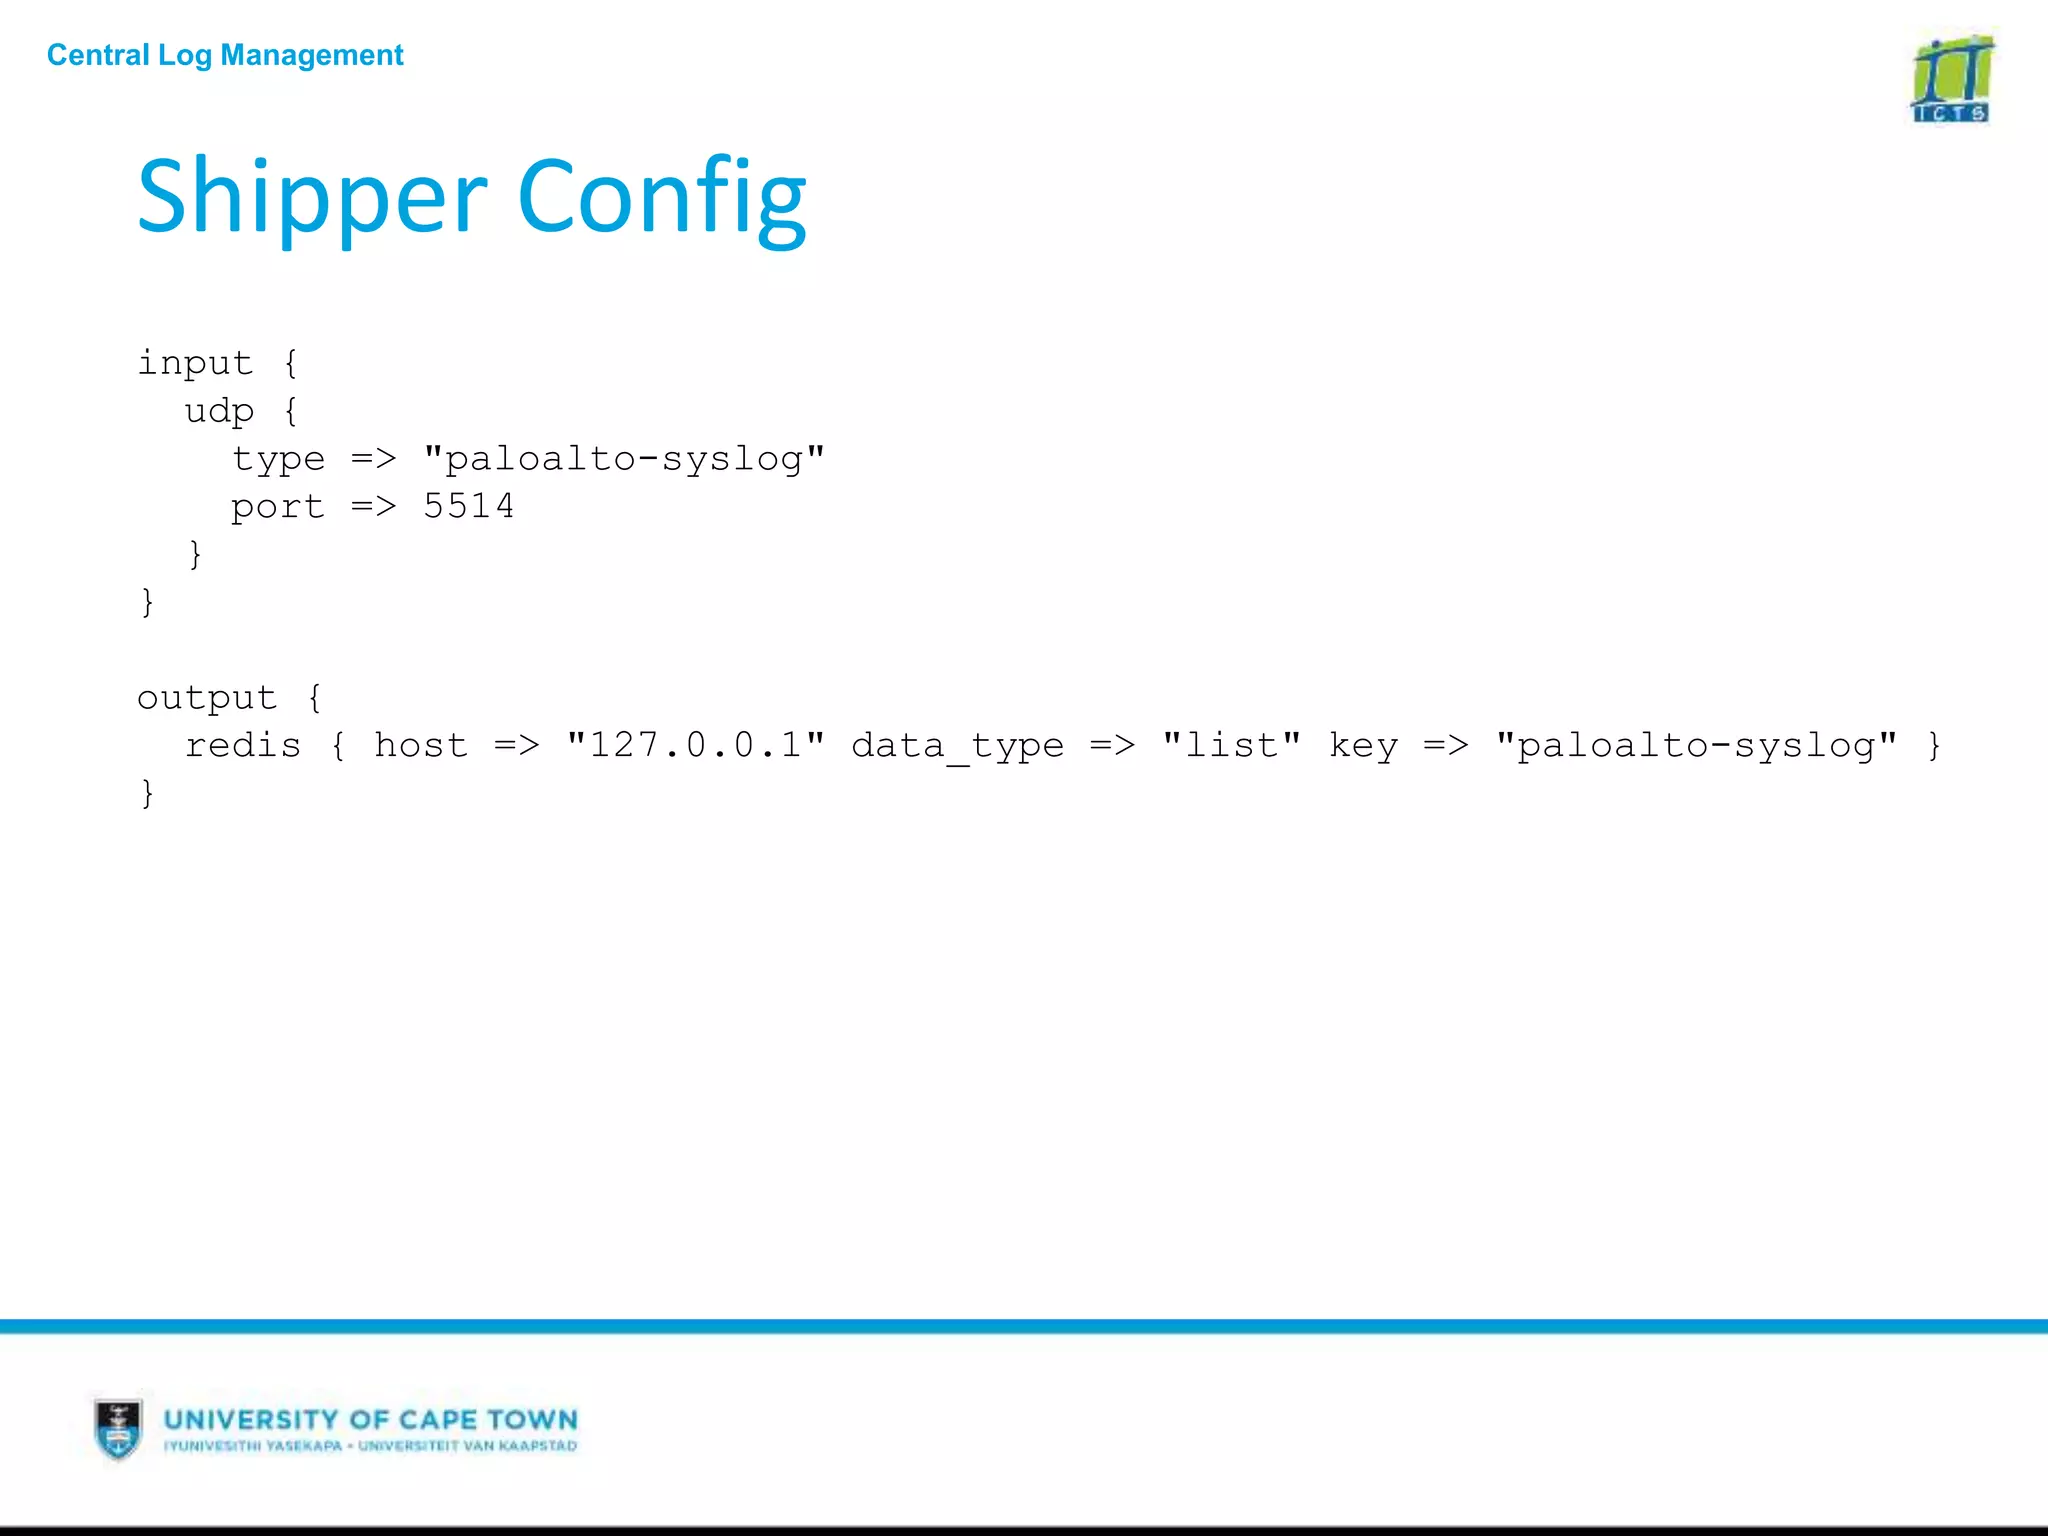
Central Log Management
Senior Technical Specialist
Technical Support Services – Computing Platforms
University of Cape Town
Stefan Coetzee
Information & Communication
Technology Services
Splunk
Central Log Management
Splunk
Splunk Enterprise is a solution for collecting, analyzing & monitoring of machine data. It
also provides visualization & reporting features and even alerting on the data it gathers.
Central Log Management
Splunk Features
Collect & Index Machine Data
Collect & index data from almost any source, including log files, tcpudp data
streams, windows event service, syslog and many more.
Search & Investigate
Powerful searching and analytics platform to filter through data and correlate events.
Monitor & Alert
Building on the power of the search engine, build monitors and alerts that trigger on
certain events. Trigger emails or 3rd party scripts on alerts.
Report & Analyze
Build reports and send them to stakeholders. Embed charts into 3rd party
applications to give broader accessibility with drilldown support.
Custom Views and Dashboard
Build dashboards and views that meet the needs of different user groups.
Splunk Apps
Use prebuild dashboards, views, reports, collectors, monitors & alerts that are
bundled into a Splunk App with a quick ROI.
Central Log Management
Splunk Features (Cont)
Role Based Security
Only give access to data as required, audit access to data and integrate with existing
LDAP infrastructure for authentication.
Central Log Management
Splunk Pros & Cons
Pros
• Feature rich
• Large community
• Fast (Very Fast)
Cons
• Expensive (Very expensive as Enterprise Apps are no longer part of base subscription)
• Licensing per GB not server based
Central Log Management
Deployment @ UCT
Central Log Management
Dashboards - CAS
Central Log Management
Dashboards – DC Power
Central Log Management
Dashboards - EXIM
Central Log Management
Alerts
Eduroam Usage
Monitors eduroam login sessions and flag users authenticating from too many
devices.
Alert Triggers email to service desk, working on Service Now integration
EXIM Spam
Monitors email relaying through EXIM and flags possible exploited servers
Alert Triggers email to system owner
Exchange UserID
Monitors authentication to Exchange and updates PaloAlto username-IP map.
Alert Triggers script which send login information (username & IP) to PaloAlto
CAS UserID
Monitors authentication via CAS (Central Authentication Service)
Alert Triggers script which send login information (username & IP) to PaloAlto
ADFS UserID
Monitors authentication via ADFS (Active Directory Federation Services
Alert Triggers script which send login information (username & IP) to PaloAlto
ELK Stack
Elasticsearch, Logstash, Kibana
Central Log Management
Logstash
Logstash is a data pipeline that helps you process your logs and event data and send
them to a central system.
Input
• file, tcp, udp, drupal_dblog, syslog, jmx, etc
Filter
• grok, geoip, useragent, mutate, date, drop, etc
Output
• elasticsearch, csv, ganglia, syslog, http, file, etc
Central Log Management
Elasticsearch
Elasticsearch is a Lucene based distributed full-text search engine with a RESTful web
interface and schema-free JSON documents.
Cluster
A Cluster is a collection of 1 or more nodes that holds data and provides federated
indexing.
Node
A node is a single server that is part of your cluster, stores your data, and
participates in the cluster’s indexing and search capabilities
Index
An index is a collection of documents that have somewhat similar characteristics.
Shards & Replicas
An index is split up into shards (smaller chunks), which are in turn distributed across
the cluster nodes.
Central Log Management
Elasticsearch (Cont)
Elasticsearch is a Lucene based distributed full-text search engine with a RESTful web
interface and schema-free JSON documents.
Cluster
A Cluster is a collection of 1 or more nodes that holds data and provides federated
indexing.
Node
A node is a single server that is part of your cluster, stores your data, and
participates in the cluster’s indexing and search capabilities
Index
An index is a collection of documents that have somewhat similar characteristics.
Shards & Replicas
An index is split up into shards (smaller chunks), which are in turn distributed across
the cluster nodes.
Cluster
Node
Index
Index
S0
S0
R2R1
R1 R2
Node
Index
Index
S1
S1
R2R0
R0 R2
Node
Index
Index
S2
S2
R1R0
R0 R1
Central Log Management
Kibana
Kibana is a visualization and analytics platform designed to work with elasticsearch.
Perform advanced data analysis and visualize your data in a variety of charts, tables, and
maps.
Central Log Management
Why ELK?
We needed to archive log entries for perimeter firewall which averages about 4000 tps.
Daily index is about 70GB, which is larger than our current splunk license, and was going
to cost ±R500 000 to upgrade license
Central Log Management
ELK @ UCT
syslog
Shipper Redis
IndexerElasticsearch
Central Log Management
Shipper Config
input {
udp {
type => "paloalto-syslog"
port => 5514
}
}
output {
redis { host => "127.0.0.1" data_type => "list" key => "paloalto-syslog" }
}
Central Log Management
Indexer Config
input {
redis {
...
}
}
filter {
if [message] =~ "TRAFFIC" {
csv {
columns => [ "FUTURE_USE_1", "Receive_Time", "Serial_Number", "Type", "Subtype", "FUTURE_USE_2”, ...]
}
mutate {
remove_field => [ "FUTURE_USE_1", "FUTURE_USE_2", ... ]
convert => { "Packets_Sent" => "integer" }
...
}
}
if [message] =~ "THREAT" {
...
}
...
}
output {
elasticsearch {
...
}
}
Thank You

NATE-Central-Log

  • 1.
    Central Log Management SeniorTechnical Specialist Technical Support Services – Computing Platforms University of Cape Town Stefan Coetzee Information & Communication Technology Services
  • 2.
  • 3.
    Central Log Management Splunk SplunkEnterprise is a solution for collecting, analyzing & monitoring of machine data. It also provides visualization & reporting features and even alerting on the data it gathers.
  • 4.
    Central Log Management SplunkFeatures Collect & Index Machine Data Collect & index data from almost any source, including log files, tcpudp data streams, windows event service, syslog and many more. Search & Investigate Powerful searching and analytics platform to filter through data and correlate events. Monitor & Alert Building on the power of the search engine, build monitors and alerts that trigger on certain events. Trigger emails or 3rd party scripts on alerts. Report & Analyze Build reports and send them to stakeholders. Embed charts into 3rd party applications to give broader accessibility with drilldown support. Custom Views and Dashboard Build dashboards and views that meet the needs of different user groups. Splunk Apps Use prebuild dashboards, views, reports, collectors, monitors & alerts that are bundled into a Splunk App with a quick ROI.
  • 5.
    Central Log Management SplunkFeatures (Cont) Role Based Security Only give access to data as required, audit access to data and integrate with existing LDAP infrastructure for authentication.
  • 6.
    Central Log Management SplunkPros & Cons Pros • Feature rich • Large community • Fast (Very Fast) Cons • Expensive (Very expensive as Enterprise Apps are no longer part of base subscription) • Licensing per GB not server based
  • 7.
  • 8.
  • 9.
  • 10.
  • 11.
    Central Log Management Alerts EduroamUsage Monitors eduroam login sessions and flag users authenticating from too many devices. Alert Triggers email to service desk, working on Service Now integration EXIM Spam Monitors email relaying through EXIM and flags possible exploited servers Alert Triggers email to system owner Exchange UserID Monitors authentication to Exchange and updates PaloAlto username-IP map. Alert Triggers script which send login information (username & IP) to PaloAlto CAS UserID Monitors authentication via CAS (Central Authentication Service) Alert Triggers script which send login information (username & IP) to PaloAlto ADFS UserID Monitors authentication via ADFS (Active Directory Federation Services Alert Triggers script which send login information (username & IP) to PaloAlto
  • 12.
  • 13.
    Central Log Management Logstash Logstashis a data pipeline that helps you process your logs and event data and send them to a central system. Input • file, tcp, udp, drupal_dblog, syslog, jmx, etc Filter • grok, geoip, useragent, mutate, date, drop, etc Output • elasticsearch, csv, ganglia, syslog, http, file, etc
  • 14.
    Central Log Management Elasticsearch Elasticsearchis a Lucene based distributed full-text search engine with a RESTful web interface and schema-free JSON documents. Cluster A Cluster is a collection of 1 or more nodes that holds data and provides federated indexing. Node A node is a single server that is part of your cluster, stores your data, and participates in the cluster’s indexing and search capabilities Index An index is a collection of documents that have somewhat similar characteristics. Shards & Replicas An index is split up into shards (smaller chunks), which are in turn distributed across the cluster nodes.
  • 15.
    Central Log Management Elasticsearch(Cont) Elasticsearch is a Lucene based distributed full-text search engine with a RESTful web interface and schema-free JSON documents. Cluster A Cluster is a collection of 1 or more nodes that holds data and provides federated indexing. Node A node is a single server that is part of your cluster, stores your data, and participates in the cluster’s indexing and search capabilities Index An index is a collection of documents that have somewhat similar characteristics. Shards & Replicas An index is split up into shards (smaller chunks), which are in turn distributed across the cluster nodes. Cluster Node Index Index S0 S0 R2R1 R1 R2 Node Index Index S1 S1 R2R0 R0 R2 Node Index Index S2 S2 R1R0 R0 R1
  • 16.
    Central Log Management Kibana Kibanais a visualization and analytics platform designed to work with elasticsearch. Perform advanced data analysis and visualize your data in a variety of charts, tables, and maps.
  • 17.
    Central Log Management WhyELK? We needed to archive log entries for perimeter firewall which averages about 4000 tps. Daily index is about 70GB, which is larger than our current splunk license, and was going to cost ±R500 000 to upgrade license
  • 18.
    Central Log Management ELK@ UCT syslog Shipper Redis IndexerElasticsearch
  • 19.
    Central Log Management ShipperConfig input { udp { type => "paloalto-syslog" port => 5514 } } output { redis { host => "127.0.0.1" data_type => "list" key => "paloalto-syslog" } }
  • 20.
    Central Log Management IndexerConfig input { redis { ... } } filter { if [message] =~ "TRAFFIC" { csv { columns => [ "FUTURE_USE_1", "Receive_Time", "Serial_Number", "Type", "Subtype", "FUTURE_USE_2”, ...] } mutate { remove_field => [ "FUTURE_USE_1", "FUTURE_USE_2", ... ] convert => { "Packets_Sent" => "integer" } ... } } if [message] =~ "THREAT" { ... } ... } output { elasticsearch { ... } }
  • 21.