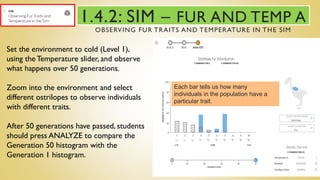
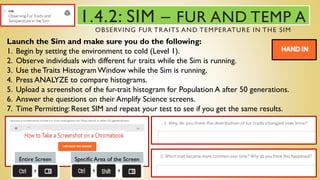
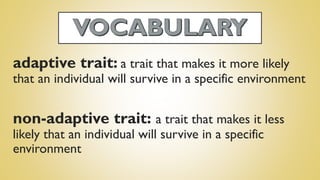
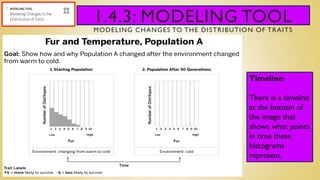
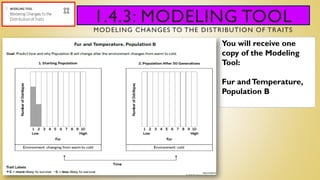
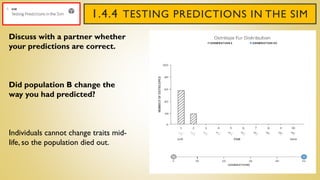
The document describes how a population of ostrilopes experienced a change in their environment from warm to cold over generations. Students used a natural selection simulation to observe how the distribution of fur traits in the population changed over time in response to the colder environment. Specifically, ostrilopes with higher levels of fur, which were adaptive in the cold, became more common, while those with lower fur levels, which were non-adaptive, decreased. Students then used a modeling tool to visually represent these changes and predict how another population may respond if its environment also became colder.
The document summarizes a lesson on explaining changes in a population of rough-skinned newts over time based on evidence. It discusses:
1) Having students review evidence that the newt population changed, with more highly poisonous individuals now than 50 generations ago.
2) Connecting this to the fact that snakes became part of the newts' environment between the first and second data samples.
3) Concluding that snakes likely caused high poison levels to become an adaptive trait, leading to more poisonous newts over time through natural selection.
This document describes an investigation of how traits change over time in different environments using a simulation of ostrilopes. Students observe an ostrilope population in two environments - one with a predator where being yellow provides camouflage, and one without a predator. In the environment with a predator, the population shifts to being entirely yellow over time as yellow ostrilopes are more likely to survive. In the environment without a predator, the trait distribution changes little. This provides evidence that yellow color is only adaptive in an environment where it provides camouflage from predators. The document then discusses using a modeling tool to predict how traits in a thornpalm population might change over time in response to environmental factors like
The document describes a simulation activity where students use a natural selection simulation to gather evidence about how traits are passed from parents to offspring during reproduction. The simulation shows that while offspring generally inherit traits from their parents, over multiple generations of reproduction the frequency of traits in a population can change as some traits become more or less common than others. The activity provides evidence to refute the claim that reproduction always produces offspring with adaptive traits, since in the simulation non-adaptive traits were still passed down from parents to offspring.
This document describes a lesson about how new traits can emerge in populations through mutations. Students will read an article on mutations and discuss how mutations could explain a new poison level trait appearing in newt populations over time. They will then use a simulation to explore how mutations can introduce variation that allows a population to adapt when the environment changes. By running the simulation with and without mutations turned on, students can compare the outcome for a population of ostrilopes in a cooling environment and see the impact of mutations on the population's ability to survive.
Exploring Variation and Distribution in Populationsdwinter1
This document provides an introduction to using a simulation called the Natural Selection Simulation to explore variation and distribution in populations. It describes the key organisms in the simulation - thornpalms, ostrilopes, and carnithons - and how their traits can be adjusted. It also explains how to use the simulation's features like turning populations on/off, zooming in on organisms, and changing trait levels and variation using sliders. Students will complete missions in the simulation by adjusting these sliders. The document concludes with an activity where students build histograms out of cubes to represent different levels of variation and distributions in populations.
Reviewing Key Ideas About Natural Selectiondwinter1
The document discusses natural selection and reproduction through a lesson on newts. It explains that traits are passed down from parents to offspring, and that individuals with adaptive traits are more likely to survive and reproduce, passing on those traits. The lesson has students complete different activities to understand how adaptive traits like high poison levels in newts became more common in a population over time through this process. It concludes with a self-assessment for students to reflect on their learning.
The document discusses natural selection and how traits become more or less common over generations within populations. It describes an investigation using a simulation of ostrilopes with different color traits. Data was collected on how many offspring each color trait produced. The data showed that ostrilopes with the yellow color 7 trait reproduced more on average and became more common in the population over time, while ostrilopes with traits like blue 1 and yellow 10 that did not provide camouflage reproduced less and became less common. This occurred because traits that helped ostrilopes survive longer, like yellow 7, allowed them to reproduce more and pass on their genes more frequently.
This document discusses mutations in populations and how traits created by mutations may become more or less common over generations. It describes an activity using a simulation where students will investigate whether mutations can introduce non-adaptive fur traits into an ostrich population in a cold environment. The simulation allows students to observe the population over 50 generations with mutations turned on and analyze changes in fur traits, to see if low-fur traits introduced by mutation become more or less common. Key points emphasized are that mutations occur randomly, can create adaptive, non-adaptive or neutral traits, and adaptive traits will become more common while non-adaptive traits will become less common over time.
Mutations can introduce new traits into a population. A mutated trait will become more common over generations if it provides an adaptive advantage in the environment. According to the document, a mutation introduced a trait for high poison levels in newts 50 generations ago. When snakes were introduced to the environment 40 generations ago, the high poison levels provided an adaptive advantage by preventing snakes from eating the newts. As a result, the highly poisonous trait became the most common trait in the newt population over many generations.
This document describes a science seminar about stickleback fish. It includes sections where students annotate passages about sticklebacks, are introduced to how the population has changed over generations from having more armor plates to fewer, and examine evidence cards about stickleback traits, environment, and lifespan. The goal is for students to analyze the evidence and determine which of two claims is best supported about what caused the changes in the stickleback population.
Natural Selection - The Mystery of the Poisonous Newtdwinter1
This document provides an overview of a lesson on describing populations and investigating why a population of rough-skinned newts has become more poisonous over time. The lesson has students observe traits in populations of butterflies and dogface butterflies to understand what a trait is and how to describe variation within a population. It then introduces students to the investigation question of why the newt population in Oregon State Park has become more toxic. The lesson concludes by assigning students homework reading two articles on rough-skinned newts and a scientist who studies natural selection to help understand changes in the newt population.
This document provides guidance to students on developing a scientific argument to explain why stickleback populations changed over 13 generations. It instructs students to use a Reasoning Tool template to organize their claim, evidence, and reasoning. Students are told to annotate their Reasoning Tool by circling their strongest evidence, crossing out unrelated evidence, and connecting related evidence with arrows. They then write an argument referring back to the Reasoning Tool and using suggested sentence starters to clearly articulate their reasoning. For homework, students finalize and revise their written arguments.
The document discusses exploring antimalarial drugs to treat malaria. It describes running tests in MalariaMed to investigate how changing the drug type, dose size, and number of treatment days affects various criteria like the total parasite population, drug resistance, patient side effects, and total cost. The tests show that using a larger dose or more days of treatment generally reduces the parasite population more but increases drug resistance faster. In contrast, a smaller dose or fewer days reduces side effects and cost but risks allowing more parasites to survive and the population increasing. Using multiple drugs sequentially is suggested as a way to minimize drug resistance.
Using a single drug treatment for malaria results in a shift in the parasite population toward increased resistance to that drug over time. Testing different single-drug treatments in the MalariaMed model showed that resistance developed quickly when only one drug was used. Combining multiple antimalarial drugs is preferable to delay the development of resistance compared to reliance on a single drug.
This document outlines steps for interns to review design feedback, interpret how well their design addressed different criteria, and plan iterative testing to improve their design. Interns receive feedback letters evaluating their designs on criteria like minimizing drug resistance, reducing side effects, and lowering treatment costs. They annotate the letters and record notes in a feedback summary table, color-coding results as strongly, moderately, or weakly addressing each criterion. Discussing trade-offs between criteria helps interns prioritize areas for improvement and set targets for their redesign strategies, as it is difficult for one design to strongly address all criteria equally. The goal is to identify an optimal design through iterative testing and choice of priority among criteria.
Darwin proposed the theory of evolution by natural selection, with four main ideas: 1) Common descent, that all organisms are related through descent from a shared ancestor, 2) Gradualism, that new species arise gradually through accumulation of adaptations, 3) Multiplication of species, whereby gradual changes lead to diversification, and 4) Natural selection, the mechanism by which organisms better adapted to their environment are more likely to survive and produce offspring.
1. Cells are the basic unit of all living things. Robert Hooke first observed cells in 1665 using a microscope. The cell theory states that all living things are made of cells, cells come only from pre-existing cells, and cells contain the basic components necessary for life.
2. Cells vary in size but have limitations based on their surface area to volume ratio. As cells increase in size, their ability to exchange materials decreases. Multicellular organisms overcome this through specialized tissues, organs and circulatory systems.
3. Cells carry out the basic functions of life including metabolism, reproduction, homeostasis, growth, response to stimuli, waste removal and nutrition. Unicellular organisms carry out all life functions
This document discusses the evolution of vertebrates from early chordates. It covers the key characteristics of chordates like having a notochord and dorsal nerve cord. Chordates evolved into craniates, which have a head. Craniates evolved traits like a skull, brain, and neural crest cells that give rise to bone and cartilage. Craniates also developed gill slits for respiration and had higher metabolisms. Vertebrates are a subphylum of craniates that have a backbone made of vertebrae, and include over 52,000 species ranging greatly in form.
The document describes an investigation where students will compare and analyze the skeletons of several vertebrates - human, frog, crocodile, pigeon, and cat. They will examine the skeletons to identify homologous structures that provide evidence of a common evolutionary ancestor. Students will also be given mystery bones to classify by comparing to the illustrated skeletons. The investigation allows students to observe both similarities and differences between vertebrate skeletons and analyze how bone structure relates to an animal's function and environment.
Darwin proposed four main ideas about evolution: 1) Common descent - all organisms are related through descent from a common ancestor; 2) Gradualism - new species arise gradually through accumulation of small adaptations over time; 3) Multiplication of species - populations tend to increase in size, leading to new species; 4) Natural selection - individuals with traits better suited to the environment will leave more offspring, driving evolution.
The document discusses the different levels of biological organization from lowest to highest: cells, tissues, organs, organ systems, organisms, populations, communities, ecosystems, and the biosphere. It provides descriptions and examples of each level. Activities are included where students identify levels of organization from images and fill in blanks with the correct biological term. The purpose is to teach students about the hierarchical organization of living things from cells to the entire biosphere.
Natural selection can only occur if there is variation among members of the same species.
Mutation, meiosis and sexual reproduction cause variation between individuals in a species.
Adaptations are characteristics that make an individual suited to its environment and way of life.
Species tend to produce more offspring than the environment can support.
Individuals that are better adapted tend to survive and produce more offspring while the less well adapted tend to die or produce fewer offspring.
Individuals that reproduce pass on characteristics to their offspring.
Natural selection increases the frequency of characteristics that make individuals better adapted and decreases the frequency of other characteristics leading to changes within the species.
History of science and technology. Historical antecedents of science and technology that shows the inventions that led to the modernization of science and technology Historical antecedents of science and technology that shows the inventions that led to the modernization of science and technology Historical antecedents of science and technology that shows the inventions that led to the modernization of science and technology. Historical antecedents of science and technology that shows the inventions that led to the modernization of science and technology
ach of the pink areas is a cell; Most are pink and cells change characteristics . . .get more flatten and full of protein as go through the layers
Top layer=dead cells provide hydrophobic barrier to block liquid from coming in What happens when you go swimming? ach of the pink areas is a cell; Most are pink and cells change characteristics . . .get more flatten and full of protein as go through the layers
Top layer=dead cells provide hydrophobic barrier to block liquid from coming in What happens when you go swimming?ach of the pink areas is a cell; Most are pink and cells change characteristics . . .get more flatten and full of protein as go through the layers
Top layer=dead cells provide hydrophobic barrier to block liquid from coming in What happens when you go swimming?ach of the pink areas is a cell; Most are pink and cells change characteristics . . .get
Biology - Chp 15 - Darwins Theory Of Evolution - PowerPointMel Anthony Pepito
Darwin developed the theory of evolution by natural selection to explain the diversity of life. Through his travels and observations, he noticed that species varied in different environments and regions. He proposed that species evolve over generations as natural selection favors individuals with traits better suited to their environment, leading to the descent of all species with modification from common ancestors.
All living things evolved from a common ancestor through the process of evolution by natural selection over long periods of time. Evolution is supported by extensive evidence from various scientific disciplines including genetics, comparative anatomy, the fossil record, and observations of natural selection in present-day populations. While evolution was once controversial, it is now widely accepted in the scientific community as a fundamental principle of modern biology.
- Charles Darwin developed the theory of evolution by natural selection to explain how life evolves over time through descent with modification from common ancestors.
- During his voyage on the HMS Beagle, Darwin made extensive observations of wildlife and fossils. He noticed patterns of biodiversity including variations between species in different locations.
- Darwin was influenced by ideas from scientists like Lyell, Hutton, and Lamarck. Lyell and Hutton proposed that geological changes occurred gradually over long periods, influencing Darwin's view of biological changes also requiring vast timescales.
The document provides evidence for evolution from multiple sources, including the fossil record, homologous and vestigial structures, selective breeding experiments, biogeography, and molecular data. It discusses several key understandings:
1) Evolution occurs through heritable changes in species over time.
2) The fossil record shows a progression of species over layers of sedimentary rock based on radioactive dating techniques.
3) Selective breeding demonstrates how artificial selection can cause evolution.
4) Similar structures with different functions, as well as vestigial structures, provide anatomical evidence of evolution from common ancestors.
The document presents examples for each understanding and analyzes how various data support the theory of evolution through inherited changes in populations
The Theory of Evolution and its limitsRemy Taupier
The laws of Natural Selection explain the adaptation of a species (why we have dogs, or horses or tortoise of different colors, shapes and sizes) but not the evolution of a species into another species. To this day no scientific fact can prove the Theory of Evolution to be true. Evolutionists live with the hope that one day Science will prove them right. It's just a belief.
This document provides instructions for interns to complete and submit their final malaria treatment proposal. It guides them through writing an introduction paragraph by copying relevant information from their project summary. It then instructs them to state their design claim by describing the key aspects of the proposed treatment design. For the conclusion, interns are told to summarize why their design should be chosen, describe their design priorities and the trade-offs between criteria, and convince the reader their design is optimal despite the trade-offs. The document also reviews revising the entire proposal, including the three design decision paragraphs, before submitting.
1. Interns were instructed to review feedback from the project director on their outline and background research and discuss how to strengthen their design decision paragraphs with colleagues.
2. They were then directed to write the three design decision paragraphs for their proposal, using their outline, feedback, and other resources as guides.
3. Interns were reminded to save their work in progress but not submit, as they will continue working on the introduction and conclusion sections during their next workday. They should review tasks and determine if any unfinished work needs completion after hours.
The document discusses strategies for writing a strong proposal to address the problem of drug-resistant malaria, including focusing on one section of the proposal at a time, using an outline to organize evidence supporting design claims, and reviewing examples to understand how different parts fit together. Interns are asked to gather evidence by outlining their design decisions for three criteria related to minimizing drug resistance, side effects, and cost in order to receive feedback on their evidence and arguments.
Engineers at Futura are developing malaria treatments using an iterative design process and simulation tool called MalariaMed. Students practiced this process by running multiple iterative tests of simulated malaria treatment designs, recording the results, and analyzing the data to identify the strongest design. The best design would minimize drug resistance and side effects while keeping costs low, without increasing the malaria parasite population. After analyzing all their results, students selected one design to submit to their project director for feedback on how to further improve their treatment design.
The document describes a classroom lesson where students will participate in a Science Seminar discussion to answer the question "What caused the stickleback population to have less armor and become faster?". The students will be split into two groups - one to lead the discussion in the inner semicircle and one to listen and take notes in the outer semicircle, and they will switch roles halfway through. The goal is for the students to use the evidence cards and their knowledge to build the best explanation for why the environmental change caused the stickleback population to change.
The document discusses a chapter about natural selection and reproduction. It includes sections about warming up and reading activities for students, including reading an article called "The Deadly Dare" about how poison helps rough-skinned newts survive and how it became more common over generations through natural selection. The chapter asks how some traits become more common over many generations while others become less common.
The document describes students rereading an article on how a newt population evolved to have higher levels of poison over generations. It has the students use evidence from histograms and the article to complete a reasoning tool connecting the evidence to a claim about why the trait for increased poison became more common. The reasoning tool is used to help the students write a scientific argument explaining their claim to share with others.
Writing an Argument About the Channel on Marsdwinter1
This document provides guidance and context for students to write an argument about what geologic process formed a channel on Mars. It instructs students to use the Reasoning Tool from Lesson 3.3 to write a claim supported by evidence. It emphasizes that students should be clear and convincing in their explanation of how the evidence supports the claim in order to persuade the audience of planetary geologists. The document also notes that students can refer to other resources and should craft their full argument in the provided space.
This document discusses using evidence to support claims about geology on Mars. It provides examples of evidence that was discovered by the Curiosity rover, including an image of rock near a landform that changed scientists' thinking about the possibility of water on Mars. The document emphasizes the importance of reasoning - clearly explaining how evidence connects to and supports claims. It introduces a "Reasoning Tool" graphic organizer to help organize arguments by explaining the link between each piece of evidence and the claim. The document also provides discussion questions to help students practice developing reasoning and constructing convincing arguments using evidence from Mars.
The document discusses new information from NASA about a channel on Mars. It includes an image from the Curiosity rover showing rock found near the base of the channel. The document discusses different types of rocks, including conglomerate which can form near channels formed by water, and basalt which is often found near lava channels. Students will examine rock samples and use an evidence gradient to evaluate claims about how the Mars channel was formed based on the new evidence of the rock type.
I'm not fully convinced yet, but the evidence of a triangle-shaped landform is consistent with both flowing lava and flowing water processes. More evidence is still needed to determine which process best explains the formation of the channel on Mars.
This document discusses using models to gather evidence about geological formations on Mars. It describes a student observing a model of flowing lava to determine if lava could have formed channels on Mars that are similar in shape to an observed channel. The model shows lava forming a channel with a triangular cross-section at the bottom, matching the shape of the channel on Mars, providing evidence that lava may have created it. The document suggests students will learn more evidence from NASA about the geological processes that formed the channel to help determine if it resulted from lava or water.
Modeling a Geologic Process - Stream Tabledwinter1
Gerya created a computer model to test his idea that thinner crust and higher temperatures on Venus allowed lava to break through the surface, forming landforms called novae. The results of Gerya's model matched the shapes of actual novae on Venus, providing evidence that his idea was correct.
Similarly, students used a physical stream table model to test the idea that water-carved landforms would remain after the water stopped flowing. Observations of the model showed that landforms did persist, supporting the claim that flowing water could have formed features like the channel on Mars. Models thus help scientists gather evidence about geological processes by allowing them to simulate and test their hypotheses.
Scientists observed unusual landforms on Venus called novae. To learn more about how they formed, a scientist developed a model of Venus' atmosphere and surface conditions. Testing this model led to the conclusion that lava eruptions created the novae landforms. Gathering more evidence about conditions on other planets, like investigating Mars' atmosphere and surface over time, could help determine if lava or water formed features like the Martian channel.
The document summarizes a chapter about investigating a mystery object on Mars using scientific argumentation. It discusses how scientists make claims and support them with evidence. Students analyzed images of Mars and considered two claims about a mysterious object: that it was a jelly donut or a rock. By examining additional evidence images, they determined the rock claim was better supported and most scientists agree with that conclusion. The process of gathering multiple lines of evidence and revising conclusions is key to scientific argumentation.
ISO/IEC 27001, ISO/IEC 42001, and GDPR: Best Practices for Implementation and...PECB
Denis is a dynamic and results-driven Chief Information Officer (CIO) with a distinguished career spanning information systems analysis and technical project management. With a proven track record of spearheading the design and delivery of cutting-edge Information Management solutions, he has consistently elevated business operations, streamlined reporting functions, and maximized process efficiency.
Certified as an ISO/IEC 27001: Information Security Management Systems (ISMS) Lead Implementer, Data Protection Officer, and Cyber Risks Analyst, Denis brings a heightened focus on data security, privacy, and cyber resilience to every endeavor.
His expertise extends across a diverse spectrum of reporting, database, and web development applications, underpinned by an exceptional grasp of data storage and virtualization technologies. His proficiency in application testing, database administration, and data cleansing ensures seamless execution of complex projects.
What sets Denis apart is his comprehensive understanding of Business and Systems Analysis technologies, honed through involvement in all phases of the Software Development Lifecycle (SDLC). From meticulous requirements gathering to precise analysis, innovative design, rigorous development, thorough testing, and successful implementation, he has consistently delivered exceptional results.
Throughout his career, he has taken on multifaceted roles, from leading technical project management teams to owning solutions that drive operational excellence. His conscientious and proactive approach is unwavering, whether he is working independently or collaboratively within a team. His ability to connect with colleagues on a personal level underscores his commitment to fostering a harmonious and productive workplace environment.
Date: May 29, 2024
Tags: Information Security, ISO/IEC 27001, ISO/IEC 42001, Artificial Intelligence, GDPR
-------------------------------------------------------------------------------
Find out more about ISO training and certification services
Training: ISO/IEC 27001 Information Security Management System - EN | PECB
ISO/IEC 42001 Artificial Intelligence Management System - EN | PECB
General Data Protection Regulation (GDPR) - Training Courses - EN | PECB
Webinars: https://pecb.com/webinars
Article: https://pecb.com/article
-------------------------------------------------------------------------------
For more information about PECB:
Website: https://pecb.com/
LinkedIn: https://www.linkedin.com/company/pecb/
Facebook: https://www.facebook.com/PECBInternational/
Slideshare: http://www.slideshare.net/PECBCERTIFICATION
A workshop hosted by the South African Journal of Science aimed at postgraduate students and early career researchers with little or no experience in writing and publishing journal articles.
How to Setup Warehouse & Location in Odoo 17 InventoryCeline George
In this slide, we'll explore how to set up warehouses and locations in Odoo 17 Inventory. This will help us manage our stock effectively, track inventory levels, and streamline warehouse operations.
LAND USE LAND COVER AND NDVI OF MIRZAPUR DISTRICT, UPRAHUL
This Dissertation explores the particular circumstances of Mirzapur, a region located in the
core of India. Mirzapur, with its varied terrains and abundant biodiversity, offers an optimal
environment for investigating the changes in vegetation cover dynamics. Our study utilizes
advanced technologies such as GIS (Geographic Information Systems) and Remote sensing to
analyze the transformations that have taken place over the course of a decade.
The complex relationship between human activities and the environment has been the focus
of extensive research and worry. As the global community grapples with swift urbanization,
population expansion, and economic progress, the effects on natural ecosystems are becoming
more evident. A crucial element of this impact is the alteration of vegetation cover, which plays a
significant role in maintaining the ecological equilibrium of our planet.Land serves as the foundation for all human activities and provides the necessary materials for
these activities. As the most crucial natural resource, its utilization by humans results in different
'Land uses,' which are determined by both human activities and the physical characteristics of the
land.
The utilization of land is impacted by human needs and environmental factors. In countries
like India, rapid population growth and the emphasis on extensive resource exploitation can lead
to significant land degradation, adversely affecting the region's land cover.
Therefore, human intervention has significantly influenced land use patterns over many
centuries, evolving its structure over time and space. In the present era, these changes have
accelerated due to factors such as agriculture and urbanization. Information regarding land use and
cover is essential for various planning and management tasks related to the Earth's surface,
providing crucial environmental data for scientific, resource management, policy purposes, and
diverse human activities.
Accurate understanding of land use and cover is imperative for the development planning
of any area. Consequently, a wide range of professionals, including earth system scientists, land
and water managers, and urban planners, are interested in obtaining data on land use and cover
changes, conversion trends, and other related patterns. The spatial dimensions of land use and
cover support policymakers and scientists in making well-informed decisions, as alterations in
these patterns indicate shifts in economic and social conditions. Monitoring such changes with the
help of Advanced technologies like Remote Sensing and Geographic Information Systems is
crucial for coordinated efforts across different administrative levels. Advanced technologies like
Remote Sensing and Geographic Information Systems
9
Changes in vegetation cover refer to variations in the distribution, composition, and overall
structure of plant communities across different temporal and spatial scales. These changes can
occur natural.
The simplified electron and muon model, Oscillating Spacetime: The Foundation...RitikBhardwaj56
Discover the Simplified Electron and Muon Model: A New Wave-Based Approach to Understanding Particles delves into a groundbreaking theory that presents electrons and muons as rotating soliton waves within oscillating spacetime. Geared towards students, researchers, and science buffs, this book breaks down complex ideas into simple explanations. It covers topics such as electron waves, temporal dynamics, and the implications of this model on particle physics. With clear illustrations and easy-to-follow explanations, readers will gain a new outlook on the universe's fundamental nature.
How to Manage Your Lost Opportunities in Odoo 17 CRMCeline George
Odoo 17 CRM allows us to track why we lose sales opportunities with "Lost Reasons." This helps analyze our sales process and identify areas for improvement. Here's how to configure lost reasons in Odoo 17 CRM
it describes the bony anatomy including the femoral head , acetabulum, labrum . also discusses the capsule , ligaments . muscle that act on the hip joint and the range of motion are outlined. factors affecting hip joint stability and weight transmission through the joint are summarized.
How to Build a Module in Odoo 17 Using the Scaffold MethodCeline George
Odoo provides an option for creating a module by using a single line command. By using this command the user can make a whole structure of a module. It is very easy for a beginner to make a module. There is no need to make each file manually. This slide will show how to create a module using the scaffold method.
Walmart Business+ and Spark Good for Nonprofits.pdfTechSoup
"Learn about all the ways Walmart supports nonprofit organizations.
You will hear from Liz Willett, the Head of Nonprofits, and hear about what Walmart is doing to help nonprofits, including Walmart Business and Spark Good. Walmart Business+ is a new offer for nonprofits that offers discounts and also streamlines nonprofits order and expense tracking, saving time and money.
The webinar may also give some examples on how nonprofits can best leverage Walmart Business+.
The event will cover the following::
Walmart Business + (https://business.walmart.com/plus) is a new shopping experience for nonprofits, schools, and local business customers that connects an exclusive online shopping experience to stores. Benefits include free delivery and shipping, a 'Spend Analytics” feature, special discounts, deals and tax-exempt shopping.
Special TechSoup offer for a free 180 days membership, and up to $150 in discounts on eligible orders.
Spark Good (walmart.com/sparkgood) is a charitable platform that enables nonprofits to receive donations directly from customers and associates.
Answers about how you can do more with Walmart!"
RPMS TEMPLATE FOR SCHOOL YEAR 2023-2024 FOR TEACHER 1 TO TEACHER 3
Investigating Changes In Trait Distribution
1. CHAPTER 1 – ENVIRONMENTAL CHANGE AND
TRAIT DISTRIBUTION
2. 1.4.1:WARM-UP
Observing Populations at Two Generations
The histograms below show the distribution of fur-level traits in a population at two different
points in time. Review the two histograms and answer the questions below.
1. Do the two histograms show the same amount of
variation in the population at both generations?
2. Do the two histograms show the same distribution of
traits at both generations?
YES NO YES NO
The distribution of the traits changed over time.
3.
4. 1.4.1:WARM-UP
Observing Populations at Two Generations
The histograms below show the distribution of fur-level traits in a population at two different
points in time. Review the two histograms and answer the questions below.
1. Do the two histograms show
the same amount of variation
in the population at both
generations?
2. Do the two histograms show
the same distribution of traits at
both generations?
NO NO
5. 1.4.1:WARM-UP
• At Generation 50, the distribution was
different since most of the ostrilopes
had a high amount of fur.
• There was also less variation since
there were only 4 fur traits.
• The population started with most
ostrilopes having low amount of fur.
• The population at this time had a high
variation – 7 different fur traits.
Why did the distribution changed from mostly individuals with traits for low
and medium levels of fur to mostly individuals with high levels of fur?
6. What makes the distribution of traits in a population
change?
Investigation
Question:
In the next activity, you will
use the Natural Selection
Sim to begin thinking about
what made the distribution
of fur traits in the Ostrilope
population change over
time.
1.4.2: SIM – UTILIZE SIM
OBSERVING FUR TRAITS AND TEMPERATURE IN THE SIM
7. 1.4.2: SIM – UTILIZE SIM
OBSERVING FUR TRAITS AND TEMPERATURE IN THE SIM
Let’s examine some more
controls in the SIM
• Temperature Slider
- Observe the changing visuals.
- Only make ONE temperature
change to make conclusions.
MILDTEMP.
8. 1.4.2: SIM – UTILIZE SIM
OBSERVING FUR TRAITS AND TEMPERATURE IN THE SIM
Let’s examine some more
controls in the SIM
• Temperature Slider
- Observe the changing visuals.
- Only make ONE temperature
change to make conclusions.
MILDTEMP.COLD TEMP.
9. 1.4.2: SIM – UTILIZE SIM
OBSERVING FUR TRAITS AND TEMPERATURE IN THE SIM
Let’s examine some more
controls in the SIM
• Temperature Slider
- Observe the changing visuals.
- Only make ONE temperature
change to make conclusions.
MILDTEMP.COLD TEMP.HOT TEMP.
10. 1.4.2: SIM – UTILIZE SIM
OBSERVING FUR TRAITS AND TEMPERATURE IN THE SIM
• Traits Histogram Window Run
- Run Sim by pressing NEXT
- Then hit “RUN” in the build
setup menu.
- Collect a few generations of data
- OpenTraits Histogram Window
(Bottom Left icon)
- Observe real-time histograms of
different features
11. 1.4.2: SIM – UTILIZE SIM
OBSERVING FUR TRAITS AND TEMPERATURE IN THE SIM
• Traits Histogram Window Run
- Run Sim by pressing NEXT
- Then hit “RUN” in the build
setup menu.
- Collect a few generations of data
- OpenTraits Histogram Window
(Bottom Left icon)
- Observe real-time histograms of
different features
12. 1.4.2: SIM – UTILIZE SIM
OBSERVING FUR TRAITS AND TEMPERATURE IN THE SIM
• Traits Histogram Window Run
- Run Sim by pressing NEXT
- Then hit “RUN” in the build
setup menu.
- Collect a few generations of data
- OpenTraits Histogram Window
(Bottom Left icon)
- Observe real-time histograms of
different features
13. 1.4.2: SIM – UTILIZE SIM
OBSERVING FUR TRAITS AND TEMPERATURE IN THE SIM
• Traits Histogram Window Run
- Run Sim by pressing NEXT
- Then hit “RUN” in the build
setup menu.
- Collect a few generations of data
- OpenTraits Histogram Window
(Bottom Left icon)
- Observe real-time histograms of
different features
14. 1.4.2: SIM – UTILIZE SIM
OBSERVING FUR TRAITS AND TEMPERATURE IN THE SIM
• Traits Histogram Window Run
- Run Sim by pressing NEXT
- Then hit “RUN” in the build
setup menu.
- Collect a few generations of data
- OpenTraits Histogram Window
(Bottom Left icon)
- Observe real-time histograms of
different features
15. 1.4.2: SIM – UTILIZE SIM
OBSERVING FUR TRAITS AND TEMPERATURE IN THE SIM
• Traits Histogram Window Run
- Run Sim by pressing NEXT
- Then hit “RUN” in the build
setup menu.
- Collect a few generations of data
- OpenTraits Histogram Window
(Bottom Left icon)
- Observe real-time histograms of
different features
16. 1.4.2: SIM – UTILIZE SIM
OBSERVING FUR TRAITS AND TEMPERATURE IN THE SIM
• Speed Controls
- Use drop down to collect many
generations of data more quickly.
17. 1.4.2: SIM – UTILIZE SIM
OBSERVING FUR TRAITS AND TEMPERATURE IN THE SIM
• Histograms in Analyze
- Use Analyze in Build Setup
menu.
- Move generation slider.
- Note the stripes show the
starting generation
histogram.
18. 1.4.2: SIM – FUR AND TEMP A
OBSERVING FUR TRAITS AND TEMPERATURE IN THE SIM
Starting histogram – Fur and
Temperature A Mode
• Press Build, then Rebuild
• Click on Ostrilope
• Look at starting Ostrilope population
Note that it has the same distribution of fur
traits as in the Generation 1 Histogram
from the Warm-Up.
These ostrilopes have been living in a warm
environment, but that students are going to
change the environment to be colder.
19. 1.4.2: SIM – FUR AND TEMP A
OBSERVING FUR TRAITS AND TEMPERATURE IN THE SIM
Starting histogram – Fur and
Temperature A Mode
• Press Build, then Rebuild
• Click on Ostrilope
• Look at starting Ostrilope population
Note that it has the same distribution of fur
traits as in the Generation 1 Histogram
from the Warm-Up.
These ostrilopes have been living in a warm
environment, but that students are going to
change the environment to be colder.
20. 1.4.2: SIM – FUR AND TEMP A
OBSERVING FUR TRAITS AND TEMPERATURE IN THE SIM
Starting histogram – Fur and
Temperature A Mode
• Press Build, then Rebuild
• Click on Ostrilope
• Look at starting Ostrilope population
Note that it has the same distribution of fur
traits as in the Generation 1 Histogram
from the Warm-Up.
These ostrilopes have been living in a warm
environment, but that students are going to
change the environment to be colder.
21. 1.4.2: SIM – FUR AND TEMP A
OBSERVING FUR TRAITS AND TEMPERATURE IN THE SIM
Starting histogram – Fur and
Temperature A Mode
• Press Build, then Rebuild
• Click on Ostrilope
• Look at starting Ostrilope population
Note that it has the same distribution of fur
traits as in the Generation 1 Histogram
from the Warm-Up.
These ostrilopes have been living in a warm
environment, but that students are going to
change the environment to be colder.
22. 1.4.2: SIM – FUR AND TEMP A
OBSERVING FUR TRAITS AND TEMPERATURE IN THE SIM
Set the environment to cold (Level 1),
using the Temperature slider, and observe
what happens over 50 generations.
Zoom into the environment and select
different ostrilopes to observe individuals
with different traits.
After 50 generations have passed, students
should press ANALYZE to compare the
Generation 50 histogram with the
Generation 1 histogram.
23. 1.4.2: SIM – FUR AND TEMP A
OBSERVING FUR TRAITS AND TEMPERATURE IN THE SIM
Set the environment to cold (Level 1),
using the Temperature slider, and observe
what happens over 50 generations.
Zoom into the environment and select
different ostrilopes to observe individuals
with different traits.
After 50 generations have passed, students
should press ANALYZE to compare the
Generation 50 histogram with the
Generation 1 histogram.
24. 1.4.2: SIM – FUR AND TEMP A
OBSERVING FUR TRAITS AND TEMPERATURE IN THE SIM
Set the environment to cold (Level 1),
using the Temperature slider, and observe
what happens over 50 generations.
Zoom into the environment and select
different ostrilopes to observe individuals
with different traits.
After 50 generations have passed, students
should press ANALYZE to compare the
Generation 50 histogram with the
Generation 1 histogram.
Each bar tells us how many
individuals in the population have a
particular trait.
25. 1.4.2: SIM – FUR AND TEMP A
OBSERVING FUR TRAITS AND TEMPERATURE IN THE SIM
Launch the Sim and make sure you do the following:
1. Begin by setting the environment to cold (Level 1).
2. Observe individuals with different fur traits while the Sim is running.
3. Use theTraits Histogram Window while the Sim is running.
4. Press ANALYZE to compare histograms.
5. Upload a screenshot of the fur-trait histogram for Population A after 50 generations.
6. Answer the questions on their Amplify Science screens.
7. Time Permitting: Reset SIM and repeat your test to see if you get the same results.
Entire Screen Specific Area of the Screen
26. 1.4.2: SIM – FUR AND TEMP A
OBSERVING FUR TRAITS AND TEMPERATURE IN THE SIM
Discuss your responses to the questions with a partner.
27. 1.4.2: SIM
OBSERVING FUR TRAITS AND TEMPERATURE IN THE SIM
Let’s review your work
The high fur-level trait became more common because
individuals with this trait could survive in the cold
environment.
"The population started with ostrilopes that had low,
medium, and high levels of fur. I saw that the ostrilopes with
the low level of fur shivered and died in the cold
environment, but the ones with the high level of fur
survived. "
28. 1.4.2: SIM
OBSERVING FUR TRAITS AND TEMPERATURE IN THE SIM
Use your interpretation of the data to
hypothesize that the change shown in the
data was caused by the environmental
change – cold environment.
When a bar gets shorter, it means that
individuals died because they did not have
enough fur to survive in the cold
environment.
29. 1.4.2: SIM
OBSERVING FUR TRAITS AND TEMPERATURE IN THE SIM
Traits for high fur became more common
and the traits for low fur became less
common.
• The ostrilopes with lower fur-level traits
shivered and died in the cold
environment.
• The ostrilopes with higher fur-level traits
survived in the cold environment. More
fur helped them survive, and they
became more common.
30. environment: everything (living and nonliving) that
surrounds an organism
Each of these environments includes many living things, such as plants and animals, and
nonliving things, such as rocks and water.
From left to right: Craters of the Moon National Monument, Idaho; Denali National Park,
Alaska; Guadalupe Mountains National Park,Texas; Channel Islands National Park, California.
31. adaptive trait: a trait that makes it more likely
that an individual will survive in a specific environment
non-adaptive trait: a trait that makes it less
likely that an individual will survive in a specific
environment
32. 1.4.2: SIM
INTRODUCING ADAPTIVE AND NON-ADAPTIVE TRAITS
Higher fur-level traits
Lower fur-level traits
No, they shivered and died
What were the adaptive traits in this Sim mode?
In other words, which traits helped individual
ostrilopes survive best in the cold
environment?
What were the non-adaptive traits in this Sim
mode? In other words, which traits made it less
likely that an individual ostrilope would survive
in the cold environment?
Were individuals with the non-adaptive traits
able to change to an adaptive trait in the middle
of their lifetime?
33. 1.4.3: MODELING TOOL
MODELING CHANGES TO THE DISTRIBUTION OF TRAITS
Show how and why Population A changed after
the environment changed from warm to cold.
GOAL
Fur vs.Temp A
You will be learning how to model
your ideas about changes in the
distribution of traits in populations
using the natural selection
simulation model.
Remember: Scientists create models to
communicate ideas about how things
work to other people.
34. 1.4.3: MODELING TOOL
MODELING CHANGES TO THE DISTRIBUTION OF TRAITS
Types of Models:
• Physical models, like a globe or a model
of a cell.
• Computer programs, like a computer
model that predicts weather or
the Natural Selection Simulation.
• Visual representations, like a food web or
a diagram of the water cycle.
You will be using a special tool called a
Modeling Tool to make visual models that
show your thinking about why populations
change over time.
35. 1.4.3: MODELING TOOL
MODELING CHANGES TO THE DISTRIBUTION OF TRAITS
Histograms:
There are two
histograms that
represent the
same population
at two different
points in time.
36. 1.4.3: MODELING TOOL
MODELING CHANGES TO THE DISTRIBUTION OF TRAITS
Timeline:
There is a timeline
at the bottom of
the image that
shows what points
in time these
histograms
represent.
37. 1.4.3: MODELING TOOL
MODELING CHANGES TO THE DISTRIBUTION OF TRAITS
Environment
labels:
There are labels
below each
histogram that
describe aspects
of the
environment and
whether the
environment is
changing.
38. 1.4.3: MODELING TOOL
MODELING CHANGES TO THE DISTRIBUTION OF TRAITS
Trait labels:
There is a legend
that shows
symbols and what
those symbols
mean.
39. 1.4.3: MODELING TOOL
MODELING CHANGES TO THE DISTRIBUTION OF TRAITS
Examine the Starting Population Histogram
The environment is changing from warm to cold, just like
in the previous Sim activity.
Which Ostrilopes would be more likely to survive and
which would be less likely to survive in the cold
environment?
More likely to
survive
41. 1.4.3: MODELING TOOL
MODELING CHANGES TO THE DISTRIBUTION OF TRAITS
These histograms are the same as the histograms you saw in the Warm-Up.
In the Sim and the Warm-Up, we observed that the distribution of traits changed over
time.
This example modeled the change we saw in the Sim.
42. 1.4.3: MODELING TOOL
MODELING CHANGES TO THE DISTRIBUTION OF TRAITS
We learned that traits for higher fur levels are adaptive traits
in a cold environment because they help ostrilopes survive in
cold environments.
Lower fur-level traits make it difficult to survive in a cold
environment.
This means traits for lower fur levels are non-adaptive traits
in cold environments.
You will continue to investigate what causes the
distribution of traits in a population to change as
you create another model.
43. 1.4.3: MODELING TOOL
MODELING CHANGES TO THE DISTRIBUTION OF TRAITS
You will receive one
copy of the Modeling
Tool:
Fur andTemperature,
Population B
44. 1.4.3: MODELING TOOL
MODELING CHANGES TO THE DISTRIBUTION OF TRAITS
POPULATION A POPULATION B
Share what similarities and differences
you notice between Population B and
Population A and their environments.
45. 1.4.3: MODELING TOOL
MODELING CHANGES TO THE DISTRIBUTION OF TRAITS
POPULATION A POPULATION B
• Like Population A, most
of the ostrilopes in
Population B have low
fur-level traits.
• There is much less
variation in fur-level traits
in Population B compared
to Population A.
• Both populations
experience an
environment that gets
colder suddenly.
46. 1.4.3: MODELING TOOL
MODELING CHANGES TO THE DISTRIBUTION OF TRAITS
In our next activity, we
will test our predictions
using the SIM.
Let’s discuss making
predictions.
We do not yet know how
the distribution of traits in
Population B will change as
a result of the environment
becoming cold.
47. 1.4.3: MODELING TOOL
MODELING CHANGES TO THE DISTRIBUTION OF TRAITS
We will make a visual
model to predict how
Population B will change in
a cold environment.
You will be able to check
your predictions in the Sim
in a few minutes.
48. 1.4.3: MODELING TOOL
MODELING CHANGES TO THE DISTRIBUTION OF TRAITS
Turn to a partner and
discuss the following.
Do you think Population B
will respond differently than
Population A did to an
environment that changes
from warm to cold?
49. 1.4.3: MODELING TOOL
MODELING CHANGES TO THE DISTRIBUTION OF TRAITS
Complete your models
individually.
You do not have to make
perfect predictions, but you
should show your best
guess at what might happen
to this population by
shading in the bars for the
Population After 50
Generations Histogram.
50. 1.4.3: MODELING TOOL
MODELING CHANGES TO THE DISTRIBUTION OF TRAITS
Note: The predictions are
what you think will actually
happen in the subsequent
Simulation activity.
51. 1.4.3: MODELING TOOL
MODELING CHANGES TO THE DISTRIBUTION OF TRAITS
Models should only show fur
traits that were already present
in the population (Fur-Trait
Levels 1 or 2 only).
Two possible proficient models
are:
1. The population will die out,
and thus Histogram 2 would
be left blank.
2. The trait distribution will shift
so that ostrilopes with higher
fur levels became more
common (shown below).
Possible Prediction about Histogram 2
52. 1.4.4 TESTING PREDICTIONS IN THE SIM
Open Fur and Temperature B
mode in the Natural
Selection Simulation.
Press the Ostrilope icon and
point out the Fur-Trait Histogram
for the ostrilope population.
Note that it has the same
distribution of fur traits as the
Generation 1 Histogram from the
Modeling Tool activity.
53. 1.4.4 TESTING PREDICTIONS IN THE SIM
Open Fur and Temperature B
mode in the Natural
Selection Simulation.
Press the Ostrilope icon and
point out the Fur-Trait Histogram
for the ostrilope population.
Note that it has the same
distribution of fur traits as the
Generation 1 Histogram from the
Modeling Tool activity.
54. 1.4.4 TESTING PREDICTIONS IN THE SIM
Setting UpThe Sim activity.
• Set the temperature of the
environment to cold (Level 1)
and observe what happens over
50 generations.
• While running the Sim, you
should zoom into the
environment and observe several
individuals with different traits.
• When complete, press ANALYZE
to compare the Generation 50
Histogram with the Generation 1
Histogram.
55. 1.4.4 TESTING PREDICTIONS IN THE SIM
Setting UpThe Sim activity.
• Set the temperature of the
environment to cold (Level 1)
and observe what happens over
50 generations.
• While running the Sim, you
should zoom into the
environment and observe several
individuals with different traits.
• When complete, press ANALYZE
to compare the Generation 50
Histogram with the Generation 1
Histogram.
56. 1.4.4 TESTING PREDICTIONS IN THE SIM
Setting UpThe Sim activity.
• Set the temperature of the
environment to cold (Level 1)
and observe what happens over
50 generations.
• While running the Sim, you
should zoom into the
environment and observe several
individuals with different traits.
• When complete, press ANALYZE
to compare the Generation 50
Histogram with the Generation 1
Histogram.
58. 1.4.4 TESTING PREDICTIONS IN THE SIM
Discuss with a partner whether
your predictions are correct.
Did population B change the
way you had predicted?
Individuals cannot change traits mid-
life, so the population died out.
59. 1.4.4 TESTING PREDICTIONS IN THE SIM
Did Population B change in the
way you predicted? Why or why
not?
Population B died out because it did
not have high levels of fur that were
required for a cold environment.
61. 1.4.4 TESTING PREDICTIONS IN THE SIM
POPULATION A:
Individuals with high fur levels were
able to survive in the cold environment.
The individuals with low fur levels
shivered and died.
Since more individuals with high fur
levels survived, the high fur-level trait
became more common in Population A
over time, and the low fur-level trait
became less common.
The high fur-level trait was an adaptive
trait.
62. 1.4.4 TESTING PREDICTIONS IN THE SIM
POPULATION B:
In the second Sim, the distribution of
traits in Population B could not shift like
Population A did - toward more
individuals with high fur level.
This is because new traits cannot
appear in a population just because
they would be helpful for survival.
Since Population B did not start out
with variation that included individuals
with the adaptive trait of a high fur
level, none of the individuals could
survive.
63. 1.4.5 HOMEWORK
READ AND ANNOTATE THREE ARTICLES ABOUT DIFFERENT
ORGANISMS IN OREGON STATE PARK.
In order to help Dr. Alex Young and to apply your understanding of variation, traits, and
changes in trait distribution, you will be reading articles about different organisms living
in Oregon State Park.