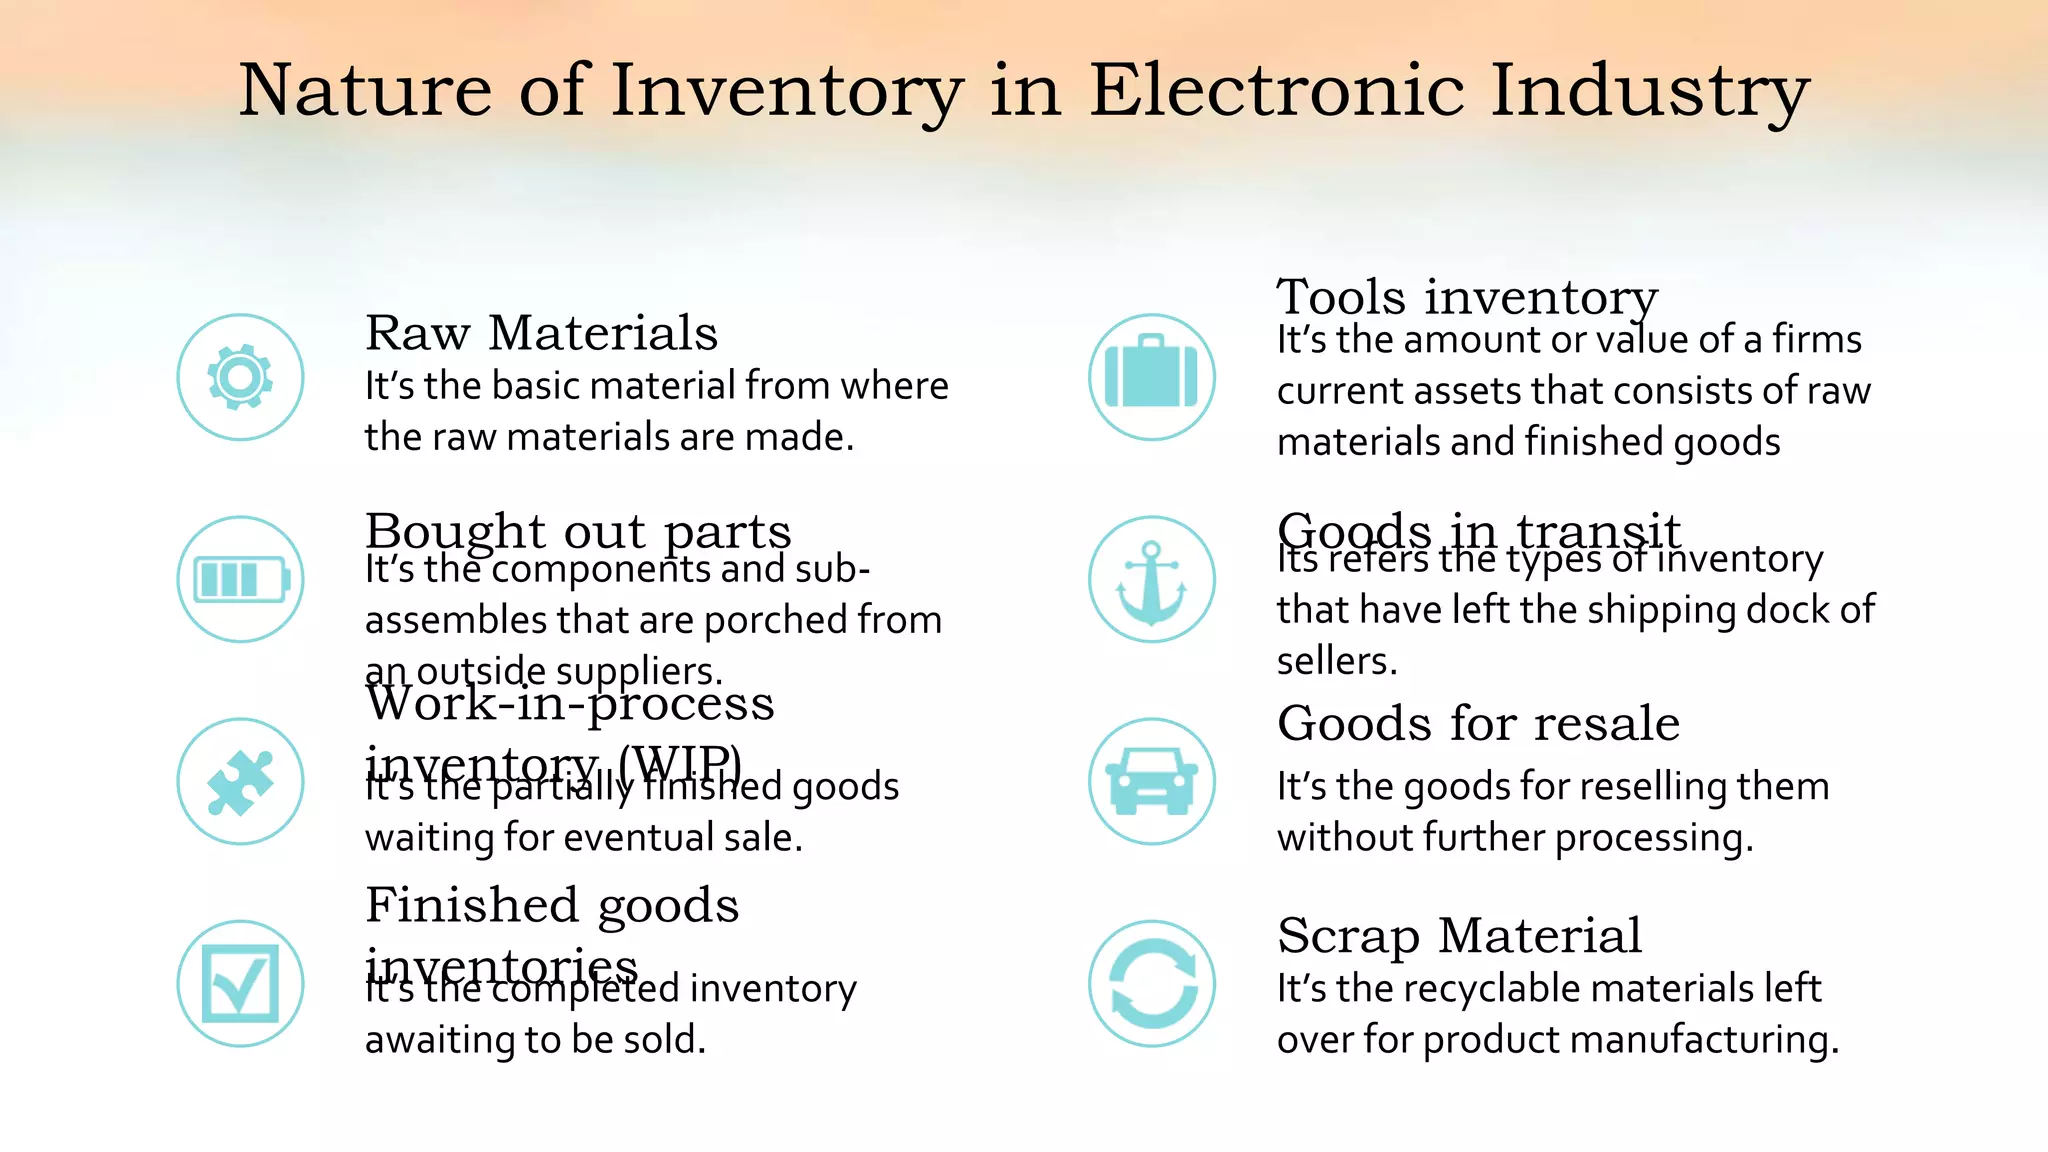
Inventory
Management
in
Electronic Industry
Group Members
Tasnim Ansari – 16221009
Mehedi Hassan Bappy – 16221021
Debanik Chakraborty – 16221025
Syed Ishtiak UddinAhmed -
16221031
Introducti
on
Inventory Management
Inventory management is the
supervision of non-capitalized
assets and stock items. It
supervise the flow of goods from
manufactures to warehouse and
from these facilities to point of
sale
Ordering Cost
Ordering costs are the expenses
incurred to create and process
an order to a supplier.These
costs are incurred in the
determination of the economic
order quantity for an inventory
item.
Carrying Cost
Carrying cost mainly
refers to the total cost
holding inventory. It
includes warehouse cost,
rents, utilities etc.
History of Electronic Industry
There were a few electrical companies in Bangladesh
before its independence in 1971. Soon after the
independence (1972-78) some courageous
entrepreneurs came forward to invest in the electrical
industry of Bangladesh
Boosted Sector
During 1978-86 this industry attracted another about
1000 investors in this sector. Currently there are about
2500 companies producing electrical goods in
Bangladesh.
Financially Developing
Currently this sector in producing about 15 thousand
crore taka of export substitute product against local
demand of 20 thousands crore taka per year.There are
about 2500 electrical enterprises producing 75 types of
electrical products in Bangladesh.
Company profile
(Electronic Industry)
Nature of Inventory in Electronic Industry
It’s the basic material from where
the raw materials are made.
Raw Materials
It’s the components and sub-
assembles that are porched from
an outside suppliers.
Bought out parts
It’s the partially finished goods
waiting for eventual sale.
Work-in-process
inventory (WIP)
It’s the completed inventory
awaiting to be sold.
Finished goods
inventories
It’s the amount or value of a firms
current assets that consists of raw
materials and finished goods
Tools inventory
Its refers the types of inventory
that have left the shipping dock of
sellers.
Goods in transit
It’s the goods for reselling them
without further processing.
Goods for resale
It’s the recyclable materials left
over for product manufacturing.
Scrap Material
EOQ Analysis
Two major cost
associated with
inventory
Ordering cost and
carrying cost
With the increase of
ordering size the
ordering
cost decreases but
carrying cost
increases
Economic Order
Quantity EOQ
The optimum level of
inventory at which the
total cost is
minimum is Economic
Order
Quantity
Calculation of Economic
Order Quantity
The formula for EOQ is:
𝑄 ∗= √
2( 𝐴𝑛𝑛𝑢𝑎𝑙 𝐷𝑒𝑚𝑎𝑛𝑑 × 𝑂𝑟𝑑𝑒𝑟𝑖𝑛𝑔 𝐶𝑜𝑠𝑡)
𝐶𝑎𝑟𝑟𝑦𝑖𝑛𝑔 𝐶𝑜𝑠𝑡
EOQ Analysis of
Components of
Washing Machine
Product: Driven Pulley
– NBO
Annual Demand: 240000
units
Ordering Cost: 1700 BDT
Carrying Cost: 36 BDT
𝑄 ∗= √
2( 𝐴𝑛𝑛𝑢𝑎𝑙 𝐷𝑒𝑚𝑎𝑛𝑑 × 𝑂𝑟𝑑𝑒𝑟𝑖𝑛𝑔 𝐶𝑜𝑠𝑡)
𝐶𝑎𝑟𝑟𝑦𝑖𝑛𝑔 𝐶𝑜𝑠𝑡
= √
2( 240000 × 1700)
36
= 3688 units
Components
Annual
Demand
Ordering
cost/order
Carrying
Cost/unit
EOQ
Order
Number
Actual
Ordering Size
1. Bearing - Ball Sealed –
6006
360000 12,200 2 66272 5 30,000
2. Bearing - Ball Sealed -
6205 - Swift
48,000 6,200 2 17251 3 3,000
3. Drive assly - NBO - China
(Agitator) - 2 pin drive
144000 1,700 36 3688 39 2,000
4. Drive assly - ECO Dlx -
NBO - China (Impeller)
96,000 1,700 36 3011 32 1,500
5. Driven Pulley – NBO 240000 1,700 36 4761 50 2,000
6. Wash timer - Eco Dlx
(Ningbo) - With buzzer (S60)
30,000 1,700 2 7141 4 5,500
7. Wash timer - Eco Dlx
(Ningbo) - Without buzzer
(SI 60)
42,000 1,700 2 8450 5 3,500
8. Heater (WW) 21,600 4,700 2 10076 2 4,800
9. Heater (Chandini) 9,600 6,200 2 7715 1 1800
10. Pig tail connector-3.0 360000 6,200 2 47244 8 30,000
11. Pig tail connector-3.8 180000 6,200 2 33407 5 15,000
0 20000 40000 60000 80000 100000 120000 140000
1
3
5
7
9
11
13
15
17
19
21
23
25
27
29
31 Comparison between EOQ and Actual Ordering Size
 EOQ
 Actual Ordering Size
Ordering Size is less than
EconomicOrder Quantity
Most of the Components are
imported which makes the
ordering cost very expensive
As such the company incurs
additional ordering cost which
thereby
increases the total cost and
decreases the overall
profitability of the company
Interpretation
ABC ANALYSIS
The inventory of an organization generally
consists of thousands of items with varying
prices, usage rate and lead time. It is neither
desirable nor possible to pay equal attention of
all items.
ABC analysis is a basic analytical tool which
enables management to concentrate its efforts
where results will be greater.The concept
applied to inventory is called as ABC analysis.
ABC
System
Analysis
ABC SYSTEM ANALYSIS
TYPES of ABC ANALYSIS
Which stands mid-way
between category A & C in
respect of demand and price
range.
Class B
With relatively small
investments but fairly large
number of items with low
price range.
Class C
Consisting of items with the large
investment and least amount of
demand with high price.
Class A
Types of ABC Analysis
Class A Class CClass B
₪ Tight control on stock
levels
₪ Low safety stock
₪ Ordered frequently
₪ Individual posting in
stores
₪ Weekly control reports
₪ Continuous effort to
 Moderate control on safety
stock
 Medium Safety stock
 Ordered Less Frequently
 Individual
 Monthly control reports
 Moderate efforts to reduce
lead time
‡ Less control on safety
stock
‡ Large Safety stock
‡ Bulk Ordering
‡ Collective Posting
‡ Quarterly control reports
‡ Minimum efforts to
reduce lead time
Step 1: Whirlpool washing machine’s raw material’s names, unit costs and
annual demands are taken for calculation of the ABC system of the company.
Items Annual Demand Unit cost
1. Bearing ball sealed 6006 200,000 8
2. Drive assly – NBO Agitator 144000 10
3. Water distribution Actuator 1800 2000
4. Heater 21600 2500
5. Pig tail connector 360000 5
6. Motor jeamo 150000 10
7. Heating element 1800 1800
8. Door lock 100000 10
9. Suspension spring 25200 70
10. Wash timer 30000 60
11. Splash motor 42000 1200
12. Pressostat 120000 10
13. Timer 200000 5
Items
Annual
Demand
Demand
Percentage Unit Cost
Total cost in
the year
Usage
percentage of
the cost
1. Bearing ball sealed 6006 200,000 12.93326 8 1600000 1.283656
2. Drive assly – NBO
Agitator 144000 9.31195 10 1440000 1.15529
3. Water distribution
Actuator 1800 0.116399 2000 3600000 2.888226
4. Heater 21600 1.396793 2500 54000000 43.32339
5. Pig tail connector 360000 23.27988 5 1800000 1.444113
6. Motor jeamo 150000 9.699948 10 1500000 1.203427
7. Heating element 1800 0.116399 1800 3240000 2.599403
8. Door lock 100000 6.466632 10 1000000 0.802285
9. Suspension spring 25200 1.629591 70 1764000 1.415231
10. Wash timer 30000 1.93999 60 1800000 1.444113
11. Splash motor 42000 2.715986 1200 50400000 40.43516
12. Pressostat 120000 7.759959 10 1200000 0.962742
13. Timer 200000 12.93326 5 1000000 0.802285
Step 2: Total cost per year is calculated by multiplying annual demand with unit
cost and the usage % of total cost is measured by dividing each item cost by
total cost per year.
Items Unit cost
Annual
demand
Demand
percenta
ge
Cumulati
ve
demand
percentag
e
Total cost
per year
Usage % of
total cost
Cumulativ
e % of
total usage
4 2500 21,600 1.39 1.39 54000000 43.32 43.32
11 1200 42,000 2.71 4.1 50400000 40.43 83.75
3 2000 1800 0.11 4.21 3600000 2.88 86.63
7 1800 1800 0.11 4.32 3240000 2.59 89.22
10 60 30000 1.93 6.25 1800000 1.44 90.66
5 5 360000 23.27 29.52 1800000 1.44 92.1
9 70 25200 1.62 31.14 1764000 1.41 93.51
1 8 200000 12.93 44.07 1600000 1.28 94.79
6 10 150000 9.69 53.76 1500000 1.2 95.99
2 10 144000 9.31 63.07 1440000 1.15 97.14
12 10 120000 7.75 70.82 1200000 0.96 98.1
8 10 100000 6.46 77.28 1000000 0.8 98.9
13 5 200000 12.93 90.21 1000000 0.8 99.7
Step 3: Data are arranged in descending order based on the usage
percentage of total cost.
Class Items % of item % of usage Action
Class A 4,11 4.1% 83.75% Close day to day
control
Class B 3, 7, 10, 5, 9, 1, 6. 49.66% 12.24% Regular review
Class C 2, 12, 8, 13, 14. 46.14% 3.95% Infrequent review
Step 4
This step calculation is based on the usage percentage.
 Items up to cumulative usage percentage 80% are under Class A
 Items up to cumulative usage percentage less than 15% from 80% are under Class
B.
 Items up to cumulative usage percentage less than 5% from the above Class B
margin are under Class C type.
Economic Lot Size
Quantity of material or units of a manufactured good that can be
produced within the lowest unit cost range is called economic lot
size.
EOQ is the optimum quantity of units for ordering goods from
suppliers & ESL is the optimum quantity of units while producing
goods in factory.
Economic Lot Size
The formula for Economic Lot Size is,
ELS= √
2∗𝐸𝑠𝑡𝑖𝑚𝑎𝑡𝑒𝑑 𝑃𝑟𝑜𝑑𝑢𝑐𝑡𝑖𝑜𝑛∗𝑆𝑒𝑡 𝑢𝑝 𝑐𝑜𝑠𝑡
𝐶𝑎𝑟𝑟𝑦𝑖𝑛𝑔 𝐶𝑜𝑠𝑡
= √
2𝐴𝑆
𝐶
Economic Lot Size Analysis
Manufacturing Industry
like Electronics
Used in Estimated Annual
Production
Set up Cost per
production Run
Carrying Cost per unit
Required
Information
Determining
The optimum production run
Aim
Incremental Analysis
An incremental analysis is a decision-making technique used in
business to determine the true cost difference between alternatives.
A change in the investment policy is desirable if the Incremental Rate
of return exceeds or equals to the required rate of return or r>=k
Practical Example
An electronic firm has annual sales of 750 crore taka last year,
450 crore taka Gross Profit, 300 Crore taka of COGS & Finished
goods of 600 lakh at hand. Their Working capital requirement
is about 30% of sales. The Required rate of return of the
company is 6%.
They have 5 additional investment policies available at hand,
they want to do incremental analysis, to determine the
optimum investment policy or up to which policy they can
extend their inventories. The carriage cost will be 6% of the
inventory level.
Inventory Policy List
Inventory
Policy Option
Inventory
Level (in Lakh
Taka)
Lost Sales (in
Lakh Taka)
Carrying Cost
(Taka in lakh)
Current 650 850 36
A 750 550 45
B 1050 350 63
C 1350 200 81
D 1500 140 90
E 1600 110 96
Step 1: Incremental Operating Profit
Change
in
Inventor
y Policy
∆ Sales
(in Lakh
Taka)
∆ Contri
(in Lakh
Taka)
∆ Cost
(in Lakh
Taka)
∆ OPBT
(in Lakh
Taka)
∆ OPAT
(in Lakh
Taka)
Current
to A
300 120 9 111 55.5
A to B 200 80 18 62 31
B to C 150 60 18 42 21
C to D 60 24 9 15 7.5
D to E 30 12 6 6 3
850-
550
300*40
%
45-36 120-9
Step 2: Incremental Investment
Change in
Inventory
Policy
∆Inventory
(in Lakh
Taka)
∆ NWC(in
Lakh Taka)
∆Investmen
t(in Lakh
Taka)
Cumulative
Investment(
in Lakh
Taka)
Current
to A
100 90 190 190
A to B 300 60 360 550
B to C 300 45 345 895
C to D 150 18 168 1063
750-650 300*30% 100+90
Step 3: Return on Investment
Change in Inventory
Policy
Before tax Expected
Rate of Return
After Tax Expected
Rate of Return
Current to A 58.42% 29.21%
A to B 17.22% 8.61%
B to C 12.17% 6.09% (Optimum)
C to D 8.93% 4.46%
D to E 5.50% 2.75%
111-190 55.5-190
The Explanation
29.21
8.61
6.09 (Optimum)l
4.46
2.75
0
5
10
15
20
25
30
35
0 200 400 600 800 1000 1200 1400
IncrementalRateofReturn
Cumulative Investment
Y-Values
Thank you

Inventory Management of Electronic Industry

  • 1.
  • 2.
    Group Members Tasnim Ansari– 16221009 Mehedi Hassan Bappy – 16221021 Debanik Chakraborty – 16221025 Syed Ishtiak UddinAhmed - 16221031
  • 3.
  • 4.
    Inventory Management Inventory managementis the supervision of non-capitalized assets and stock items. It supervise the flow of goods from manufactures to warehouse and from these facilities to point of sale
  • 5.
    Ordering Cost Ordering costsare the expenses incurred to create and process an order to a supplier.These costs are incurred in the determination of the economic order quantity for an inventory item.
  • 6.
    Carrying Cost Carrying costmainly refers to the total cost holding inventory. It includes warehouse cost, rents, utilities etc.
  • 7.
    History of ElectronicIndustry There were a few electrical companies in Bangladesh before its independence in 1971. Soon after the independence (1972-78) some courageous entrepreneurs came forward to invest in the electrical industry of Bangladesh Boosted Sector During 1978-86 this industry attracted another about 1000 investors in this sector. Currently there are about 2500 companies producing electrical goods in Bangladesh. Financially Developing Currently this sector in producing about 15 thousand crore taka of export substitute product against local demand of 20 thousands crore taka per year.There are about 2500 electrical enterprises producing 75 types of electrical products in Bangladesh. Company profile (Electronic Industry)
  • 8.
    Nature of Inventoryin Electronic Industry It’s the basic material from where the raw materials are made. Raw Materials It’s the components and sub- assembles that are porched from an outside suppliers. Bought out parts It’s the partially finished goods waiting for eventual sale. Work-in-process inventory (WIP) It’s the completed inventory awaiting to be sold. Finished goods inventories It’s the amount or value of a firms current assets that consists of raw materials and finished goods Tools inventory Its refers the types of inventory that have left the shipping dock of sellers. Goods in transit It’s the goods for reselling them without further processing. Goods for resale It’s the recyclable materials left over for product manufacturing. Scrap Material
  • 9.
  • 10.
    Two major cost associatedwith inventory Ordering cost and carrying cost With the increase of ordering size the ordering cost decreases but carrying cost increases Economic Order Quantity EOQ The optimum level of inventory at which the total cost is minimum is Economic Order Quantity
  • 12.
    Calculation of Economic OrderQuantity The formula for EOQ is: 𝑄 ∗= √ 2( 𝐴𝑛𝑛𝑢𝑎𝑙 𝐷𝑒𝑚𝑎𝑛𝑑 × 𝑂𝑟𝑑𝑒𝑟𝑖𝑛𝑔 𝐶𝑜𝑠𝑡) 𝐶𝑎𝑟𝑟𝑦𝑖𝑛𝑔 𝐶𝑜𝑠𝑡
  • 13.
    EOQ Analysis of Componentsof Washing Machine Product: Driven Pulley – NBO Annual Demand: 240000 units Ordering Cost: 1700 BDT Carrying Cost: 36 BDT 𝑄 ∗= √ 2( 𝐴𝑛𝑛𝑢𝑎𝑙 𝐷𝑒𝑚𝑎𝑛𝑑 × 𝑂𝑟𝑑𝑒𝑟𝑖𝑛𝑔 𝐶𝑜𝑠𝑡) 𝐶𝑎𝑟𝑟𝑦𝑖𝑛𝑔 𝐶𝑜𝑠𝑡 = √ 2( 240000 × 1700) 36 = 3688 units
  • 14.
    Components Annual Demand Ordering cost/order Carrying Cost/unit EOQ Order Number Actual Ordering Size 1. Bearing- Ball Sealed – 6006 360000 12,200 2 66272 5 30,000 2. Bearing - Ball Sealed - 6205 - Swift 48,000 6,200 2 17251 3 3,000 3. Drive assly - NBO - China (Agitator) - 2 pin drive 144000 1,700 36 3688 39 2,000 4. Drive assly - ECO Dlx - NBO - China (Impeller) 96,000 1,700 36 3011 32 1,500 5. Driven Pulley – NBO 240000 1,700 36 4761 50 2,000 6. Wash timer - Eco Dlx (Ningbo) - With buzzer (S60) 30,000 1,700 2 7141 4 5,500 7. Wash timer - Eco Dlx (Ningbo) - Without buzzer (SI 60) 42,000 1,700 2 8450 5 3,500 8. Heater (WW) 21,600 4,700 2 10076 2 4,800 9. Heater (Chandini) 9,600 6,200 2 7715 1 1800 10. Pig tail connector-3.0 360000 6,200 2 47244 8 30,000 11. Pig tail connector-3.8 180000 6,200 2 33407 5 15,000
  • 15.
    0 20000 4000060000 80000 100000 120000 140000 1 3 5 7 9 11 13 15 17 19 21 23 25 27 29 31 Comparison between EOQ and Actual Ordering Size  EOQ  Actual Ordering Size
  • 16.
    Ordering Size isless than EconomicOrder Quantity Most of the Components are imported which makes the ordering cost very expensive As such the company incurs additional ordering cost which thereby increases the total cost and decreases the overall profitability of the company Interpretation
  • 17.
  • 18.
    The inventory ofan organization generally consists of thousands of items with varying prices, usage rate and lead time. It is neither desirable nor possible to pay equal attention of all items. ABC analysis is a basic analytical tool which enables management to concentrate its efforts where results will be greater.The concept applied to inventory is called as ABC analysis. ABC System Analysis
  • 19.
    ABC SYSTEM ANALYSIS TYPESof ABC ANALYSIS Which stands mid-way between category A & C in respect of demand and price range. Class B With relatively small investments but fairly large number of items with low price range. Class C Consisting of items with the large investment and least amount of demand with high price. Class A
  • 20.
    Types of ABCAnalysis Class A Class CClass B ₪ Tight control on stock levels ₪ Low safety stock ₪ Ordered frequently ₪ Individual posting in stores ₪ Weekly control reports ₪ Continuous effort to  Moderate control on safety stock  Medium Safety stock  Ordered Less Frequently  Individual  Monthly control reports  Moderate efforts to reduce lead time ‡ Less control on safety stock ‡ Large Safety stock ‡ Bulk Ordering ‡ Collective Posting ‡ Quarterly control reports ‡ Minimum efforts to reduce lead time
  • 21.
    Step 1: Whirlpoolwashing machine’s raw material’s names, unit costs and annual demands are taken for calculation of the ABC system of the company. Items Annual Demand Unit cost 1. Bearing ball sealed 6006 200,000 8 2. Drive assly – NBO Agitator 144000 10 3. Water distribution Actuator 1800 2000 4. Heater 21600 2500 5. Pig tail connector 360000 5 6. Motor jeamo 150000 10 7. Heating element 1800 1800 8. Door lock 100000 10 9. Suspension spring 25200 70 10. Wash timer 30000 60 11. Splash motor 42000 1200 12. Pressostat 120000 10 13. Timer 200000 5
  • 22.
    Items Annual Demand Demand Percentage Unit Cost Totalcost in the year Usage percentage of the cost 1. Bearing ball sealed 6006 200,000 12.93326 8 1600000 1.283656 2. Drive assly – NBO Agitator 144000 9.31195 10 1440000 1.15529 3. Water distribution Actuator 1800 0.116399 2000 3600000 2.888226 4. Heater 21600 1.396793 2500 54000000 43.32339 5. Pig tail connector 360000 23.27988 5 1800000 1.444113 6. Motor jeamo 150000 9.699948 10 1500000 1.203427 7. Heating element 1800 0.116399 1800 3240000 2.599403 8. Door lock 100000 6.466632 10 1000000 0.802285 9. Suspension spring 25200 1.629591 70 1764000 1.415231 10. Wash timer 30000 1.93999 60 1800000 1.444113 11. Splash motor 42000 2.715986 1200 50400000 40.43516 12. Pressostat 120000 7.759959 10 1200000 0.962742 13. Timer 200000 12.93326 5 1000000 0.802285 Step 2: Total cost per year is calculated by multiplying annual demand with unit cost and the usage % of total cost is measured by dividing each item cost by total cost per year.
  • 23.
    Items Unit cost Annual demand Demand percenta ge Cumulati ve demand percentag e Totalcost per year Usage % of total cost Cumulativ e % of total usage 4 2500 21,600 1.39 1.39 54000000 43.32 43.32 11 1200 42,000 2.71 4.1 50400000 40.43 83.75 3 2000 1800 0.11 4.21 3600000 2.88 86.63 7 1800 1800 0.11 4.32 3240000 2.59 89.22 10 60 30000 1.93 6.25 1800000 1.44 90.66 5 5 360000 23.27 29.52 1800000 1.44 92.1 9 70 25200 1.62 31.14 1764000 1.41 93.51 1 8 200000 12.93 44.07 1600000 1.28 94.79 6 10 150000 9.69 53.76 1500000 1.2 95.99 2 10 144000 9.31 63.07 1440000 1.15 97.14 12 10 120000 7.75 70.82 1200000 0.96 98.1 8 10 100000 6.46 77.28 1000000 0.8 98.9 13 5 200000 12.93 90.21 1000000 0.8 99.7 Step 3: Data are arranged in descending order based on the usage percentage of total cost.
  • 24.
    Class Items %of item % of usage Action Class A 4,11 4.1% 83.75% Close day to day control Class B 3, 7, 10, 5, 9, 1, 6. 49.66% 12.24% Regular review Class C 2, 12, 8, 13, 14. 46.14% 3.95% Infrequent review Step 4 This step calculation is based on the usage percentage.  Items up to cumulative usage percentage 80% are under Class A  Items up to cumulative usage percentage less than 15% from 80% are under Class B.  Items up to cumulative usage percentage less than 5% from the above Class B margin are under Class C type.
  • 25.
    Economic Lot Size Quantityof material or units of a manufactured good that can be produced within the lowest unit cost range is called economic lot size. EOQ is the optimum quantity of units for ordering goods from suppliers & ESL is the optimum quantity of units while producing goods in factory.
  • 26.
    Economic Lot Size Theformula for Economic Lot Size is, ELS= √ 2∗𝐸𝑠𝑡𝑖𝑚𝑎𝑡𝑒𝑑 𝑃𝑟𝑜𝑑𝑢𝑐𝑡𝑖𝑜𝑛∗𝑆𝑒𝑡 𝑢𝑝 𝑐𝑜𝑠𝑡 𝐶𝑎𝑟𝑟𝑦𝑖𝑛𝑔 𝐶𝑜𝑠𝑡 = √ 2𝐴𝑆 𝐶
  • 27.
    Economic Lot SizeAnalysis Manufacturing Industry like Electronics Used in Estimated Annual Production Set up Cost per production Run Carrying Cost per unit Required Information Determining The optimum production run Aim
  • 28.
    Incremental Analysis An incrementalanalysis is a decision-making technique used in business to determine the true cost difference between alternatives. A change in the investment policy is desirable if the Incremental Rate of return exceeds or equals to the required rate of return or r>=k
  • 29.
    Practical Example An electronicfirm has annual sales of 750 crore taka last year, 450 crore taka Gross Profit, 300 Crore taka of COGS & Finished goods of 600 lakh at hand. Their Working capital requirement is about 30% of sales. The Required rate of return of the company is 6%. They have 5 additional investment policies available at hand, they want to do incremental analysis, to determine the optimum investment policy or up to which policy they can extend their inventories. The carriage cost will be 6% of the inventory level.
  • 30.
    Inventory Policy List Inventory PolicyOption Inventory Level (in Lakh Taka) Lost Sales (in Lakh Taka) Carrying Cost (Taka in lakh) Current 650 850 36 A 750 550 45 B 1050 350 63 C 1350 200 81 D 1500 140 90 E 1600 110 96
  • 31.
    Step 1: IncrementalOperating Profit Change in Inventor y Policy ∆ Sales (in Lakh Taka) ∆ Contri (in Lakh Taka) ∆ Cost (in Lakh Taka) ∆ OPBT (in Lakh Taka) ∆ OPAT (in Lakh Taka) Current to A 300 120 9 111 55.5 A to B 200 80 18 62 31 B to C 150 60 18 42 21 C to D 60 24 9 15 7.5 D to E 30 12 6 6 3 850- 550 300*40 % 45-36 120-9
  • 32.
    Step 2: IncrementalInvestment Change in Inventory Policy ∆Inventory (in Lakh Taka) ∆ NWC(in Lakh Taka) ∆Investmen t(in Lakh Taka) Cumulative Investment( in Lakh Taka) Current to A 100 90 190 190 A to B 300 60 360 550 B to C 300 45 345 895 C to D 150 18 168 1063 750-650 300*30% 100+90
  • 33.
    Step 3: Returnon Investment Change in Inventory Policy Before tax Expected Rate of Return After Tax Expected Rate of Return Current to A 58.42% 29.21% A to B 17.22% 8.61% B to C 12.17% 6.09% (Optimum) C to D 8.93% 4.46% D to E 5.50% 2.75% 111-190 55.5-190
  • 34.
    The Explanation 29.21 8.61 6.09 (Optimum)l 4.46 2.75 0 5 10 15 20 25 30 35 0200 400 600 800 1000 1200 1400 IncrementalRateofReturn Cumulative Investment Y-Values
  • 35.

Editor's Notes

  • #6 For example , cost of labor required to inspect goods when they are received.
  • #7 For example , cost of labor required to inspect goods when they are received.