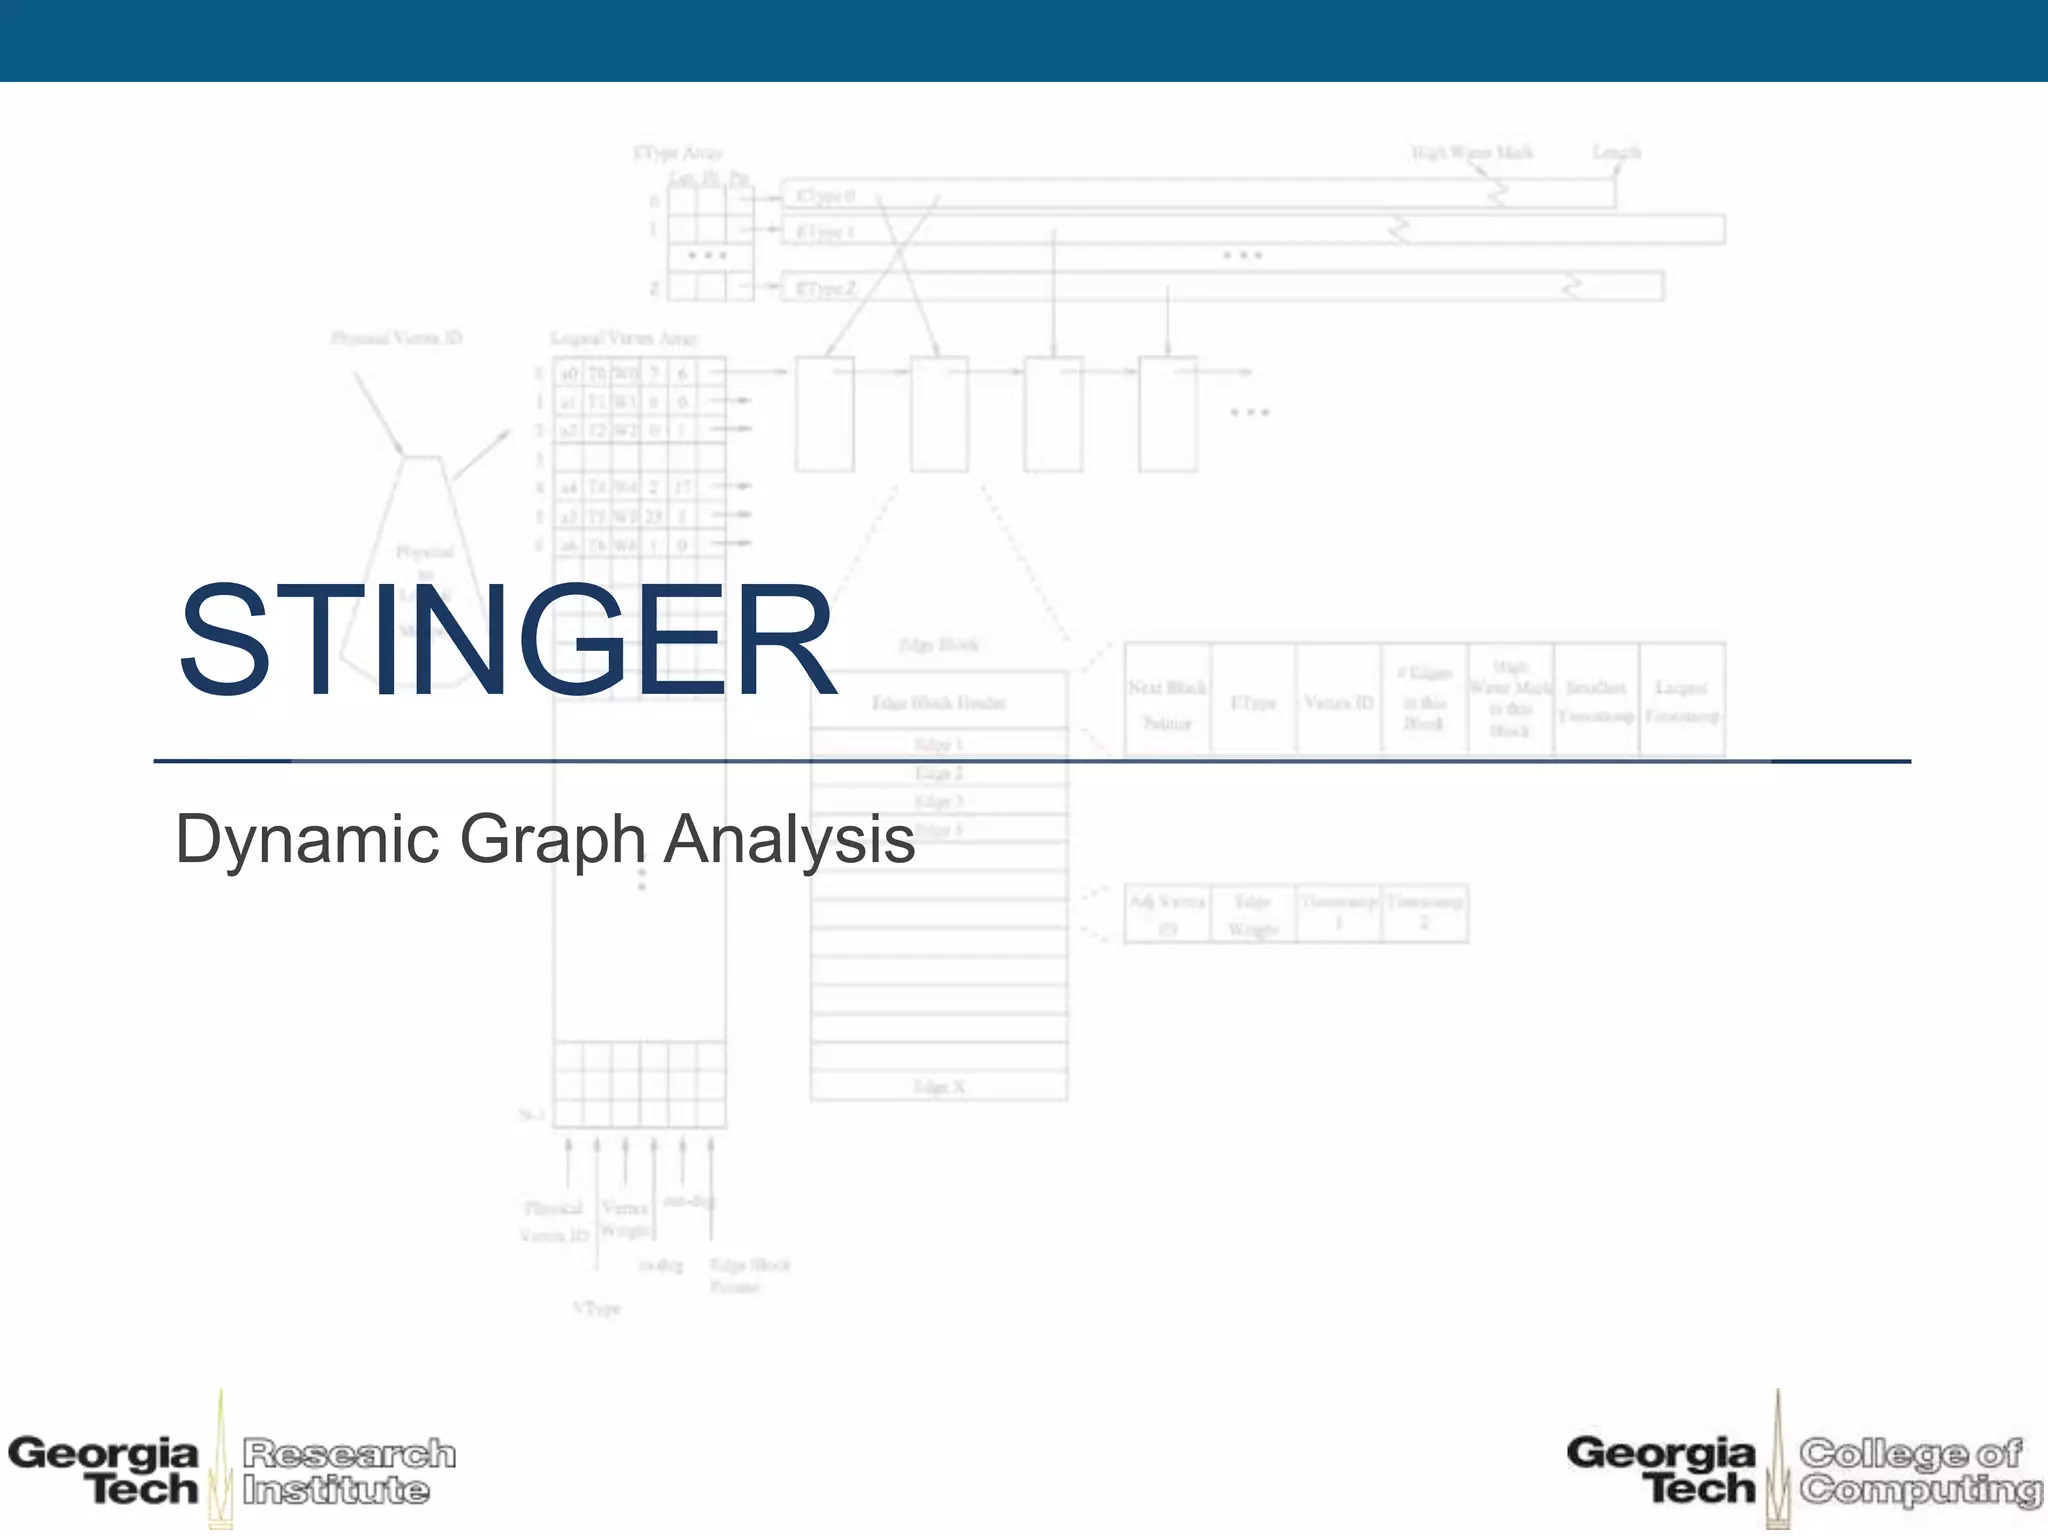
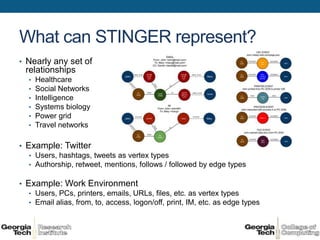
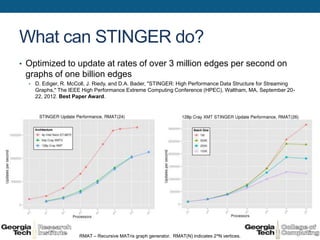
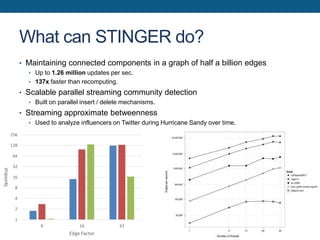
STINGER
Dynamic Graph Analysis
Contributors
• David Bader
• David Ediger
• Rob McColl
• Jason Riedy
• Kamesh Madduri
• Jason Poovey
Outline
• Motivation


• Dynamic Graph Basics


• What is STINGER?


• What can STINGER do?


• Why STINGER?
Big Data problems need Graph Analysis
    Health Care      • Finding outbreaks, population epidemiology


   Social Networks   • Advertising, searching, grouping, influence


     Intelligence    • Decisions at scale, regulating algorithms


  Systems Biology    • Understanding interactions, drug design


     Power Grid      • Disruptions, conversion


     Simulation      • Discrete events, cracking meshes
Graphs are pervasive
 • Graphs: things and relationships
    • Different kinds of things, different kinds of relationships, but graphs provide a
      framework for analyzing the relationships.
    • New challenges for analysis: data sizes, heterogeneity, uncertainty, data quality.


         Astrophysics                     Bioinformatics                  Social Informatics
Problem: Outlier detection       Problem:                           Problem: Emergent behavior,
Challenges: Massive data         Identifying target proteins        information spread
sets, temporal variation         Challenges:                        Challenges: New analysis,
Graph Problems: matching,        Data heterogeneity, quality        data uncertainty, scale
clustering                       Graph Problems:                    Graph Problems: clustering,
                                 Centrality, clustering             flows, shortest paths
Data rates and volumes are immense
• Facebook:
  • ~1 billion users
  • average 130 friends
  • 30 billion pieces of content shared / month
• Twitter:
   • 500 million active users
   • 340 million tweets / day
• Internet – 100s of exabytes / year
   • 300 million new websites per year
   • 48 hours of video to You Tube per minute
   • 30,000 YouTube videos played per second
Our focus is streaming graphs
• As relationships change
  • Edges (relationships) are inserted, updated, and removed
  • New vertices (things) join and leave the network


• What are the effects?
  • On information flow
  • On community structure
                                                z       x      y
  • On the integrity of data and structure


• Which actors and relationships are…
  • The key players and influencers in the change?
  • The anomalies and threats?
What is STINGER?
Spatio-Temporal Interaction Networks and Graphs Extensible Representation
D. A. Bader, J. Berry, A. Amos-Binks, D. Chavarr´ıa-Miranda, C. Hastings, K. Madduri, S. C. Poulos


• A scalable, high performance in-memory dynamic graph data
  structure
   •   Stores semantic and temporal information.
   •   Designed to be flexible and extendable.
   •   Be useful for the entire “large graph” community.
   •   Permit good performance: No single structure is optimal for all.
   •   Assume globally addressable memory access.
   •   Support multiple, parallel readers and a single parallel writer.

• A software suite for dynamic graph analysis
  • Targets large shared-memory x86 and the Cray XMT
  • Written in C with OpenMP and XMT pragma support for parallelism
As a data structure
• Fast insertions, deletions, and updates:
 A data structure that grows and changes at the speed of the data.

• Edge and vertex types and weights:
 Represent complex relationships and multiple simultaneous networks.

• Filtering traversal mechanisms:
 Traverse serially or in parallel on specific edge types, time ranges,
 vertex sets, etc.

• Experimental workflow server:
 Multiple data streams and analytics with one persistent data structure.

• Experimental Java and Python bindings:
 Use efficiency-oriented languages without sacrificing performance-
 oriented results.
As an analysis package
• Streaming edge insertions and deletions:
  Performs new edge insertions, updates, and deletions in batches or individually.

• Streaming clustering coefficients:
  Tracks the local and global clustering coefficients of a graph under both edge insertions and deletions.

• Streaming connected components:
  Accurately tracks the connected components of a graph with insertions and deletions.

• Streaming community detection:
  Track and update the community structures within the graph as they change.

• Parallel agglomerative clustering:
  Find clusters that are optimized for a user-defined edge scoring function.

• Streaming Betweenness Centrality:
  Find the key points within information flows and structural vulnerabilities.

• K-core Extraction:
  Extract additional communities and filter noisy high-degree vertices.

• Classic breadth-first search:
  Performs a parallel breadth-first search of the graph starting at a given source vertex to find shortest paths.
How is the graph stored?
What can STINGER represent?
• Nearly any set of
  relationships
   •   Healthcare
   •   Social Networks
   •   Intelligence
   •   Systems biology
   •   Power grid
   •   Travel networks

• Example: Twitter
   • Users, hashtags, tweets as vertex types
   • Authorship, retweet, mentions, follows / followed by edge types


• Example: Work Environment
   • Users, PCs, printers, emails, URLs, files, etc. as vertex types
   • Email alias, from, to, access, logon/off, print, IM, etc. as edge types
What can STINGER do?
• Optimized to update at rates of over 3 million edges per second on
 graphs of one billion edges
  •   D. Ediger, R. McColl, J. Riedy, and D.A. Bader, "STINGER: High Performance Data Structure for Streaming
      Graphs,'' The IEEE High Performance Extreme Computing Conference (HPEC), Waltham, MA, September 20-
      22, 2012. Best Paper Award.


                       RMAT – Recursive MATrix graph generator. RMAT(N) indicates 2^N vertices.
What can STINGER do?
• Maintaining connected components in a graph of half a billion edges
  • Up to 1.26 million updates per sec.
  • 137x faster than recomputing.

• Scalable parallel streaming community detection
  • Built on parallel insert / delete mechanisms.

• Streaming approximate betweenness
  • Used to analyze influencers on Twitter during Hurricane Sandy over time.
What does STINGER not do?
• Does not provide all ACID properties
   • Why: Not intended to be the backing data store.
   • Why: Allows for greater ingest and processing speeds.
   • Alternative: Back STINGER ingest with an ACID DB
   • Alternative: STINGER does provide consistency, partial isolation


• No text base query language – for now
   • Why: Currently, no language is general enough to describe most or all queries
   • Alternative: Filtering traversal APIs, unlimited query flexibility through code
   • Alternative: Productivity language bindings (Python, Java)


• No distributed / Hadoop-like cluster support
   • Why: Good fit for ingest, but poor for streaming analysis, random access is too slow
   • Alternative: Larger shared memory systems such as the Cray XMT and SGI UV systems
   • Alternative: Processing billion-edge graphs in shared memory on affordable Intel servers
   • Alternative: Extract key portions of the graph from a larger data store and perform fast in-
     memory processing in STINGER
What sizes, performance can it handle?
                                                                  Server 4x Opteron 6282 256GB DDR3
    Desktop (Intel Core i7-2600 16GB DDR3)                                                     Connected      Updates
                                                            V      E      Config Size (GB)
                                 Connected      Updates                                      Components (s)   per Sec.
V      E    Config Size (GB)
                               Components (s)   per Sec.
                                                           16M 512M       25-14    60GB           13.7         696K
1M    8M    22-14    1.184         0.316         2.7M
                                                           16M 256M       25-14    24.6GB         9.82         2.1M
2M    16M   22-14    2.384          0.75         2.3M
4M    33M   22-14    4.768           2           2.3M           Cray XMT2 – 64 Processors 2TB DDR2
8M    67M   24-14    9.536          5.36         0.85M                                         Connected      Updates
                                                            V       E     Config Size (GB)
                                                                                             Components (s)   per Sec.
4M    67M   24-14    7.984           3           1.38M
                                                           67M    512M     28-32    86GB          13.8         3.3M
4M   134M   24-14    14.336         5.7          0.8M
                                                           268M    4.3B    28-32   312GB          52.3         2.34M


                        • The only limitation on size is system memory
                            • Billions of vertices and edges are possible

                        • V vertices and E edges in each graph
                             • E counts are undirected
                             • STINGER stores both directions
                        • Config is STINGER-specific parameters
Why not existing technologies?
• Traditional SQL databases
   • Not structured to do any meaningful graph queries with any level of
     efficiency or timeliness

• Graph databases - mostly on-disk
  • Distributed disk can keep up with storing / indexing, but is simply too
    slow at random graph access to process on as the graph updates

• Hadoop and HDFS-based projects
  • Not really the right programming model for many structural queries
    over the entire graph, random access performance is poor

• Smaller graph libraries, processing tools
  • Can't scale, can't process dynamic graphs, frequently leads to
    impossible visualization attempts
Who is GTRI?
• Georgia Tech Research Institute
  • Largest research entity at Georgia Institute of Technology
  • One of the world's premier university-based applied R&D
    organizations for 75 years
  • Non-profit with over 1,600 employees and 21 locations world-wide
  • Over $240 million per year of government and industry contracts


• Innovative Computing Division
 of the Cyber Technology and Information Security Lab
  • Dedicated to the application of practical HPC expertise and
    cutting-edge fundamental research to solve real-world problems
  • Experts in high-performance computing, algorithms, and big data
How can I start using STINGER?
• Information, code, help
   • http://cc.gatech.edu/stinger
   • robert.mccoll@gtri.gatech.edu


• Together, GTRI and Georgia Tech can offer
   • Consulting
     Understand how your organization can benefit from graph analytics.

  • Training
    Learn how to use graph analysis and apply STINGER to your data.

  • Implementation
    Customize and extend STINGER to suit your needs using our experts.

  • Research Expertise
    Connect with researchers on the cutting edge of big data to develop novel
    solutions to your open problems.

Introduction to STINGER

  • 1.
  • 2.
    Contributors • David Bader •David Ediger • Rob McColl • Jason Riedy • Kamesh Madduri • Jason Poovey
  • 3.
    Outline • Motivation • DynamicGraph Basics • What is STINGER? • What can STINGER do? • Why STINGER?
  • 4.
    Big Data problemsneed Graph Analysis Health Care • Finding outbreaks, population epidemiology Social Networks • Advertising, searching, grouping, influence Intelligence • Decisions at scale, regulating algorithms Systems Biology • Understanding interactions, drug design Power Grid • Disruptions, conversion Simulation • Discrete events, cracking meshes
  • 5.
    Graphs are pervasive • Graphs: things and relationships • Different kinds of things, different kinds of relationships, but graphs provide a framework for analyzing the relationships. • New challenges for analysis: data sizes, heterogeneity, uncertainty, data quality. Astrophysics Bioinformatics Social Informatics Problem: Outlier detection Problem: Problem: Emergent behavior, Challenges: Massive data Identifying target proteins information spread sets, temporal variation Challenges: Challenges: New analysis, Graph Problems: matching, Data heterogeneity, quality data uncertainty, scale clustering Graph Problems: Graph Problems: clustering, Centrality, clustering flows, shortest paths
  • 6.
    Data rates andvolumes are immense • Facebook: • ~1 billion users • average 130 friends • 30 billion pieces of content shared / month • Twitter: • 500 million active users • 340 million tweets / day • Internet – 100s of exabytes / year • 300 million new websites per year • 48 hours of video to You Tube per minute • 30,000 YouTube videos played per second
  • 7.
    Our focus isstreaming graphs • As relationships change • Edges (relationships) are inserted, updated, and removed • New vertices (things) join and leave the network • What are the effects? • On information flow • On community structure z x y • On the integrity of data and structure • Which actors and relationships are… • The key players and influencers in the change? • The anomalies and threats?
  • 8.
    What is STINGER? Spatio-TemporalInteraction Networks and Graphs Extensible Representation D. A. Bader, J. Berry, A. Amos-Binks, D. Chavarr´ıa-Miranda, C. Hastings, K. Madduri, S. C. Poulos • A scalable, high performance in-memory dynamic graph data structure • Stores semantic and temporal information. • Designed to be flexible and extendable. • Be useful for the entire “large graph” community. • Permit good performance: No single structure is optimal for all. • Assume globally addressable memory access. • Support multiple, parallel readers and a single parallel writer. • A software suite for dynamic graph analysis • Targets large shared-memory x86 and the Cray XMT • Written in C with OpenMP and XMT pragma support for parallelism
  • 9.
    As a datastructure • Fast insertions, deletions, and updates: A data structure that grows and changes at the speed of the data. • Edge and vertex types and weights: Represent complex relationships and multiple simultaneous networks. • Filtering traversal mechanisms: Traverse serially or in parallel on specific edge types, time ranges, vertex sets, etc. • Experimental workflow server: Multiple data streams and analytics with one persistent data structure. • Experimental Java and Python bindings: Use efficiency-oriented languages without sacrificing performance- oriented results.
  • 10.
    As an analysispackage • Streaming edge insertions and deletions: Performs new edge insertions, updates, and deletions in batches or individually. • Streaming clustering coefficients: Tracks the local and global clustering coefficients of a graph under both edge insertions and deletions. • Streaming connected components: Accurately tracks the connected components of a graph with insertions and deletions. • Streaming community detection: Track and update the community structures within the graph as they change. • Parallel agglomerative clustering: Find clusters that are optimized for a user-defined edge scoring function. • Streaming Betweenness Centrality: Find the key points within information flows and structural vulnerabilities. • K-core Extraction: Extract additional communities and filter noisy high-degree vertices. • Classic breadth-first search: Performs a parallel breadth-first search of the graph starting at a given source vertex to find shortest paths.
  • 11.
    How is thegraph stored?
  • 12.
    What can STINGERrepresent? • Nearly any set of relationships • Healthcare • Social Networks • Intelligence • Systems biology • Power grid • Travel networks • Example: Twitter • Users, hashtags, tweets as vertex types • Authorship, retweet, mentions, follows / followed by edge types • Example: Work Environment • Users, PCs, printers, emails, URLs, files, etc. as vertex types • Email alias, from, to, access, logon/off, print, IM, etc. as edge types
  • 13.
    What can STINGERdo? • Optimized to update at rates of over 3 million edges per second on graphs of one billion edges • D. Ediger, R. McColl, J. Riedy, and D.A. Bader, "STINGER: High Performance Data Structure for Streaming Graphs,'' The IEEE High Performance Extreme Computing Conference (HPEC), Waltham, MA, September 20- 22, 2012. Best Paper Award. RMAT – Recursive MATrix graph generator. RMAT(N) indicates 2^N vertices.
  • 14.
    What can STINGERdo? • Maintaining connected components in a graph of half a billion edges • Up to 1.26 million updates per sec. • 137x faster than recomputing. • Scalable parallel streaming community detection • Built on parallel insert / delete mechanisms. • Streaming approximate betweenness • Used to analyze influencers on Twitter during Hurricane Sandy over time.
  • 15.
    What does STINGERnot do? • Does not provide all ACID properties • Why: Not intended to be the backing data store. • Why: Allows for greater ingest and processing speeds. • Alternative: Back STINGER ingest with an ACID DB • Alternative: STINGER does provide consistency, partial isolation • No text base query language – for now • Why: Currently, no language is general enough to describe most or all queries • Alternative: Filtering traversal APIs, unlimited query flexibility through code • Alternative: Productivity language bindings (Python, Java) • No distributed / Hadoop-like cluster support • Why: Good fit for ingest, but poor for streaming analysis, random access is too slow • Alternative: Larger shared memory systems such as the Cray XMT and SGI UV systems • Alternative: Processing billion-edge graphs in shared memory on affordable Intel servers • Alternative: Extract key portions of the graph from a larger data store and perform fast in- memory processing in STINGER
  • 16.
    What sizes, performancecan it handle? Server 4x Opteron 6282 256GB DDR3 Desktop (Intel Core i7-2600 16GB DDR3) Connected Updates V E Config Size (GB) Connected Updates Components (s) per Sec. V E Config Size (GB) Components (s) per Sec. 16M 512M 25-14 60GB 13.7 696K 1M 8M 22-14 1.184 0.316 2.7M 16M 256M 25-14 24.6GB 9.82 2.1M 2M 16M 22-14 2.384 0.75 2.3M 4M 33M 22-14 4.768 2 2.3M Cray XMT2 – 64 Processors 2TB DDR2 8M 67M 24-14 9.536 5.36 0.85M Connected Updates V E Config Size (GB) Components (s) per Sec. 4M 67M 24-14 7.984 3 1.38M 67M 512M 28-32 86GB 13.8 3.3M 4M 134M 24-14 14.336 5.7 0.8M 268M 4.3B 28-32 312GB 52.3 2.34M • The only limitation on size is system memory • Billions of vertices and edges are possible • V vertices and E edges in each graph • E counts are undirected • STINGER stores both directions • Config is STINGER-specific parameters
  • 17.
    Why not existingtechnologies? • Traditional SQL databases • Not structured to do any meaningful graph queries with any level of efficiency or timeliness • Graph databases - mostly on-disk • Distributed disk can keep up with storing / indexing, but is simply too slow at random graph access to process on as the graph updates • Hadoop and HDFS-based projects • Not really the right programming model for many structural queries over the entire graph, random access performance is poor • Smaller graph libraries, processing tools • Can't scale, can't process dynamic graphs, frequently leads to impossible visualization attempts
  • 18.
    Who is GTRI? •Georgia Tech Research Institute • Largest research entity at Georgia Institute of Technology • One of the world's premier university-based applied R&D organizations for 75 years • Non-profit with over 1,600 employees and 21 locations world-wide • Over $240 million per year of government and industry contracts • Innovative Computing Division of the Cyber Technology and Information Security Lab • Dedicated to the application of practical HPC expertise and cutting-edge fundamental research to solve real-world problems • Experts in high-performance computing, algorithms, and big data
  • 19.
    How can Istart using STINGER? • Information, code, help • http://cc.gatech.edu/stinger • robert.mccoll@gtri.gatech.edu • Together, GTRI and Georgia Tech can offer • Consulting Understand how your organization can benefit from graph analytics. • Training Learn how to use graph analysis and apply STINGER to your data. • Implementation Customize and extend STINGER to suit your needs using our experts. • Research Expertise Connect with researchers on the cutting edge of big data to develop novel solutions to your open problems.