


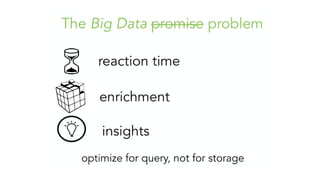


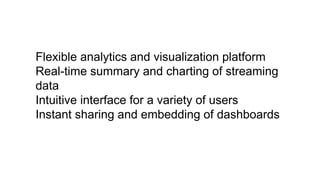

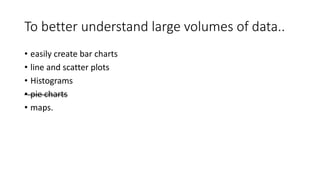
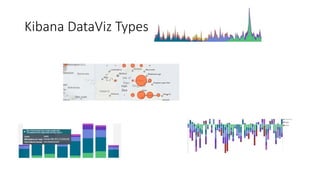
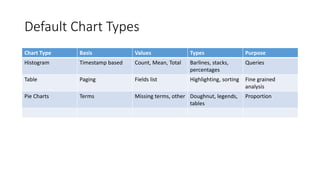
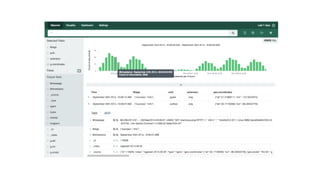
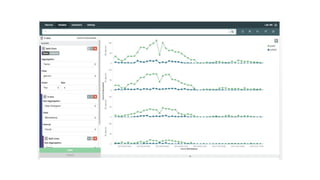

Kibana is a highly customizable dashboarding and visualization platform that allows users to perform flexible analytics and visualization of real-time streaming data through an intuitive interface. It allows users to easily create various chart types like bar charts, line plots, scatter plots, histograms, and pie charts to better understand large volumes of data. Some of its key features include customizable dashboards with components like time pickers, queries, filters, charts and tables for sharing and embedding insights.