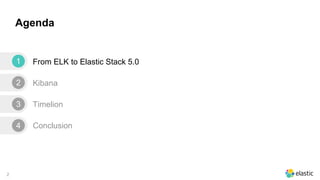
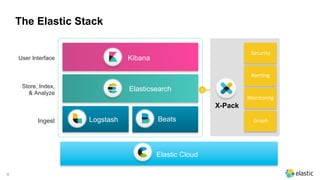
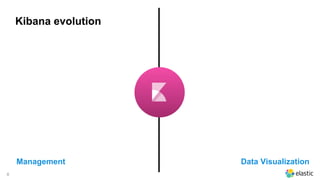
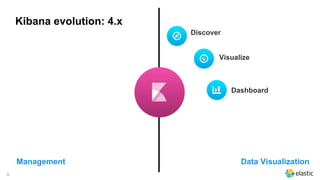
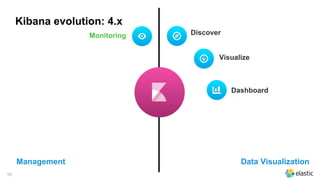
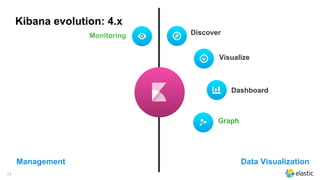
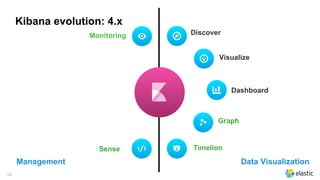
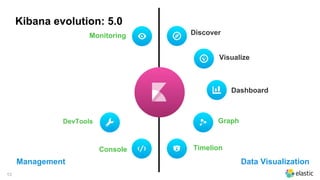
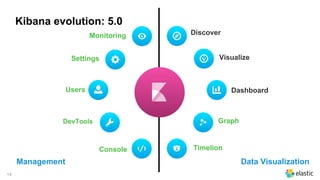
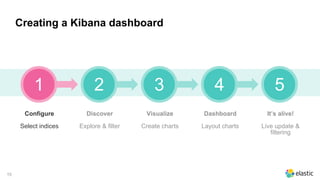
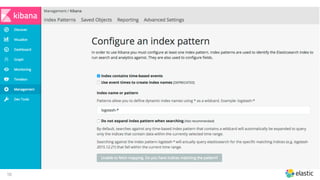
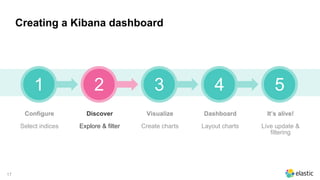
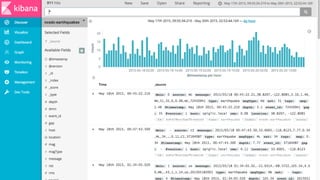
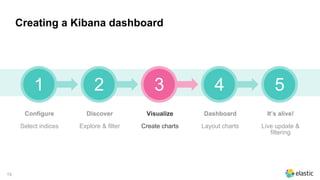
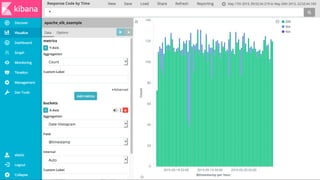
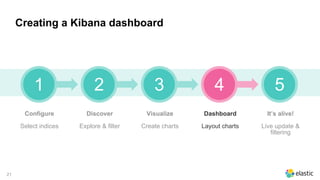
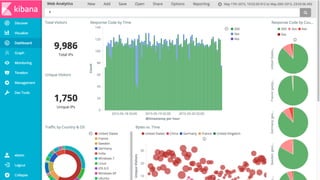
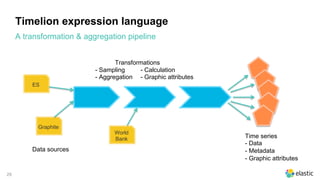
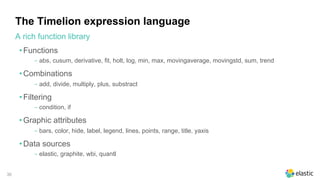
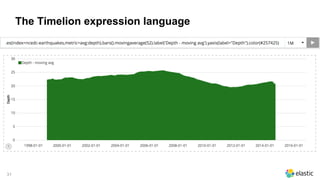
The document discusses Kibana and Timelion, which are tools for visualizing and analyzing time series data in the Elastic Stack. It provides an overview of Kibana's evolution and capabilities for creating dashboards. Timelion is introduced as a scripting language that allows users to transform, aggregate, and calculate on time series data from multiple sources to create visualizations. The document demonstrates Timelion's expression language, which includes functions, combinations, filtering, and attributes to process and render time series graphs.
5. 5
What’s new in Elastic Stack 5.0 ?
‒ Dimensional fields – speed up and better compression of numerical data
‒ Ingest node – avoids using Logstash for simple setups
‒ Rollover & Shrink API – better handling of non-hot data
‒ Painless – new fast & secure scripting langage
‒ Complete UI redesign
‒ Control center: config, monitoring, dev tools… and dashboards
‒ Timelion: for time series
Unified release, same version number for all products
6. 6
What’s new in Elastic Stack 5.0 ?
•
‒ Up to 50% faster
‒ Integration with Kafka
‒ New filters
•
‒ Libbeat – framework pour construire des agents
‒ MetricBeat, PacketBeat, FileBeat
‒ {Community}Beats, lots of them
‒ Immediate availability of new versions
‒ Automated upgrades
Unified release, same version number for all products
27. 27
Why Timelion?
• Elasticsearch queries
‒ Select lots of items (lightning fast)
‒ Aggregations make them understandable
• Need more than that
‒ Correlation, calculation, filtering
‒ Assemble multiple data sources
• Timelion started as an experiment
‒ Escape the UI and use the flexibility of a language
Because there’s more than search
29. 29
Timelion expression language
A transformation & aggregation pipeline
ES
World
Bank
Graphite
- Sampling
- Aggregation
- Calculation
- Graphic attributes
Data sources
Transformations
Time series
- Data
- Metadata
- Graphic attributes
30. 30
The Timelion expression language
• Functions
‒ abs, cusum, derivative, fit, holt, log, min, max, movingaverage, movingstd, sum, trend
• Combinations
‒ add, divide, multiply, plus, substract
• Filtering
‒ condition, if
• Graphic attributes
‒ bars, color, hide, label, legend, lines, points, range, title, yaxis
• Data sources
‒ elastic, graphite, wbi, quantl
A rich function library