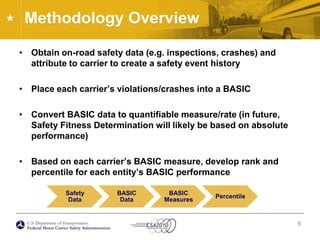
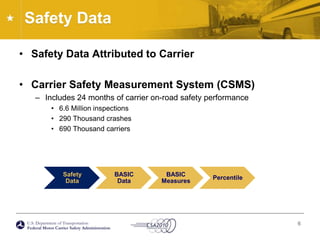
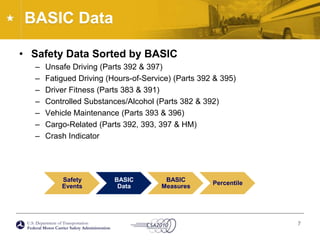
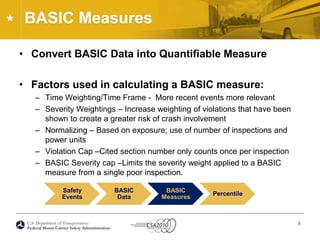
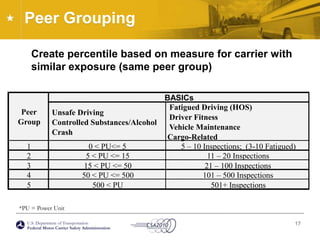
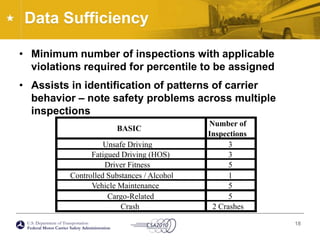
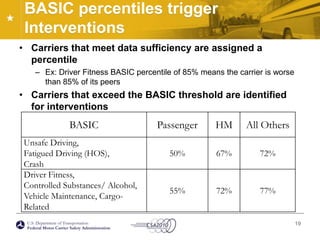
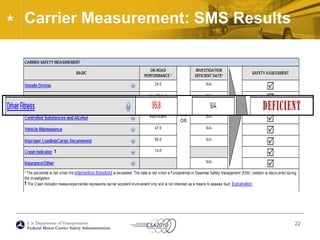
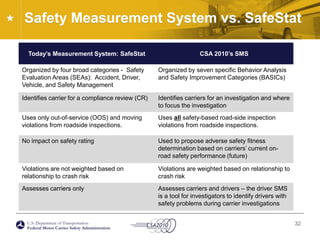
CSA 2010 Operational Model TestIntroduction to the Safety Measurement SystemApril  2010
Comprehensive Safety Analysis 2010What is CSA 2010?CSA 2010 is a pro-active initiative to improve the efficiency and effectiveness of FMCSA’s enforcement and compliance program to achieve the Agency’s mission to reduce commercial motor vehicle (CMV) crashes, fatalities, and injuries.2
Three Core Components	New Safety Measurement System (SMS)Improved ability to identify demonstrated safety problemsNew interventions processEmploys an array of interventions instead of the single option, labor-intensive compliance reviewNew approach to Safety Fitness Determination (SFD)SFD would be tied to current safety performance; not limited to results of acute/critical violations from a Compliance Review3
New Safety Measurement SystemAssesses safety of carriers and drivers based on unsafe behaviors that lead to crashesCalculates safety performance based on 7 Behavior Analysis and Safety Improvement Categories (BASICs)Weights time and severity of violations based on relationship to crash riskUses crash records and all safety-based violations found roadside.Identifies carriers for interventionsDetermines what problems need to be addressed by intervention processMonitors carriers on road performance for improvements throughout the processIn the future, measurement scores would support future Safety Fitness DeterminationsNew Safety Fitness Determination methodology is currently in rulemaking; initial rollout of CSA 2010 is not dependent on rule4
Methodology Overview Obtain on-road safety data (e.g. inspections, crashes) and attribute to carrier to create a safety event historyPlace each carrier’s violations/crashes into a BASICConvert BASIC data to quantifiable measure/rate (in future, Safety Fitness Determination will likely be based on absolute performance)Based on each carrier’s BASIC measure, develop rank and percentile for each entity’s BASIC performance5
Safety DataSafety Data Attributed to CarrierCarrier Safety Measurement System (CSMS)Includes 24 months of carrier on-road safety performance6.6 Million inspections290 Thousand crashes690 Thousand carriers6
BASIC DataSafety Data Sorted by BASICUnsafe Driving (Parts 392 & 397)Fatigued Driving (Hours-of-Service) (Parts 392 & 395)Driver Fitness (Parts 383 & 391)Controlled Substances/Alcohol (Parts 382 & 392)Vehicle Maintenance (Parts 393 & 396)Cargo-Related (Parts 392, 393, 397 & HM)Crash Indicator7
BASIC MeasuresConvert BASIC Data into Quantifiable MeasureFactors used in calculating a BASIC measure:Time Weighting/Time Frame -  More recent events more relevantSeverity Weightings – Increase weighting of violations that have been shown to create a greater risk of crash involvementNormalizing – Based on exposure; use of number of inspections and power unitsViolation Cap –Cited section number only counts once per inspectionBASIC Severity cap –Limits the severity weight applied to a BASIC measure from a single poor inspection.8
Unsafe Driving MeasureOperation of Commercial Motor Vehicles (CMVs) in a dangerous or careless mannerExamples – speeding, reckless driving, improper lane changeFactors used in calculating the measure:Time Weight – 0-6 Months (3), 6-12 Months (2), 12-24 Months (1)Violation Severity WeightBased on crash risk – Range from 1-10, where 10 is the most severeNormalized by Average Power Units9
Fatigued Driving (HOS) MeasureOperation of CMVs by drivers ill, fatigued or in non-compliance with the hours-of-service (HOS) regulationsExamples: HOS, logbook, and operating CMV while ill or fatiguedFactors used in calculating the measure:Time Weight - 0-6 Months (3), 6-12 Months (2), 12-24 Months (1)Violation Severity WeightBased on crash risk – Range from 1-10, where 10 is the most severeOOS (+2)Normalized by Relevant Inspections – Levels 1,2,3,6 and any other inspections resulting in related violations10
Driver Fitness MeasureOperation of CMVs by drivers who are unfit to operate a CMV due to lack of training, experience or medical qualificationsFailure to have a valid and appropriate commercial driver’s license, being medically unqualified to operate a CMV.Factors used in calculating the measure :Time Weight – 0-6 Months (3), 6-12 Months (2), 12-24 Months (1)Violation Severity WeightBased on crash risk – Range from 1-10, where 10 is the most severeOOS (+2)Normalized by Relevant Inspections – Levels 1,2,3,6 and any other inspections resulting in related violations11
Controlled Substances/Alcohol MeasureOperation of CMVs by drivers who are impaired due to alcohol, illegal drugs, and misuse of prescription or over-the-counter medicationsExamples: Use or possession of controlled substances or alcoholFactors used in calculating the measure:Time Weight – 0-6 Months (3), 6-12 Months (2), 12-24 Months (1)Violation Severity WeightBased on crash risk – Range from 1-10, where 10 is the most severeNormalized by Average Power Units12
Vehicle Maintenance MeasureFailure to properly maintain a CMVExamples: brakes, lights, and other mechanical defects, and failure to make required changesFactors used in calculating the measure:Time Weight – 0-6 Months (3), 6-12 Months (2), 12-24 Months (1)Violation Severity WeightBased on crash risk – Range from 1-10, where 10 is the most severeOOS (+2)Normalized by Relevant Inspections – Levels 1,2,5,6 and any other inspections resulting in related violations13
Cargo-Related MeasureFailure to properly prevent shifting loads, spilled or dropped cargo, and unsafe handling of hazardous materials on a CMVExamples: improper load securement, cargo retention, and hazardous material handlingFactors used in calculating the measure:Time Weight – 0-6 Months (3), 6-12 Months (2), 12-24 Months (1)Violation Severity WeightBased on crash risk – Range from 1-10, where 10 is the most severeOOS (+2)Normalized by Relevant Inspections – Levels 1,2,5,6 and any other inspections resulting in related violation14
Crash MeasureHistories or patterns of high crash involvement, including frequency and severityBased on state-reported crash recordsFactors used in calculating the measure:Time Weight – 0-6 Months (3), 6-12 Months (2), 12-24 Months (1)Crash Severity WeightRange from 1-3 – Crashes involving injury/fatality or HM release have more weightNormalized by Average Power Units15
PercentileBased on each BASIC measure, develop percentile indicating carrier’s BASIC performanceProvides a relative assessment of performanceAllows for prioritizing intervention resources by behaviorConsiderations:Peer Grouping – compare measures of entities with similar levels of exposureData Sufficiency standards – define events/exposure necessary to generate a robust measureSFD/Intervention standards – define “critical mass” of poor performance necessary for inclusion of entity in intervention process or detrimental SFDCurrent Inspection and Crash Data – assignment of percentile dependent on age and result of most recent inspection (12 months)16
Peer GroupingBASICs Fatigued Driving (HOS)Peer  Unsafe Driving Driver FitnessGroup Controlled Substances/Alcohol Vehicle Maintenance CrashCargo-Related10 < PU<= 55 – 10 Inspections;  (3-10 Fatigued)25 < PU <= 1511 – 20 Inspections315 < PU <= 5021 – 100 Inspections450 < PU <= 500101 – 500 Inspections5500 < PU501+ Inspections	Create percentile based on measure for carrier with similar exposure (same peer group)*PU = Power Unit17
Data SufficiencyNumber of BASICInspectionsUnsafe Driving3Fatigued Driving (HOS)3Driver Fitness5Controlled Substances / Alcohol1Vehicle Maintenance5Cargo-Related5Crash2 CrashesMinimum number of inspections with applicable violations required for percentile to be assignedAssists in identification of patterns of carrier behavior – note safety problems across multiple inspections18
BASIC percentiles trigger InterventionsCarriers that meet data sufficiency are assigned a percentileEx: Driver Fitness BASIC percentile of 85% means the carrier is worse than 85% of its peersCarriers that exceed the BASIC threshold are identified for interventions 19
Example of SafeStat vs. SMSCarrier under the Radar with Existing SafeStat System20
Carrier Measurement: SafeStat Results21
Carrier Measurement: SMS Results 22
Violation Details Provided in SMS23
Further Drilldown in SMS24
How does a carrier improve and get out of the intervention process?“Good” Inspections“Get Well” RulesUnsafe Driving and Controlled Substances/Alcohol BASICsNo percentile assigned if no inspections with a violation in these BASICs in the last yearCrash IndicatorNo percentile assigned if no crashes in last yearFatigued Driving (HOS), Driver Fitness, Vehicle Maintenance and Cargo-Related BASICsNo percentile assigned if:No inspections with a violation in that BASIC within the past year; andMost recent relevant inspection does not have a violation of that BASIC25
Carrier Access to Percentiles	When will carriers’ SMS results be made available?Currently, only test state carriers have access to SMS results by using the Comprehensive Safety Information (CSI) systemFMCSA will provide all carriers an early review of their own safety data by BASIC starting April 12, 2010Non-test carriers’ SMS results will be available to carriers in AugustPublic will have access to carrier SMS results in the winter of 201026
New Agency Plans for DriversThe new measurement system provides an internal tool to address CMV drivers:Provides enhanced information on individual drivers to investigators to identify drivers with safety problemsAllows for prioritizing driver sampling during carrier investigationSupports investigator follow up on serious violationsUnder CSA 2010, individual drivers will not be assigned safety ratings or safety fitness determinations27
New Agency Plans for Drivers (cont’d)Other Agency initiatives are underway, including the Pre-employment Screening Program (PSP)PSP was mandated by Congress and is not a part of CSA 2010“Driver Profiles” from FMCSA’s Driver Information Resource (DIR) will be available to carriers through PSPDriver Profiles will only be released with driver authorizationPSP is under development, more information can be found at www.psp.fmcsa.dot.gov28
 Roadside Data Uniformity  Data collected at the roadside is the foundation of all data driven traffic safety initiatives CSA 2010 relies on roadside data in its SMS Methodology The CSA 2010 SFD methodology would use roadside data as a component of safety fitness determinations29
 Roadside Uniformity-BackgroundEffort organized into four core initiatives:Consistent documentation of roadside inspection and violation dataStandardized processes for challenging dataIncreased awareness of high level goals of the inspection programGood inspections can support systematic enforcement programScreening vs. InspectionUniform inspection selection processes30
SMS and Safety Fitness Determination	SFD would:Incorporate on-road safety performance via new SMS which updates on a monthly basisContinue to include major safety violations found as part of CSA 2010 investigationsProduce a Safety Fitness Determination (SFD) of Unfit orMarginal orContinue Operation31Draft rulemaking is currently in review within DOT; NPRM expected to be published late 2010.
Safety Measurement System vs. SafeStat32
What Can Carriers Do To Prepare Now?Educate Yourselves and Your Employees:Understand the SMS Methodology and the BASICsCheck the website for information and updates (http://csa2010.fmcsa.dot.gov)Raise awareness that every inspection counts and every violation countsCheck and update records:Motor Carrier Census Form (MCS -150)Routinely monitor and review inspection and crash dataQuestion potentially incorrect data (DataQs: https://dataqs.fmcsa.dot.gov) Ensure compliance: Review  inspections and violation history over the past 2 years Address safety problems nowEducate drivers about how their performance impacts their own driving record and the safety assessment of the carrier 33
For more information, visit csa2010.fmcsa.dot.gov

Intro to SMS

  • 1.
    CSA 2010 OperationalModel TestIntroduction to the Safety Measurement SystemApril 2010
  • 2.
    Comprehensive Safety Analysis2010What is CSA 2010?CSA 2010 is a pro-active initiative to improve the efficiency and effectiveness of FMCSA’s enforcement and compliance program to achieve the Agency’s mission to reduce commercial motor vehicle (CMV) crashes, fatalities, and injuries.2
  • 3.
    Three Core Components NewSafety Measurement System (SMS)Improved ability to identify demonstrated safety problemsNew interventions processEmploys an array of interventions instead of the single option, labor-intensive compliance reviewNew approach to Safety Fitness Determination (SFD)SFD would be tied to current safety performance; not limited to results of acute/critical violations from a Compliance Review3
  • 4.
    New Safety MeasurementSystemAssesses safety of carriers and drivers based on unsafe behaviors that lead to crashesCalculates safety performance based on 7 Behavior Analysis and Safety Improvement Categories (BASICs)Weights time and severity of violations based on relationship to crash riskUses crash records and all safety-based violations found roadside.Identifies carriers for interventionsDetermines what problems need to be addressed by intervention processMonitors carriers on road performance for improvements throughout the processIn the future, measurement scores would support future Safety Fitness DeterminationsNew Safety Fitness Determination methodology is currently in rulemaking; initial rollout of CSA 2010 is not dependent on rule4
  • 5.
    Methodology Overview Obtainon-road safety data (e.g. inspections, crashes) and attribute to carrier to create a safety event historyPlace each carrier’s violations/crashes into a BASICConvert BASIC data to quantifiable measure/rate (in future, Safety Fitness Determination will likely be based on absolute performance)Based on each carrier’s BASIC measure, develop rank and percentile for each entity’s BASIC performance5
  • 6.
    Safety DataSafety DataAttributed to CarrierCarrier Safety Measurement System (CSMS)Includes 24 months of carrier on-road safety performance6.6 Million inspections290 Thousand crashes690 Thousand carriers6
  • 7.
    BASIC DataSafety DataSorted by BASICUnsafe Driving (Parts 392 & 397)Fatigued Driving (Hours-of-Service) (Parts 392 & 395)Driver Fitness (Parts 383 & 391)Controlled Substances/Alcohol (Parts 382 & 392)Vehicle Maintenance (Parts 393 & 396)Cargo-Related (Parts 392, 393, 397 & HM)Crash Indicator7
  • 8.
    BASIC MeasuresConvert BASICData into Quantifiable MeasureFactors used in calculating a BASIC measure:Time Weighting/Time Frame - More recent events more relevantSeverity Weightings – Increase weighting of violations that have been shown to create a greater risk of crash involvementNormalizing – Based on exposure; use of number of inspections and power unitsViolation Cap –Cited section number only counts once per inspectionBASIC Severity cap –Limits the severity weight applied to a BASIC measure from a single poor inspection.8
  • 9.
    Unsafe Driving MeasureOperationof Commercial Motor Vehicles (CMVs) in a dangerous or careless mannerExamples – speeding, reckless driving, improper lane changeFactors used in calculating the measure:Time Weight – 0-6 Months (3), 6-12 Months (2), 12-24 Months (1)Violation Severity WeightBased on crash risk – Range from 1-10, where 10 is the most severeNormalized by Average Power Units9
  • 10.
    Fatigued Driving (HOS)MeasureOperation of CMVs by drivers ill, fatigued or in non-compliance with the hours-of-service (HOS) regulationsExamples: HOS, logbook, and operating CMV while ill or fatiguedFactors used in calculating the measure:Time Weight - 0-6 Months (3), 6-12 Months (2), 12-24 Months (1)Violation Severity WeightBased on crash risk – Range from 1-10, where 10 is the most severeOOS (+2)Normalized by Relevant Inspections – Levels 1,2,3,6 and any other inspections resulting in related violations10
  • 11.
    Driver Fitness MeasureOperationof CMVs by drivers who are unfit to operate a CMV due to lack of training, experience or medical qualificationsFailure to have a valid and appropriate commercial driver’s license, being medically unqualified to operate a CMV.Factors used in calculating the measure :Time Weight – 0-6 Months (3), 6-12 Months (2), 12-24 Months (1)Violation Severity WeightBased on crash risk – Range from 1-10, where 10 is the most severeOOS (+2)Normalized by Relevant Inspections – Levels 1,2,3,6 and any other inspections resulting in related violations11
  • 12.
    Controlled Substances/Alcohol MeasureOperationof CMVs by drivers who are impaired due to alcohol, illegal drugs, and misuse of prescription or over-the-counter medicationsExamples: Use or possession of controlled substances or alcoholFactors used in calculating the measure:Time Weight – 0-6 Months (3), 6-12 Months (2), 12-24 Months (1)Violation Severity WeightBased on crash risk – Range from 1-10, where 10 is the most severeNormalized by Average Power Units12
  • 13.
    Vehicle Maintenance MeasureFailureto properly maintain a CMVExamples: brakes, lights, and other mechanical defects, and failure to make required changesFactors used in calculating the measure:Time Weight – 0-6 Months (3), 6-12 Months (2), 12-24 Months (1)Violation Severity WeightBased on crash risk – Range from 1-10, where 10 is the most severeOOS (+2)Normalized by Relevant Inspections – Levels 1,2,5,6 and any other inspections resulting in related violations13
  • 14.
    Cargo-Related MeasureFailure toproperly prevent shifting loads, spilled or dropped cargo, and unsafe handling of hazardous materials on a CMVExamples: improper load securement, cargo retention, and hazardous material handlingFactors used in calculating the measure:Time Weight – 0-6 Months (3), 6-12 Months (2), 12-24 Months (1)Violation Severity WeightBased on crash risk – Range from 1-10, where 10 is the most severeOOS (+2)Normalized by Relevant Inspections – Levels 1,2,5,6 and any other inspections resulting in related violation14
  • 15.
    Crash MeasureHistories orpatterns of high crash involvement, including frequency and severityBased on state-reported crash recordsFactors used in calculating the measure:Time Weight – 0-6 Months (3), 6-12 Months (2), 12-24 Months (1)Crash Severity WeightRange from 1-3 – Crashes involving injury/fatality or HM release have more weightNormalized by Average Power Units15
  • 16.
    PercentileBased on eachBASIC measure, develop percentile indicating carrier’s BASIC performanceProvides a relative assessment of performanceAllows for prioritizing intervention resources by behaviorConsiderations:Peer Grouping – compare measures of entities with similar levels of exposureData Sufficiency standards – define events/exposure necessary to generate a robust measureSFD/Intervention standards – define “critical mass” of poor performance necessary for inclusion of entity in intervention process or detrimental SFDCurrent Inspection and Crash Data – assignment of percentile dependent on age and result of most recent inspection (12 months)16
  • 17.
    Peer GroupingBASICs FatiguedDriving (HOS)Peer Unsafe Driving Driver FitnessGroup Controlled Substances/Alcohol Vehicle Maintenance CrashCargo-Related10 < PU<= 55 – 10 Inspections; (3-10 Fatigued)25 < PU <= 1511 – 20 Inspections315 < PU <= 5021 – 100 Inspections450 < PU <= 500101 – 500 Inspections5500 < PU501+ Inspections Create percentile based on measure for carrier with similar exposure (same peer group)*PU = Power Unit17
  • 18.
    Data SufficiencyNumber ofBASICInspectionsUnsafe Driving3Fatigued Driving (HOS)3Driver Fitness5Controlled Substances / Alcohol1Vehicle Maintenance5Cargo-Related5Crash2 CrashesMinimum number of inspections with applicable violations required for percentile to be assignedAssists in identification of patterns of carrier behavior – note safety problems across multiple inspections18
  • 19.
    BASIC percentiles triggerInterventionsCarriers that meet data sufficiency are assigned a percentileEx: Driver Fitness BASIC percentile of 85% means the carrier is worse than 85% of its peersCarriers that exceed the BASIC threshold are identified for interventions 19
  • 20.
    Example of SafeStatvs. SMSCarrier under the Radar with Existing SafeStat System20
  • 21.
  • 22.
  • 23.
  • 24.
  • 25.
    How does acarrier improve and get out of the intervention process?“Good” Inspections“Get Well” RulesUnsafe Driving and Controlled Substances/Alcohol BASICsNo percentile assigned if no inspections with a violation in these BASICs in the last yearCrash IndicatorNo percentile assigned if no crashes in last yearFatigued Driving (HOS), Driver Fitness, Vehicle Maintenance and Cargo-Related BASICsNo percentile assigned if:No inspections with a violation in that BASIC within the past year; andMost recent relevant inspection does not have a violation of that BASIC25
  • 26.
    Carrier Access toPercentiles When will carriers’ SMS results be made available?Currently, only test state carriers have access to SMS results by using the Comprehensive Safety Information (CSI) systemFMCSA will provide all carriers an early review of their own safety data by BASIC starting April 12, 2010Non-test carriers’ SMS results will be available to carriers in AugustPublic will have access to carrier SMS results in the winter of 201026
  • 27.
    New Agency Plansfor DriversThe new measurement system provides an internal tool to address CMV drivers:Provides enhanced information on individual drivers to investigators to identify drivers with safety problemsAllows for prioritizing driver sampling during carrier investigationSupports investigator follow up on serious violationsUnder CSA 2010, individual drivers will not be assigned safety ratings or safety fitness determinations27
  • 28.
    New Agency Plansfor Drivers (cont’d)Other Agency initiatives are underway, including the Pre-employment Screening Program (PSP)PSP was mandated by Congress and is not a part of CSA 2010“Driver Profiles” from FMCSA’s Driver Information Resource (DIR) will be available to carriers through PSPDriver Profiles will only be released with driver authorizationPSP is under development, more information can be found at www.psp.fmcsa.dot.gov28
  • 29.
    Roadside DataUniformity Data collected at the roadside is the foundation of all data driven traffic safety initiatives CSA 2010 relies on roadside data in its SMS Methodology The CSA 2010 SFD methodology would use roadside data as a component of safety fitness determinations29
  • 30.
    Roadside Uniformity-BackgroundEffortorganized into four core initiatives:Consistent documentation of roadside inspection and violation dataStandardized processes for challenging dataIncreased awareness of high level goals of the inspection programGood inspections can support systematic enforcement programScreening vs. InspectionUniform inspection selection processes30
  • 31.
    SMS and SafetyFitness Determination SFD would:Incorporate on-road safety performance via new SMS which updates on a monthly basisContinue to include major safety violations found as part of CSA 2010 investigationsProduce a Safety Fitness Determination (SFD) of Unfit orMarginal orContinue Operation31Draft rulemaking is currently in review within DOT; NPRM expected to be published late 2010.
  • 32.
  • 33.
    What Can CarriersDo To Prepare Now?Educate Yourselves and Your Employees:Understand the SMS Methodology and the BASICsCheck the website for information and updates (http://csa2010.fmcsa.dot.gov)Raise awareness that every inspection counts and every violation countsCheck and update records:Motor Carrier Census Form (MCS -150)Routinely monitor and review inspection and crash dataQuestion potentially incorrect data (DataQs: https://dataqs.fmcsa.dot.gov) Ensure compliance: Review inspections and violation history over the past 2 years Address safety problems nowEducate drivers about how their performance impacts their own driving record and the safety assessment of the carrier 33
  • 34.
    For more information,visit csa2010.fmcsa.dot.gov

Editor's Notes

  • #4 Talking Points :3 components but will be focusing this presentation on the new measurement system (click the mouse for the SMS bullet to turn red)
  • #5 Talking Points :The measurement system is essentially FMCSA’s radar system. It is a better measurement system, identifying more carriers with safety compliance problems, and more clearly identifying those problems so they can be address. While the proposed SFD is part of the new approach it will not be rolled out with SMS and new interventions in 2010. It is dependent on future rulemaking. An explanation of how SFD would work will be detailed and presented for public comment in a Notice of Proposed Rulemaking later this year.
  • #6 Talking Points :The new SMS takes all the on road safety performance data in FMCSA’s data system – MCMIS – and distributes it into the “right buckets” and assigns a severity risk. After getting the data, the SMS weighs the data and gives the carrier a percentile based on its peers. For example, how does ABC trucking stand in with other carriers that have a fatigue BASIC?BASIC measures is “how much does this bucket weighs now?”The percentile tells us how the “bucket” compares to the carrier’s peers.
  • #7 Talking Points:Here we describe Safety Events.For carriers– we look at a 2 year window.We also look at intrastate carriers
  • #8 Talking Points :This slide lists the seven Behavior Analysis Safety Improvement CategoriesThe methodology is designed to weight on-road safety data based on its relationship to crash risk and focuses on behaviors that lead to crash risk.The data is also time-weighted over a 24 month time period so that it is reflective of current on-road safety performance. If a carrier’s performance improves over the time, the safety performance score improves.HM regulation violations (171, 172, 173, 177, 178, 180) may also be found/included in other BASICs such as driver fitness, but the most concentrated BASIC for these is Cargo Related so they are listed there.
  • #9 Talking PointsAfter the data is in the appropriate bucket – it is weighted. Several things are considered:Time weighting; Severity weighting; Normalizing – violations vs. power units; Single inspection cap – limits weight of a single violation - especially important to small carriers; Violation cap – helps establish uniformity and consistencyThis step allows the Agency to see where a particular carrier stands regarding safety by BASICSome considerations to be aware of:Time weighting – puts focus on more recent eventsSeverity – this is a “risk” weightNormalizing – this is a denominator for “exposure” – usually this is the number of inspections.Two different caps:Single Inspection and Violation
  • #10 Talking Points :Now this presentation will go through how each BASIC is measured.This is a similar construct for other BASICSThe considerations are time and severity weight – and the number of power units.
  • #11 Talking Points:Something different here – time and severity weight is based on crash risk.
  • #12 Talking Points:Here we look at CDL violations. About 2/3 to 3/4s of these violations are due to medical certificate issues.
  • #13 Talking Points :This BASIC measure is normalized by number of power units/carrier size.
  • #14 Talking pointsThis slide shows how a BASIC measure is calculated for Vehicle Maintenance.
  • #15 Talking Points :This slide shows a BASIC measure is calculated for Cargo-Related.
  • #16 Talking Points :This measure shows how a BASIC measure is calculated for the Crash Measure.
  • #17 Talking Points :This slide introduces the percentile concept.After looking at all the safety events – they are measured with the formulas just covered. The next step is assigning a percentile to the carrier.Here SMS does “peer grouping” to compare similar carriers and also make sure there is enough data to get a measure.The system also looks at more current information – with more focus on what has happened in the past 12 months even though it uses 24 months of data.
  • #18 Talking Points :The percentile is based on a carrier’s peer grouping and this slide shows the peer groups (1-5).This is done to compare entities that have similar exposure.The left column is the peer groups.
  • #19 Talking Points :Percentiles are not assigned until sufficient data is obtained.Agency wants to make sure there are a minimum number of inspections.With that data, patterns of a carrier’s behavior can be seen.
  • #20 Talking Points:Thresholds are different depending on the BASIC and type of carrier. Here are intervention thresholds in the test.In the far-right column the threshold is for “all other” carriers. The reason why Unsafe, Fatigue, and Crash thresholds are lower is because research shows these have a greater relation to future crash risk.A methodology was applied to determine these thresholds. These thresholds are not arbitrary. THE NEW INTERVENTIONS:Warning LetterOffsite InvestigationOnsite Focused InvestigationOnsite Comprehensive Investigation
  • #26 Talking Points :A common question from carriers is how do I “get better?”The best way to improve is to get “good” inspections (i.e. no violations) since this is a performance-based system.For Fatigued Driving, Driver Fitness, Vehicle Maintenance and Cargo Related BASICsNo percentile assigned if:No inspections with a violation in that BASIC within the past year; andMost recent relevant inspection does not have a violation of that
  • #27 Talking Points Percentile results are the next step after the Data Preview, which will allow carriers to assess and address safety concerns.
  • #28 Talking Points The Agency will not give individual driver ratings as part of CSA 2010 despite rumors. In order for the Agency to rate drivers new authorities would be required through reauthorization AND rulemaking. The next slide will address driver data that will be available to carriers and drivers in the near future.
  • #29 Talking Points
  • #30 Talking Points Clear understanding that data collected at the roadside is a critical component of all traffic safety initiatives. For example, CSA 2010, TACT etc…So for both the carriers and the enforcement agencies that use this data its importance cannot be underestimated. During the summer of 2008 FMCSA and its state partners working on the Op Model test (FSWG) identified a need to enhance the uniformity and quality of roadside violation data. During discussions the consensus was that the data in its current form is fundamentally sound, valid and useableHowever, opportunities exist to enhance the quality of data and in turn, improve the integrity of all traffic safety programs.
  • #31 The effort to enhance the quality and uniformity of the roadside violation data started at the Fall 2008 CVSA meeting with the creation of an Ad-hoc committee to look at this issue. Currently this committee is managing an Alliance-wide effort to enhance the overall quality and uniformity of the data. The efforts has four core components listed on the screen.Consistent documentation of roadside inspection and violation data- Through a FMCSA funded high priority grant, CVSA began work on guidance that will promote and/or mandate the consistent documentation of roadside inspection and violation data. Standardized processes for challenging data- This initiative will provide procedural guidance on the management of the roadside data challenge process through our Data Q’s management systemIncreased awareness of the high level goals of the inspection program- This component of the roadside data uniformity initiative will focus on the increased importance of the roadside violation data and an understanding of how the data will be used. The goals is to broaden the understanding that every inspection counts and that there is a direct relation between the collection of the data and the end use of the data. Uniform inspection selections system-CVSAis currently facilitating discussions regarding the policies that govern when and how vehicles should be selected for an inspection. The goal is to focus discussions on implementing a valid and consistent vehicle and driver inspection selection process operated within the scope of a jurisdiction’s rules and policies that will promote roadside data uniformity.
  • #32 Talking Points Successful implementation of CSA 2010 is NOT dependent on SFD going through.CSA 2010 incorporates the existing rating process and will continue to do so until SFD goes into effect.Ratings are issued based on investigation findings:On-site comprehensive investigations can result in Sat., Conditional or Unsat. ratingsOn-site focused investigations can result in Conditional or Unsat. RatingsOff-site investigations do not result in a ratingCarriers can apply for a request for upgrade (§385.17)
  • #33 This slide highlights the differences between SafeStat and SMS SMS Applies risk-based weightings to violations in order to identify high crash-risk carriers demonstrating PATTERNS of unsafe behavior roadsideSMS Matches poor safety performance with appropriate level of interventionSMS Uses all SAFETY BASED roadside data, allowing more carriers with unsafe behavior to be identified for interventionSMS Assesses carriers and drivers – the driver SMS is a tool for investigators to identify drivers with safety problems during carrier investigations