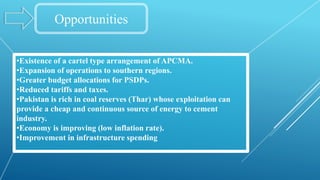
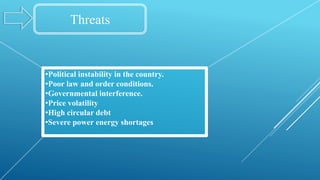
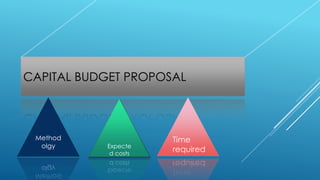
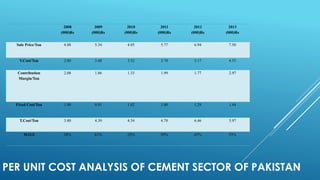
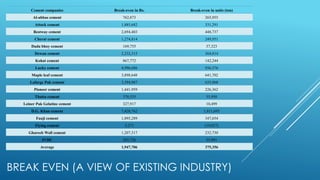
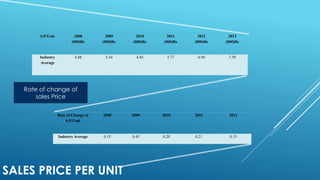
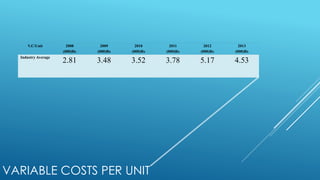
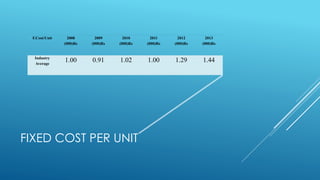
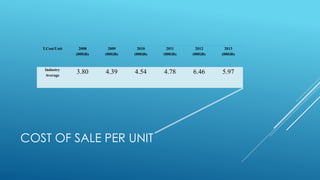
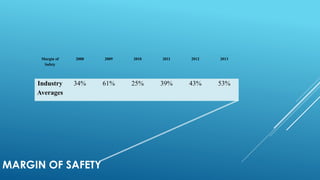
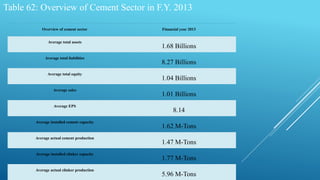
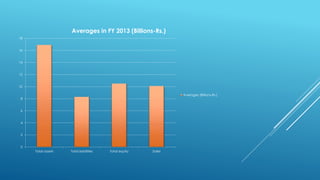
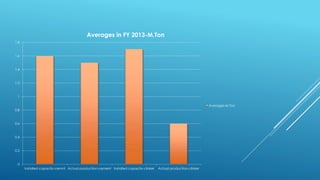
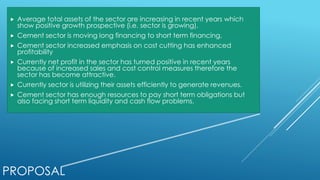
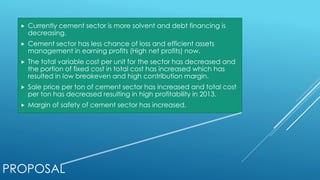
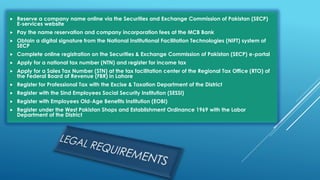
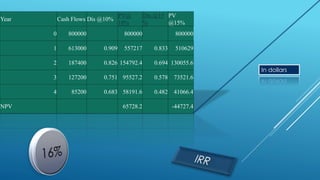
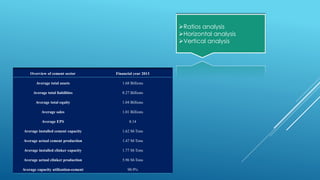
FINAL SEMESTER PROJECT
Investment Screening and selection
Capital Budget Proposal
Budgeting proposal and authorization
Project Tracking
Post Compilation Audit
Cement
Industry Pakistan
Business
Expansion
Establishing
news Industry
Capital
Budgeting
STEP 1
Investment
Screening
Opportunities
Threats
Opportunities
•Existence of a cartel type arrangement of APCMA.
•Expansion of operations to southern regions.
•Greater budget allocations for PSDPs.
•Reduced tariffs and taxes.
•Pakistan is rich in coal reserves (Thar) whose exploitation can
provide a cheap and continuous source of energy to cement
industry.
•Economy is improving (low inflation rate).
•Improvement in infrastructure spending
Threats
•Political instability in the country.
•Poor law and order conditions.
•Governmental interference.
•Price volatility
•High circular debt
•Severe power energy shortages
PORTER’S FIVE FORCES MODEL OF CEMENT SECTOR
 1. Bargaining Power of Suppliers
 2. Bargaining Power of Buyers
 3. Barriers to Entry in the Market
 4. Threat of Substitute Product
 5. Rivalry among the Existing Competitors
1. BARGAINING POWER OF SUPPLIERS
 the most significant industry among all industries of Pakistan
 these raw materials are natural resources
 Pakistan is abundant in limestone and gypsum resources
 is coal or fuel which contributes approximately 40% cost.
2. BARGAINING POWER OF BUYERS
 structure with more than 50 % share with top five companies
 Secondly formation of cartels has maintained same prices in the
region
 Thirdly it’s difficult for a new company to enter in the market
because of the barriers (but big companies can
 However in winter due to low demand prices could be decrease
but overall bargaining power is low
3. BARRIERS TO ENTRY IN THE MARKET
 1. High Cost
 2. Absence of Healthy Competition
 3. Nature of Industry
4. THREAT OF SUBSTITUTE PRODUCT
 threat of substitute product for cement is very low
 steel as a substitute could prove very costly
 timber, steel or gypsum which can replace cement we would
come to know that they are best fitted to be used in the regions
of extreme climate.
5. RIVALRY AMONG THE EXISTING COMPETITORS
 29 small and large cement companies which are currently
producing cement.
 people can shift easily from one firm to another due to low
switching cost which increases competition between firms.
 Prices are not competitive advantage
 Brand image would help determine higher prices due to cartel
SELECTION
 Environmental Aspects
 Legal Aspects
 Technological Aspects
 Social Aspects
 Economic Aspect
 Political Aspects
STEP 2
CAPITAL BUDGET PROPOSAL
Method
olgy Expecte
d costs
Time
required
PER UNIT COST ANALYSIS OF CEMENT SECTOR OF PAKISTAN
2008
(000)Rs
2009
(000)Rs
2010
(000)Rs
2011
(000)Rs
2012
(000)Rs
2013
(000)Rs
Sale Price/Ton 4.88 5.34 4.85 5.77 6.94 7.50
V.Cost/Ton 2.80 3.48 3.52 3.78 5.17 4.53
Contribution
Margin/Ton
2.08 1.86 1.33 1.99 1.77 2.97
Fixed Cost/Ton 1.00 0.91 1.02 1.00 1.29 1.44
T.Cost/Ton 3.80 4.39 4.54 4.78 6.46 5.97
M.O.S 34% 61% 25% 39% 43% 53%
BREAK EVEN (A VIEW OF EXISTING INDUSTRY)
Cement companies Break-even in Rs. Break-even in units (ton)
Al-abbas cement 762,873 265,955
Attock cement 1,885,682 331,291
Bestway cement 2,694,403 448,737
Cherat cement 1,274,814 249,951
Dada bhoy cement 169,755 37,323
Dewan cement 2,232,315 364,814
Kohat cement 867,772 142,244
Lucky cement 4,996,686 936,576
Maple leaf cement 3,898,648 641,702
Lafarge Pak cement 3,394,987 635,968
Pioneer cement 1,441,959 226,362
Thatta cement 370,535 55,950
Leiner Pak Gelatine cement 327,917 10,499
D.G. Khan cement 7,428,762 1,811,695
Fauji cement 1,895,289 347,654
Flying cement 5,271 (19,027)
Ghareeb Wall cement 1,207,317 232,730
JVDC 203,726 35,991
Average 1,947,706 375,356
ABOVE AVERAGE BREAK EVEN COMPANIES
 1. Bestway cement
 2. Dewan cement
 3. Lucky cement
 4. Maple Leaf cement
 5. Lafarge Pak cement
 6. D.G. Khan Cement
The Real
compititon
SALES PRICE PER UNIT
S.P/Unit 2008
(000)Rs
2009
(000)Rs
2010
(000)Rs
2011
(000)Rs
2012
(000)Rs
2013
(000)Rs
Industry
Average
4.88 5.34 4.85 5.77 6.94 7.50
Rate of Change of
S.P/Unit
2008 2009 2010 2011 2012
Industry Average 0.15 0.45 0.20 0.21 0.15
Rate of change of
sales Price
VARIABLE COSTS PER UNIT
V.C/Unit 2008
(000)Rs
2009
(000)Rs
2010
(000)Rs
2011
(000)Rs
2012
(000)Rs
2013
(000)Rs
Industry Average
2.81 3.48 3.52 3.78 5.17 4.53
FIXED COST PER UNIT
F.Cost/Unit 2008
(000)Rs
2009
(000)Rs
2010
(000)Rs
2011
(000)Rs
2012
(000)Rs
2013
(000)Rs
Industry
Average
1.00 0.91 1.02 1.00 1.29 1.44
COST OF SALE PER UNIT
T.Cost/Unit 2008
(000)Rs
2009
(000)Rs
2010
(000)Rs
2011
(000)Rs
2012
(000)Rs
2013
(000)Rs
Industry
Average
3.80 4.39 4.54 4.78 6.46 5.97
MARGIN OF SAFETY
Margin of
Safety
2008 2009 2010 2011 2012 2013
Industry
Averages
34% 61% 25% 39% 43% 53%
CONCLUSION
 The cost analysis has concluded that sales per unit in 2013 has
increased, cost per unit has decreased resulting in high profitability
so that’s a positive sign for the sector.
 Total variable cost of the sector has decreased in 2013, hence
increasing the contribution margin. This will not only decrease the
break-even point but also increase the profit margin on each unit
after achieving break-even. The sector has a high contribution
margin of 2970 Rs in 2013. This means that after achieving break-
even each ton will give a profit of this amount.
 Margin of safety is 53% in 2013 which means that if industry loses half
of its sales even then it would be safe from going into loss. So that
shows a very good performance of the sector. High Margin of safety
and high contribution margin in 2013 proved very good for the
sector.
Table 62: Overview of Cement Sector in F.Y. 2013
Overview of cement sector Financial year 2013
Average total assets
1.68 Billions
Average total liabilities
8.27 Billions
Average total equity
1.04 Billions
Average sales
1.01 Billions
Average EPS
8.14
Average installed cement capacity
1.62 M-Tons
Average actual cement production
1.47 M-Tons
Average installed clinker capacity
1.77 M-Tons
Average actual clinker production
5.96 M-Tons
0
2
4
6
8
10
12
14
16
18
Total assets Total liabilities Total equity Sales
Averages in FY 2013 (Billions-Rs.)
Averages (Billions-Rs.)
0
0.2
0.4
0.6
0.8
1
1.2
1.4
1.6
1.8
Installed capacity-cemnt Actual production-cement Installed capacity-clinker Actual production-clinker
Averages in FY 2013-M.Ton
Averages-M.Ton
PROPOSAL
 Average total assets of the sector are increasing in recent years which
show positive growth prospective (i.e. sector is growing).
 Cement sector is moving long financing to short term financing.
 Cement sector increased emphasis on cost cutting has enhanced
profitability
 Currently net profit in the sector has turned positive in recent years
because of increased sales and cost control measures therefore the
sector has become attractive.
 Currently sector is utilizing their assets efficiently to generate revenues.
 Cement sector has enough resources to pay short term obligations but
also facing short term liquidity and cash flow problems.
PROPOSAL
 Currently cement sector is more solvent and debt financing is
decreasing.
 Cement sector has less chance of loss and efficient assets
management in earning profits (High net profits) now.
 The total variable cost per unit for the sector has decreased and
the portion of fixed cost in total cost has increased which has
resulted in low breakeven and high contribution margin.
 Sale price per ton of cement sector has increased and total cost
per ton has decreased resulting in high profitability in 2013.
 Margin of safety of cement sector has increased.
 Reserve a company name online via the Securities and Exchange Commission of Pakistan (SECP)
E-services website
 Pay the name reservation and company incorporation fees at the MCB Bank
 Obtain a digital signature from the National Institutional Facilitation Technologies (NIFT) system of
SECP
 Complete online registration on the Securities & Exchange Commission of Pakistan (SECP) e-portal
 Apply for a national tax number (NTN) and register for income tax
 Apply for a Sales Tax Number (STN) at the tax facilitation center of the Regional Tax Office (RTO) of
the Federal Board of Revenue (FBR) in Lahore
 Register for Professional Tax with the Excise & Taxation Department of the District
 Register with the Sind Employees Social Security Institution (SESSI)
 Register with Employees Old-Age Benefits Institution (EOBI)
 Register under the West Pakistan Shops and Establishment Ordinance 1969 with the Labor
Department of the District
APPROVAL
 THE PROPOSAL AFTER BEING PREPARED AND AUTHORIZED WILL BE
PRESENTED IN A MEETING AND CEO WILL APPROVE IT FOR FURTHER
PROCESSING
STEP 4
EXPENDITURES
 Fixed cost
 Variable cost
VARIABLE COST
Raw material, direct labor,
variable FOH and variable
selling and distributive
expenses
Variable FOH:
Fuel and power
Stores and spares
consumed
Repair and maintenance
Vehicle running and
maintenance
Indirect material
Communication
Transportation
Traveling and conveyance
Printing and stationary
Other manufacturing cost
Variable Selling and
Distributive Cost:
Salaries and wages
Logistic and related charges
Loading and others
Communication
Traveling and conveyance
Freight
Printing and stationary
Utilities
Vehicles and maintenance
Repair and maintenance
Others selling expense
FIXED COST
 Depreciation and amortization
 Insurance
 Provision for slow moving spare
parts
 Earthmoving machinery
 Inspection for electrical installment
 Rent, rates and taxes
 Mess subsidy
 Technical assistance
 Legal and professional charges
 Fixed Selling and Distributive
Expenses:
 Insurance
 Rent, rates and taxes
Depreciation
Security charges
Insurance
Fee subscription and periodicals
Advertisement and sales promotion
Entertainment
Office canteen
Meetings and conferences
Year 0 1 2 3 4
Sales - 3750000 1680000 1380000 1320000
Advertisement Cost - 650000 100000 - -
Material 810000 378000 324000 324000
Fixed Cost 600000 600000 600000 600000
OH 900000 420000 360000 360000
operating cash flows 790000 182000 96000 36000
Tax @30% 237000 54600 28800 10800
Net cash flows 613000 187400 127200 85200
In dollars
Cement companies Break-even in Rs. Break-even in units (ton)
Al-abbas cement 762,873 265,955
Attock cement 1,885,682 331,291
Bestway cement 2,694,403 448,737
Cherat cement 1,274,814 249,951
Dada bhoy cement 169,755 37,323
Dewan cement 2,232,315 364,814
Kohat cement 867,772 142,244
Lucky cement 4,996,686 936,576
Maple leaf cement 3,898,648 641,702
Lafarge Pak cement 3,394,987 635,968
Pioneer cement 1,441,959 226,362
Thatta cement 370,535 55,950
Leiner Pak Gelatine cement 327,917 10,499
D.G. Khan cement 7,428,762 1,811,695
Fauji cement 1,895,289 347,654
Flying cement 5,271 (19,027)
Ghareeb Wall cement 1,207,317 232,730
JVDC 203,726 35,991
Average 1,947,706 375,356
Year Cash Flows PV@ 10%
0 800000 800000
1 613000 0.909 557217
2 187400 0.826 154792.4
3 127200 0.751 95527.2
4 85200 0.683 58191.6
NPV 65728.2
In dollars
Year Cash Flows Dis @10%
PV@
10%
Dis.@15
%
PV
@15%
0 800000 800000 800000
1 613000 0.909 557217 0.833 510629
2 187400 0.826 154792.4 0.694 130055.6
3 127200 0.751 95527.2 0.578 73521.6
4 85200 0.683 58191.6 0.482 41066.4
NPV 65728.2 -44727.4
In dollars
STEP 5
Ratios analysis
Horizontal analysis
Vertical analysis
Overview of cement sector Financial year 2013
Average total assets 1.68 Billions
Average total liabilities 8.27 Billions
Average total equity 1.04 Billions
Average sales 1.01 Billions
Average EPS 8.14
Average installed cement capacity 1.62 M-Tons
Average actual cement production 1.47 M-Tons
Average installed clinker capacity 1.77 M-Tons
Average actual clinker production 5.96 M-Tons
Average capacity utilization-cement 90.9%
Capital Budgeting process

Capital Budgeting process

  • 1.
  • 2.
    Investment Screening andselection Capital Budget Proposal Budgeting proposal and authorization Project Tracking Post Compilation Audit
  • 3.
  • 4.
  • 5.
  • 6.
    Opportunities •Existence of acartel type arrangement of APCMA. •Expansion of operations to southern regions. •Greater budget allocations for PSDPs. •Reduced tariffs and taxes. •Pakistan is rich in coal reserves (Thar) whose exploitation can provide a cheap and continuous source of energy to cement industry. •Economy is improving (low inflation rate). •Improvement in infrastructure spending
  • 7.
    Threats •Political instability inthe country. •Poor law and order conditions. •Governmental interference. •Price volatility •High circular debt •Severe power energy shortages
  • 8.
    PORTER’S FIVE FORCESMODEL OF CEMENT SECTOR  1. Bargaining Power of Suppliers  2. Bargaining Power of Buyers  3. Barriers to Entry in the Market  4. Threat of Substitute Product  5. Rivalry among the Existing Competitors
  • 9.
    1. BARGAINING POWEROF SUPPLIERS  the most significant industry among all industries of Pakistan  these raw materials are natural resources  Pakistan is abundant in limestone and gypsum resources  is coal or fuel which contributes approximately 40% cost.
  • 10.
    2. BARGAINING POWEROF BUYERS  structure with more than 50 % share with top five companies  Secondly formation of cartels has maintained same prices in the region  Thirdly it’s difficult for a new company to enter in the market because of the barriers (but big companies can  However in winter due to low demand prices could be decrease but overall bargaining power is low
  • 11.
    3. BARRIERS TOENTRY IN THE MARKET  1. High Cost  2. Absence of Healthy Competition  3. Nature of Industry
  • 12.
    4. THREAT OFSUBSTITUTE PRODUCT  threat of substitute product for cement is very low  steel as a substitute could prove very costly  timber, steel or gypsum which can replace cement we would come to know that they are best fitted to be used in the regions of extreme climate.
  • 13.
    5. RIVALRY AMONGTHE EXISTING COMPETITORS  29 small and large cement companies which are currently producing cement.  people can shift easily from one firm to another due to low switching cost which increases competition between firms.  Prices are not competitive advantage  Brand image would help determine higher prices due to cartel
  • 14.
    SELECTION  Environmental Aspects Legal Aspects  Technological Aspects  Social Aspects  Economic Aspect  Political Aspects
  • 15.
  • 16.
    CAPITAL BUDGET PROPOSAL Method olgyExpecte d costs Time required
  • 17.
    PER UNIT COSTANALYSIS OF CEMENT SECTOR OF PAKISTAN 2008 (000)Rs 2009 (000)Rs 2010 (000)Rs 2011 (000)Rs 2012 (000)Rs 2013 (000)Rs Sale Price/Ton 4.88 5.34 4.85 5.77 6.94 7.50 V.Cost/Ton 2.80 3.48 3.52 3.78 5.17 4.53 Contribution Margin/Ton 2.08 1.86 1.33 1.99 1.77 2.97 Fixed Cost/Ton 1.00 0.91 1.02 1.00 1.29 1.44 T.Cost/Ton 3.80 4.39 4.54 4.78 6.46 5.97 M.O.S 34% 61% 25% 39% 43% 53%
  • 18.
    BREAK EVEN (AVIEW OF EXISTING INDUSTRY) Cement companies Break-even in Rs. Break-even in units (ton) Al-abbas cement 762,873 265,955 Attock cement 1,885,682 331,291 Bestway cement 2,694,403 448,737 Cherat cement 1,274,814 249,951 Dada bhoy cement 169,755 37,323 Dewan cement 2,232,315 364,814 Kohat cement 867,772 142,244 Lucky cement 4,996,686 936,576 Maple leaf cement 3,898,648 641,702 Lafarge Pak cement 3,394,987 635,968 Pioneer cement 1,441,959 226,362 Thatta cement 370,535 55,950 Leiner Pak Gelatine cement 327,917 10,499 D.G. Khan cement 7,428,762 1,811,695 Fauji cement 1,895,289 347,654 Flying cement 5,271 (19,027) Ghareeb Wall cement 1,207,317 232,730 JVDC 203,726 35,991 Average 1,947,706 375,356
  • 19.
    ABOVE AVERAGE BREAKEVEN COMPANIES  1. Bestway cement  2. Dewan cement  3. Lucky cement  4. Maple Leaf cement  5. Lafarge Pak cement  6. D.G. Khan Cement The Real compititon
  • 20.
    SALES PRICE PERUNIT S.P/Unit 2008 (000)Rs 2009 (000)Rs 2010 (000)Rs 2011 (000)Rs 2012 (000)Rs 2013 (000)Rs Industry Average 4.88 5.34 4.85 5.77 6.94 7.50 Rate of Change of S.P/Unit 2008 2009 2010 2011 2012 Industry Average 0.15 0.45 0.20 0.21 0.15 Rate of change of sales Price
  • 21.
    VARIABLE COSTS PERUNIT V.C/Unit 2008 (000)Rs 2009 (000)Rs 2010 (000)Rs 2011 (000)Rs 2012 (000)Rs 2013 (000)Rs Industry Average 2.81 3.48 3.52 3.78 5.17 4.53
  • 22.
    FIXED COST PERUNIT F.Cost/Unit 2008 (000)Rs 2009 (000)Rs 2010 (000)Rs 2011 (000)Rs 2012 (000)Rs 2013 (000)Rs Industry Average 1.00 0.91 1.02 1.00 1.29 1.44
  • 23.
    COST OF SALEPER UNIT T.Cost/Unit 2008 (000)Rs 2009 (000)Rs 2010 (000)Rs 2011 (000)Rs 2012 (000)Rs 2013 (000)Rs Industry Average 3.80 4.39 4.54 4.78 6.46 5.97
  • 24.
    MARGIN OF SAFETY Marginof Safety 2008 2009 2010 2011 2012 2013 Industry Averages 34% 61% 25% 39% 43% 53%
  • 25.
    CONCLUSION  The costanalysis has concluded that sales per unit in 2013 has increased, cost per unit has decreased resulting in high profitability so that’s a positive sign for the sector.  Total variable cost of the sector has decreased in 2013, hence increasing the contribution margin. This will not only decrease the break-even point but also increase the profit margin on each unit after achieving break-even. The sector has a high contribution margin of 2970 Rs in 2013. This means that after achieving break- even each ton will give a profit of this amount.  Margin of safety is 53% in 2013 which means that if industry loses half of its sales even then it would be safe from going into loss. So that shows a very good performance of the sector. High Margin of safety and high contribution margin in 2013 proved very good for the sector.
  • 26.
    Table 62: Overviewof Cement Sector in F.Y. 2013 Overview of cement sector Financial year 2013 Average total assets 1.68 Billions Average total liabilities 8.27 Billions Average total equity 1.04 Billions Average sales 1.01 Billions Average EPS 8.14 Average installed cement capacity 1.62 M-Tons Average actual cement production 1.47 M-Tons Average installed clinker capacity 1.77 M-Tons Average actual clinker production 5.96 M-Tons
  • 27.
    0 2 4 6 8 10 12 14 16 18 Total assets Totalliabilities Total equity Sales Averages in FY 2013 (Billions-Rs.) Averages (Billions-Rs.)
  • 28.
    0 0.2 0.4 0.6 0.8 1 1.2 1.4 1.6 1.8 Installed capacity-cemnt Actualproduction-cement Installed capacity-clinker Actual production-clinker Averages in FY 2013-M.Ton Averages-M.Ton
  • 29.
    PROPOSAL  Average totalassets of the sector are increasing in recent years which show positive growth prospective (i.e. sector is growing).  Cement sector is moving long financing to short term financing.  Cement sector increased emphasis on cost cutting has enhanced profitability  Currently net profit in the sector has turned positive in recent years because of increased sales and cost control measures therefore the sector has become attractive.  Currently sector is utilizing their assets efficiently to generate revenues.  Cement sector has enough resources to pay short term obligations but also facing short term liquidity and cash flow problems.
  • 30.
    PROPOSAL  Currently cementsector is more solvent and debt financing is decreasing.  Cement sector has less chance of loss and efficient assets management in earning profits (High net profits) now.  The total variable cost per unit for the sector has decreased and the portion of fixed cost in total cost has increased which has resulted in low breakeven and high contribution margin.  Sale price per ton of cement sector has increased and total cost per ton has decreased resulting in high profitability in 2013.  Margin of safety of cement sector has increased.
  • 33.
     Reserve acompany name online via the Securities and Exchange Commission of Pakistan (SECP) E-services website  Pay the name reservation and company incorporation fees at the MCB Bank  Obtain a digital signature from the National Institutional Facilitation Technologies (NIFT) system of SECP  Complete online registration on the Securities & Exchange Commission of Pakistan (SECP) e-portal  Apply for a national tax number (NTN) and register for income tax  Apply for a Sales Tax Number (STN) at the tax facilitation center of the Regional Tax Office (RTO) of the Federal Board of Revenue (FBR) in Lahore  Register for Professional Tax with the Excise & Taxation Department of the District  Register with the Sind Employees Social Security Institution (SESSI)  Register with Employees Old-Age Benefits Institution (EOBI)  Register under the West Pakistan Shops and Establishment Ordinance 1969 with the Labor Department of the District
  • 35.
    APPROVAL  THE PROPOSALAFTER BEING PREPARED AND AUTHORIZED WILL BE PRESENTED IN A MEETING AND CEO WILL APPROVE IT FOR FURTHER PROCESSING
  • 36.
  • 37.
  • 38.
    VARIABLE COST Raw material,direct labor, variable FOH and variable selling and distributive expenses Variable FOH: Fuel and power Stores and spares consumed Repair and maintenance Vehicle running and maintenance Indirect material Communication Transportation Traveling and conveyance Printing and stationary Other manufacturing cost Variable Selling and Distributive Cost: Salaries and wages Logistic and related charges Loading and others Communication Traveling and conveyance Freight Printing and stationary Utilities Vehicles and maintenance Repair and maintenance Others selling expense
  • 39.
    FIXED COST  Depreciationand amortization  Insurance  Provision for slow moving spare parts  Earthmoving machinery  Inspection for electrical installment  Rent, rates and taxes  Mess subsidy  Technical assistance  Legal and professional charges  Fixed Selling and Distributive Expenses:  Insurance  Rent, rates and taxes Depreciation Security charges Insurance Fee subscription and periodicals Advertisement and sales promotion Entertainment Office canteen Meetings and conferences
  • 40.
    Year 0 12 3 4 Sales - 3750000 1680000 1380000 1320000 Advertisement Cost - 650000 100000 - - Material 810000 378000 324000 324000 Fixed Cost 600000 600000 600000 600000 OH 900000 420000 360000 360000 operating cash flows 790000 182000 96000 36000 Tax @30% 237000 54600 28800 10800 Net cash flows 613000 187400 127200 85200 In dollars
  • 41.
    Cement companies Break-evenin Rs. Break-even in units (ton) Al-abbas cement 762,873 265,955 Attock cement 1,885,682 331,291 Bestway cement 2,694,403 448,737 Cherat cement 1,274,814 249,951 Dada bhoy cement 169,755 37,323 Dewan cement 2,232,315 364,814 Kohat cement 867,772 142,244 Lucky cement 4,996,686 936,576 Maple leaf cement 3,898,648 641,702 Lafarge Pak cement 3,394,987 635,968 Pioneer cement 1,441,959 226,362 Thatta cement 370,535 55,950 Leiner Pak Gelatine cement 327,917 10,499 D.G. Khan cement 7,428,762 1,811,695 Fauji cement 1,895,289 347,654 Flying cement 5,271 (19,027) Ghareeb Wall cement 1,207,317 232,730 JVDC 203,726 35,991 Average 1,947,706 375,356
  • 42.
    Year Cash FlowsPV@ 10% 0 800000 800000 1 613000 0.909 557217 2 187400 0.826 154792.4 3 127200 0.751 95527.2 4 85200 0.683 58191.6 NPV 65728.2 In dollars
  • 43.
    Year Cash FlowsDis @10% PV@ 10% Dis.@15 % PV @15% 0 800000 800000 800000 1 613000 0.909 557217 0.833 510629 2 187400 0.826 154792.4 0.694 130055.6 3 127200 0.751 95527.2 0.578 73521.6 4 85200 0.683 58191.6 0.482 41066.4 NPV 65728.2 -44727.4 In dollars
  • 44.
  • 45.
    Ratios analysis Horizontal analysis Verticalanalysis Overview of cement sector Financial year 2013 Average total assets 1.68 Billions Average total liabilities 8.27 Billions Average total equity 1.04 Billions Average sales 1.01 Billions Average EPS 8.14 Average installed cement capacity 1.62 M-Tons Average actual cement production 1.47 M-Tons Average installed clinker capacity 1.77 M-Tons Average actual clinker production 5.96 M-Tons Average capacity utilization-cement 90.9%