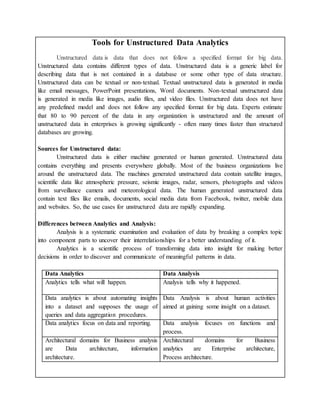
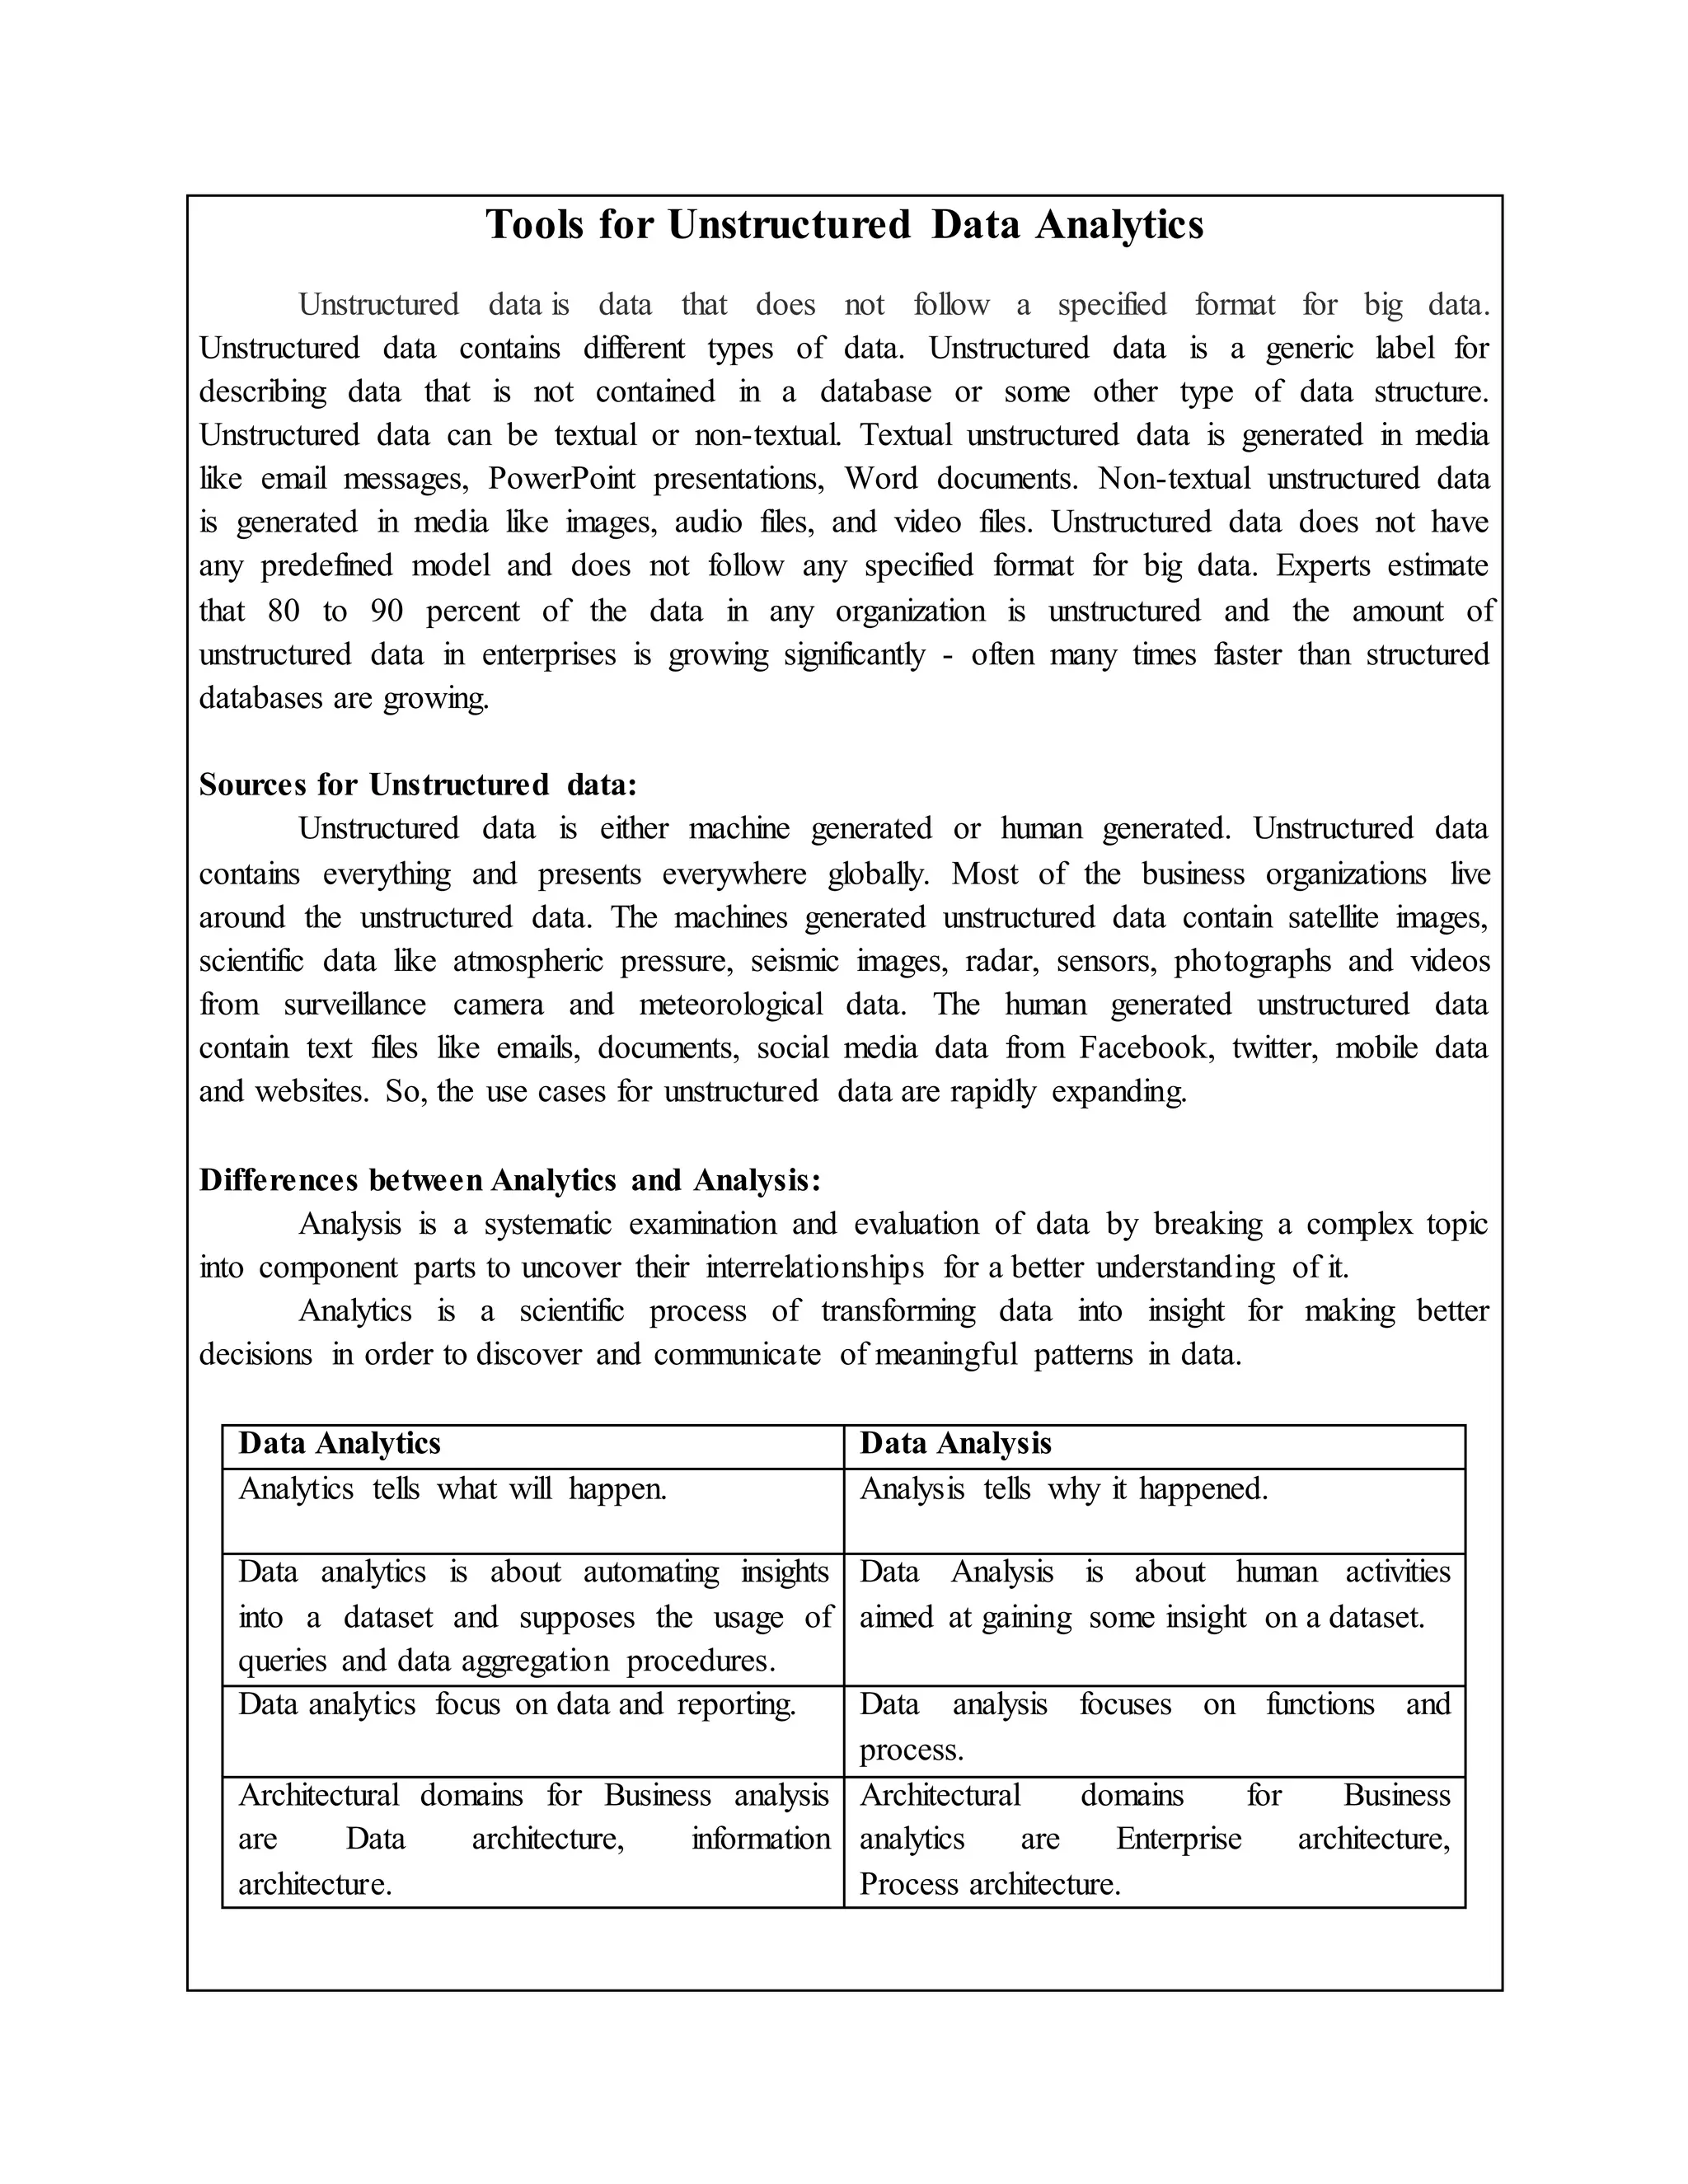
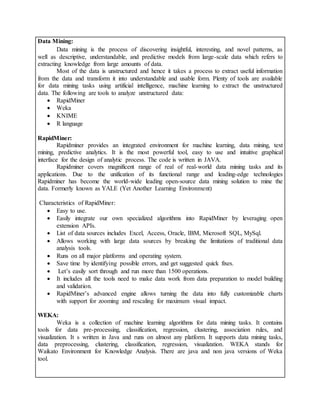
1. Tools for Unstructured Data Analytics
Unstructured data is data that does not follow a specified format for big data.
Unstructured data contains different types of data. Unstructured data is a generic label for
describing data that is not contained in a database or some other type of data structure.
Unstructured data can be textual or non-textual. Textual unstructured data is generated in media
like email messages, PowerPoint presentations, Word documents. Non-textual unstructured data
is generated in media like images, audio files, and video files. Unstructured data does not have
any predefined model and does not follow any specified format for big data. Experts estimate
that 80 to 90 percent of the data in any organization is unstructured and the amount of
unstructured data in enterprises is growing significantly - often many times faster than structured
databases are growing.
Sources for Unstructured data:
Unstructured data is either machine generated or human generated. Unstructured data
contains everything and presents everywhere globally. Most of the business organizations live
around the unstructured data. The machines generated unstructured data contain satellite images,
scientific data like atmospheric pressure, seismic images, radar, sensors, photographs and videos
from surveillance camera and meteorological data. The human generated unstructured data
contain text files like emails, documents, social media data from Facebook, twitter, mobile data
and websites. So, the use cases for unstructured data are rapidly expanding.
Differences between Analytics and Analysis:
Analysis is a systematic examination and evaluation of data by breaking a complex topic
into component parts to uncover their interrelationships for a better understanding of it.
Analytics is a scientific process of transforming data into insight for making better
decisions in order to discover and communicate of meaningful patterns in data.
Data Analytics Data Analysis
Analytics tells what will happen. Analysis tells why it happened.
Data analytics is about automating insights
into a dataset and supposes the usage of
queries and data aggregation procedures.
Data Analysis is about human activities
aimed at gaining some insight on a dataset.
Data analytics focus on data and reporting. Data analysis focuses on functions and
process.
Architectural domains for Business analysis
are Data architecture, information
architecture.
Architectural domains for Business
analytics are Enterprise architecture,
Process architecture.
2. Data Mining:
Data mining is the process of discovering insightful, interesting, and novel patterns, as
well as descriptive, understandable, and predictive models from large-scale data which refers to
extracting knowledge from large amounts of data.
Most of the data is unstructured and hence it takes a process to extract useful information
from the data and transform it into understandable and usable form. Plenty of tools are available
for data mining tasks using artificial intelligence, machine learning to extract the unstructured
data. The following are tools to analyze unstructured data:
RapidMiner
Weka
KNIME
R language
RapidMiner:
Rapidminer provides an integrated environment for machine learning, data mining, text
mining, predictive analytics. It is the most powerful tool, easy to use and intuitive graphical
interface for the design of analytic process. The code is written in JAVA.
Rapidminer covers magnificent range of real of real-world data mining tasks and its
applications. Due to the unification of its functional range and leading-edge technologies
Rapidminer has become the world-wide leading open-source data mining solution to mine the
data. Formerly known as YALE (Yet Another Learning Environment)
Characteristics of RapidMiner:
Easy to use.
Easily integrate our own specialized algorithms into RapidMiner by leveraging open
extension APIs.
List of data sources includes Excel, Access, Oracle, IBM, Microsoft SQL, MySql.
Allows working with large data sources by breaking the limitations of traditional data
analysis tools.
Runs on all major platforms and operating system.
Save time by identifying possible errors, and get suggested quick fixes.
Let’s easily sort through and run more than 1500 operations.
It includes all the tools need to make data work from data preparation to model building
and validation.
RapidMiner’s advanced engine allows turning the data into fully customizable charts
with support for zooming and rescaling for maximum visual impact.
WEKA:
Weka is a collection of machine learning algorithms for data mining tasks. It contains
tools for data pre-processing, classification, regression, clustering, association rules, and
visualization. It s written in Java and runs on almost any platform. It supports data mining tasks,
data preprocessing, clustering, classification, regression, visualization. WEKA stands for
Waikato Environment for Knowledge Analysis. There are java and non java versions of Weka
tool.
3. Characteristics of Weka:
Easy to access because of its graphical user interface.
Large collection of different data mining algorithms.
It can assist an organization evaluate and analyze their information in more effective
terms.
Allows individuals to look into their information from a variety of distinct factors as is it
incredibly user friendly.
Freely available under the GNU general Public License.
KNIME:
KNIME is an open source data analytics and a modular platform for building and
executing workflows using predefined components called nodes. It incorporates nodes for data
I/O preprocessing, modeling, analysis and data mining. KNIME offers to access statistical
routines, plug-ins.
Characteristics of KNIME:
Tool is developed to extract, transform, and analyze the data.
It supports mathematical transformation of data for analysis.
Open integration platform.
R Language:
R is powerful open-source implementation of the language S. R is very effective
statistical tool and well worth the effort to learn. R is polymorphic, which means that the same
function can be applied to different types of objects, with results tailored to the different object
types. R is a GNU (General Public License) project.
Characteristics of R:
R is open source and free.
It supports multiple platforms like Windows, Linux.
It is both object oriented and functional programming structure.
The graphical capabilities of R are outstanding, providing a fully programmable graphics
language that surpasses most other statistical and graphical packages.
R has more than 4000 packages available from multiple repositories in various
specializations.
R can import data from csv files, excel, sas and produces the output in pdf, jpg, png
formats and also table output.