Download to read offline
![4
Discussion:
The decision must be made by Long distance runners is final for their performance. Whereas in sprints where muscle
power and technique is needed. Self Concept level differs from event and individual.
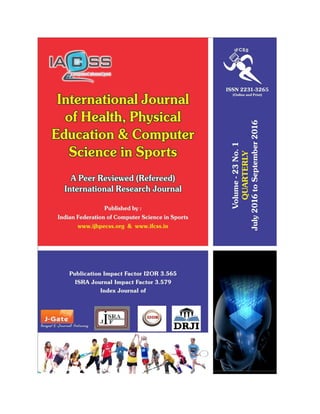
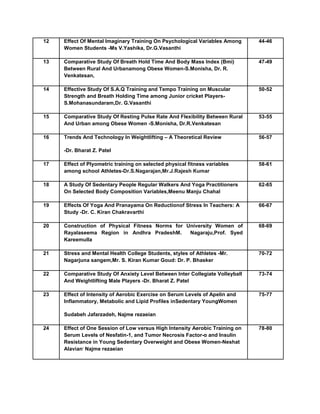
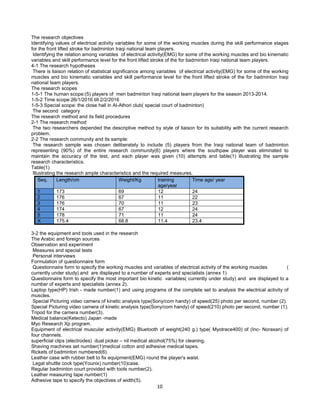
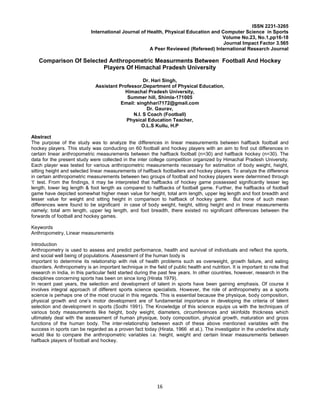
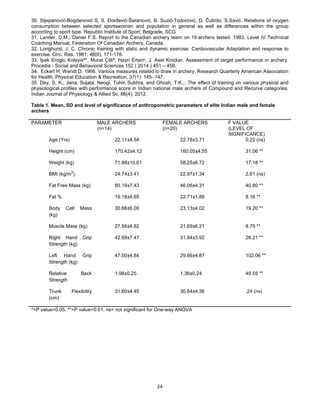
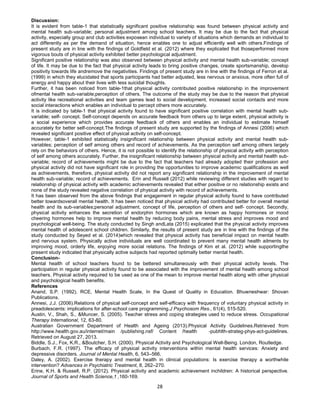
Table No. 1.1
Sprinters, Middle and Long Distance Runners Shows the Mean, S.D, S. E. and F value of Self Concept
A = Sprinters B = Middle Distance Runners C = Long Distance Runners
Table No. 1.2:Summary of One Way ANOVA
Source Ss df MS F P
Between Groups 31424.13 2 15712.06
Error 84936.65 447 190.01
Total 116360.79 449
82.69 < .01
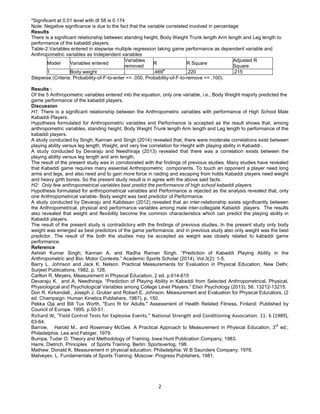
From the one way anova summary and graph it is seen that Mean of self concept score of the sprinters
Mean is 153.38, middle distance runners Mean is 164.54 and long distance runners mean is 173.82. The difference
between the three means is highly significant (F = 82.69, df =449, P < 0.01) It is clear that first result middle distance
runners have significantly high self concept than the sprinters. Second long distance runners have significantly high
self concept than the sprinters. Third long distance runners have significantly high self concept than the middle
distance runners. HSD[.05]=0.62; HSD[.01]=0.77.
Conclusion:
1) Middle distance runners have significantly high Self Concept than the sprinters.
2) Long distance runners have significantly high Self Concept than the sprinters.
3) Long distance runners have significantly high Self Concept than the middle distance runners.
It is concluded that Middle distance runners are having comparatively high Self Concept than the sprinters, Long
distance runners have significantly high Self Concept than the sprinters & Middle distance runners. Because they set
goals and aims to give level best performance to win the Competition, where as the Sprinters concentrate on
technique at the start & finish and muscle power to give the high level of performance. It is recommended that for all
sports persons must be trained to having Self Concept to achieve high excellence in sports. The Coaches must
prepare the athletes to thinks about or perceives themselves positively before and during competition.
Recommendations:
1. This type of Study is useful to the Coaches and Physical Education Teachers to train the Students as per the
requirements of the Psychological variables for the better performance in sports.
2. Conducting a similar study, by adding other psychological factors such as goal setting, Achievement motivation,
concentration and imagery.
3. Doing a similar study on Individual and Team Games.Comparing anxiety and Achievement motivation between elite
and non-elite athletes in different regions.
References:
Wikipaedia Sprints, Middle and Long distance running, athletics.
Sinha’s comprehensive Anxiety Test (SCAT), Natuional Psychological Corporation.1971.
Kinikema K. and Harris J.(1992) sport and the mass media, Exercise and Sport Science reviews 20,127-159.
McEvoy A. and Erikson E.(1981) Heroes and villains: A Conceptual strategy for assessing their influence.sociological
factors, 14,111-122
Gardner, Frank (2007). The Psychology of Enhancing Human Performance. Spring Publishing Co.
Dimension Group A B C Total
Mean 153.38 164.54 173.82 163.91
S. D. 20.50 11.05 5.25 16.09
S. E 1.67 0.90 0.42 0.75
Self Concept
N 150 150 150 450](https://image.slidesharecdn.com/fcfae7cb-afca-4125-9408-72091dd30730-161107043714/85/International_Journal_Volume_23-11-320.jpg)
![5
ISSN 2231-3265
International Journal of Health, Physical Education and Computer Science in Sports
Volume No.23, No.1,pp5-8
Journal Impact Factor 3.565
A Peer Reviewed (Refereed) International Research Journal
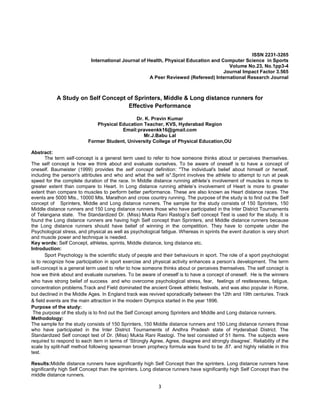
Comparison Between Genders On Total Mood Disturbance (Tmd) Prior To Competition
Lim Boon Hooi
Sports Centre, University of Malaya, Malaysia
E-mail: lboonhooi62@gmail.com
Abstract
The promotion of mood regulation strategies among athletes is not new but evidence about the efficacy of such
strategies in sport is scarce. The objectives of the current study were to examine the effects of Autogenic Relaxation
on regulating Total Mood Disturbance (TMD) and to investigate gender differences on TMD Responses to Autogenic
Relaxation prior to competition. Participants were youth state volleyball players (N = 48; male = 24, female = 24; M
age = 16.35 yr., SD = .89 yr.) The abbreviated version of the Profile of Mood States (POMS) was employed to
examine the TMD Scores on pre and post-intervention. The intervention was carried out twice a week, 30
minutes/session for 8 weeks before training. A paired-samples t-test indicated that mean scores of the TMD were
significantly lower during post-intervention, t(47) = 9.25, p <0.05. Results of this study revealed that male players
reported significantly lower, t(46) = -2.23, p<0.05 on post-intervention TMD Scores compared to female players.
Standard Autogenic Training appears to be useful procedure to induce significant changes on TMD responses prior to
competition in current study.
Keywords: Gender Differences, Autogenic Relaxation, Total Mood Disturbance
Introduction
Although the promotion of mood regulation strategies among athletes is not new [1], evidence about the efficacy of
such strategies in sport is scarce. In the general psychology literature, there is a relative consensus that people tend
to monitor and evaluate their moods, and also that they develop and implement personal self-regulation strategies [2].
The effects of relaxation in mood regulation can be observed in a study of Japanese adults [3]. The researchers
reported positive effects of 10-minute relaxation exercises on general mood ratings using Profile of Mood States
(POMS). Furthermore, they observed a greater reduction in confusion and fatigue scores post-intervention in the
relaxation group compared with the control group [3].
One method of mood-management is self-regulation. It is suggested that individuals tend to actively monitor their
moods and develop self-regulating strategies to reduce negative mood and increase positive mood [4]. Autogenic
Relaxation technique has been used by many practitioners [5], the Autogenic Relaxation technique relaxes the mind
to relax the body. It uses both visual imagery and body awareness to move a person into a deep state of relaxation.
The person imagines a peaceful place and then focuses on different physical sensations, moving from the feet to the
head. The Autogenic Relaxation technique uses six “standard exercises “including self-suggestions of heaviness and
warmth on the limbs, a regular and rhythmic heart beat, coolness of the forehead, warmth in the solar plexus, and
autonomic breathing.
Previous study examined gender-related differences in the psychological response to weight reduction in 43 judoists.
The Total Mood Disturbance (TMD) score in POMS significantly increased after weight reduction only in weight
reduction group males. In the female weight reduction group, the anger and depression scores decreased after weight
reduction, and the pre-value of the TMD score in this group was relatively high [6].
Therefore, although we believe that a gender difference in response to Autogenic Relaxation also exists in athletes, no
studies have, however, examined this. To consider each gender appropriately after the Autogenic Relaxation
sessions, it is important to study whether any gender-related difference exists in the response to Autogenic Relaxation
on regulating TMD. This study attempt to gain an insight in this area that will be a benefit approaching to the sports
fielders.
Given the potential contribution of Autogenic Relaxation on regulating TMD, and understanding the nature of mood
may help athletes to reach optimal performance. Thus, the objectives of the current study were to examine the effects
of Autogenic Relaxation on regulating TMD and to investigate gender differences on TMD Responses to Autogenic
Relaxation prior to competition.](https://image.slidesharecdn.com/fcfae7cb-afca-4125-9408-72091dd30730-161107043714/85/International_Journal_Volume_23-12-320.jpg)
![6
Participants
Participants were youth state volleyball players (N = 48; male = 24, female = 24; M age = 16.35 yr., SD = .89 yr.)
competing in the Under 18 National School Sport Council of Malaysia Volleyball Tournament. They were players
selected to represent two states in Malaysia (i.e., Negeri Sembilan, Malacca) in that tournament. The participants
were fully acquainted with the nature of the study prior to giving written informed consent to participate. Their selection
was based on their availability and they are competing at the national level. Participants were assured confidentiality
regarding the data collected and their personal identity. Ethical approval for the study was obtained from the University
of Malaya ethics committee.
Instrument
The abbreviated version of the POMS [7] consists of 30 items. The participants rated the 30-items using the ‘‘Right
Now’’ response set on a five-point scale ranging from 0 (Not at all) to four (Extremely) and generated six subscales of
Tension, Depression, Anger, Fatigue, Vigor, and Confusion. The scores from the six subscales were aggregated by
summing the five negative mood scales, subtracting vigor, and adding a constant of 20 to avoid negative scores; this
yielded an overall TMD. Higher TMD Scores indicated more negative mood states. The POMS is one of the most
commonly used measures of mood in exercise research [8] and has demonstrated acceptable reliability and validity
with a variety of populations [7].
Procedures
Permission to conduct the study was obtained from the relevant authorities. Specifically, permissions to involve
players in the study were obtained from the Sport Unit, State Education Department, team managers and coaches
from the participating teams. Furthermore, the study protocol was approved by the Research Ethics Committee
(Human) of the author's institution.
Pre-Intervention measures of mood states were obtained on-site during training session 8 weeks prior to official
competition. The intervention used in this study was the Standard Autogenic Training. It usually takes 8 weeks to learn
the technique, and home practice of the exercises is encouraged [9]. All the 8 weeks training sessions were carried
out at the meeting room of training venue, and it were assisted by the Sport Psychologist from National Sport Institute
of Malaysia.
The intervention was carried out twice a week, 30 minutes/session for 8 weeks before their sport skill/technical
training. After completion of the 8 weeks Standard Autogenic Training, the participants were assessed again on the
mood states one day prior to competition at the competition venue. Sessions were conducted in a meeting room with
the air conditioner temperature was set at 25○
C. Participants were seated approximately one meter from each other.
Statistical Analysis
Paired-samples t-test was employed to compare the significant difference on the mean of TMD between pre and post-
intervention for the whole group. An independent samples t-test was used to determine the gender differences on
TMD responses to Autogenic Relaxation prior to competition. Raw data were converted to corresponding t scores.
The significant value was set at P<0.05. For all statistical analyses, SPSS 19 was used.
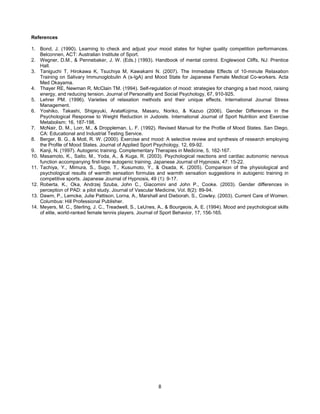
Results
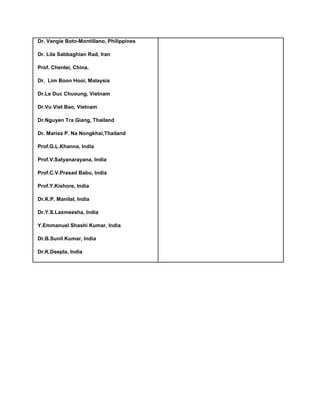
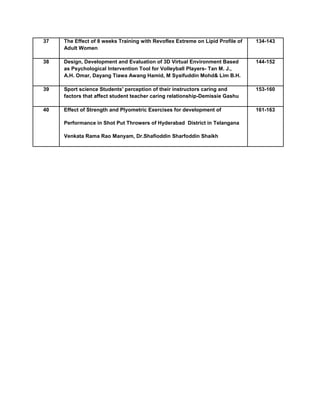
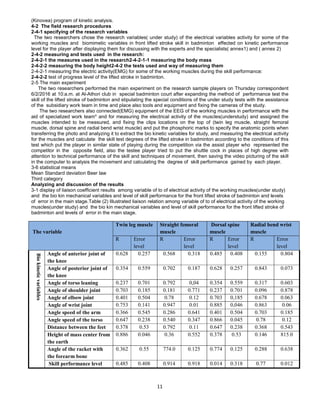
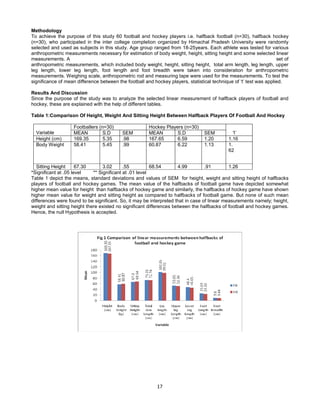
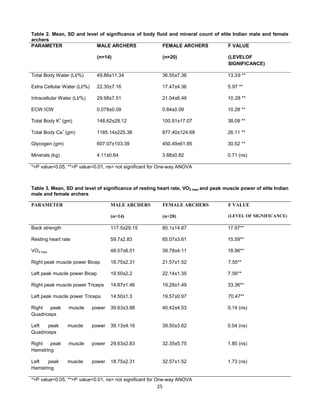
Comparison of the TMD mean Scores between Pre and Post Interventions for the whole group was presented in
Table 1. A paired-samples t-test indicated that mean scores of the TMD were significantly lower during post-
intervention (M = 30.75, SD = 2.97) than pre-intervention (M = 36.31, SD = 2.87), t(47) = 9.25, p < .001.
Table 1: Comparison of TMD Mean Scores between Pre and Post Interventions for the Whole Group
Session
TMD
Mean (SD)
t df Sig. (2-tailed)
Pre-Intervention
36.31 (2.87)
Post-Intervention
30.75 (2.97)
9.25 47 .001](https://image.slidesharecdn.com/fcfae7cb-afca-4125-9408-72091dd30730-161107043714/85/International_Journal_Volume_23-13-320.jpg)
![7
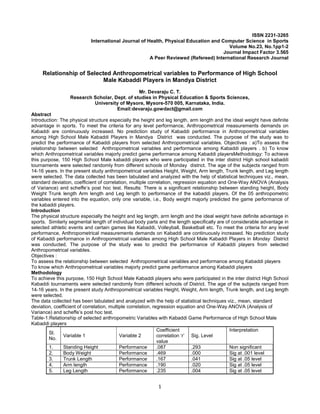
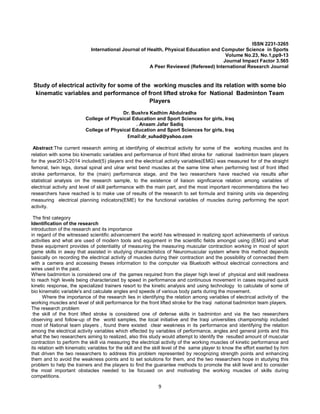
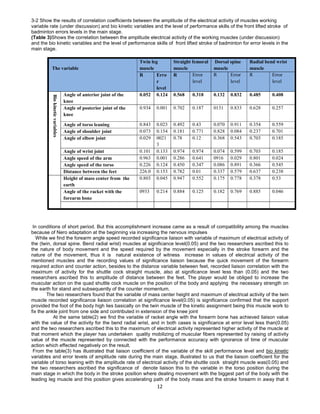
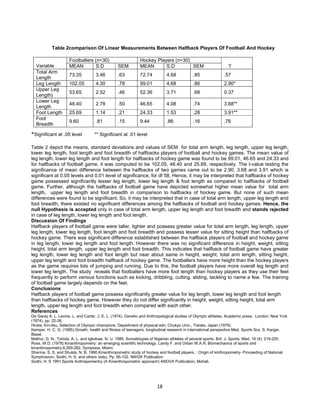
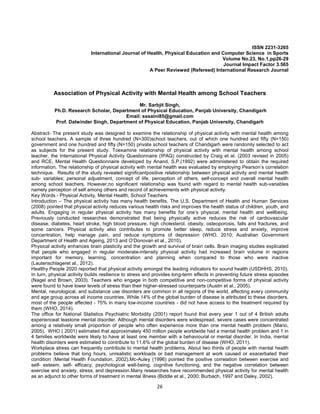
Levene's test for homogeneity showed that the assumption of equality of variance between genders on the pre-
intervention mean scores of TMD was not violated, t(46)= 0.96, p>0.05.
The mean and standard deviation of TMD Scores between gender on Pre and Post Interventions are presented in
Table 2.Table 2: Mean and Standard Deviation of TMD Scores between Gender on Pre and Post Interventions
TMD Scores
Session Male
Mean (SD)
Female
Mean (SD)
t-value df Sig.(2-tailed)
Pre-
Intervention
36.71 (3.18) 35.92 (2.54) 0.96 46 0.35
Post-
Intervention
29.83 (2.50) 31.67 (3.17) -2.23 46 0.03
An independent-samples t-test indicated that the TMD mean Scores of the male players were significantly lower than
the female players during post-intervention, t(46) = -2.23, p<0.05.
Discussion
The first objective of the current study was to examine the effect of Autogenic Relaxation on regulating TMD Scores
prior to competition. The findings of the study indicated that TMD mean scores decreased from pre-intervention
(M=36.31 ± 2.87) to post-intervention (M=30.75 ± 2.97) for the whole group regardless of gender. It revealed that
significant difference of TMD mean scores, t(47) = 9.25, p < .001 between pre-intervention and post-intervention. This
result resemble those of previous studies by Masamoto [10] & Tachiya [11], and thus, it can be stated that the present
study illustrates the reduction on post-intervention TMD scores prior to competition typically brought about by
Autogenic Relaxation. Current results showing that Autogenic Relaxation is an effective self-regulation strategy lend
support for previous research on self-regulation strategies used by the general population [4].
In the current results, the TMD Scores significantly lower in male players, t(46) =-2.23, p<0.05 than the female players
during post-intervention. The result replicates the earlier findings of Roberta [12] where despite the similarity in
disease severity, females are reported to have greater TMD than males. Females have more TMD due to reason
quoted by Dawn [13] that cognitive and personality styles may affect mood. Family and culture bound traditions
regarding female roles emphasize responsibility toward family over self and self-direction, physical expression in work
and play. This result replicates the earlier findings that lower TMD in males when compared to female competitors [14]
in the world- ranked tennis players. However, the findings of this study contradict previous study which examined
gender-related differences in the psychological response to weight reduction in 43 judoists, the TMD scores in POMS
significantly increased after weight reduction only in weight reduction group males.
The male athletes in the present study displayed lower TMD Scores than female athletes one day prior to competition;
gender did influence TMD responses to Autogenic Relaxation. This finding preclude practical usage but indicate that
future researchers will need to consider gender when examining pre-competition TMD and implementing
psychological intervention, females need more time to practice the Autogenic Relaxation to help them handle TMD
responses more positively.
Practitioners and researchers have traditionally neglected examining individual differences for improving the coping
skills of athletes. With respect to the present study, acknowledging the unique needs and coping tendencies of
athletes as functions of their gender in regulating TMD prior to competition. Thus, using the POMS to ask youth
volleyball players to report how they feel “right now” could reveal higher TMD scores. More research with youth
athletes will further clarify these findings.
In conclusion, the psychological preparation of volleyball players must be taken into consideration during the coaching
process. Professional help and programming of the psychological preparation of the athletes and observation of their
emotional conditions before and during a game is necessary to regulate TMD and contribute to the high effectiveness
of volleyball players in Malaysia. We recommend the inclusion of Autogenic Relaxation training programs in the
training regimen for youth volleyball players in order to help them better deal with their experience of regulating TMD
prior to competition.](https://image.slidesharecdn.com/fcfae7cb-afca-4125-9408-72091dd30730-161107043714/85/International_Journal_Volume_23-14-320.jpg)
![14
ISSN 2231-3265
International Journal of Health, Physical Education and Computer Science in Sports
Volume No.23, No.1,pp14-15
Journal Impact Factor 3.565
A Peer Reviewed (Refereed) International Research Journal
Comparison Of Athletic Ability Among Chasers, Dodgers And All rounder Female Kho-Kho
Players
Mr. Channappa C,
Physical Education Teacher, DMS, RIE, Mysuru.
Email:channappa.channu@gmail.com
Introduction
Excellence in sports and sports competitions is not a normal phenomenon. One needs to train over years to learn
skills and perform at higher levels of competition. Superior performance in sports competitions also depends upon
many factors. Generally classified, the aspects could be physical, mental, emotional and social. One of the importance
aspects of sports performance is physical and motor characteristics and fitness. Athletic ability will be considered in
relation to physical fitness, as the components involved in physical fitness like strength, endurance speed, flexibility
etc. also involved in athletic ability.Kho-Kho, an indigenous game, is one such area which requires the players to have
high levels of athletic ability, where some fundamental skills and feats are to be performed by every player. The
performance of defensive and offensive skills undoubtedly demands the players to have a wide range of athletic
abilities like strength, power, speed, co-ordination, balance and endurance.This study is carried out to the athletic
ability among female kho-kho plays about their athletic abilities levels so that they can detect the weaknesses of their
athletic ability fitness; and the coaches can help the athletes to obtain the peak athletic performance in their future
competitions by adopting athletic ability fitness plans.
Statement of the Problem
The purpose of the study was to find the comparison of athletic ability among Chasers, Dodgers & All-rounder female
Kho-Kho players who were represented in various clubs of Mysuru and Mandya district.
Limitations:
The subjects of the present study belonged to various kho-kho clubs of Mysuru and Mandya district with different
training background.
Motivation of the subjects at the time of test performance was a limitation of the study.
The study has limited to have standardized tool for the study.
Delimitations
The study was delimited to the measurement of Athletic ability. The study was delimited to female Kho-Kho players
[Chasers (N=60), Dodgers (N=20) & All-rounder (N=40)]The study was delimited to 120 female subjects form only
certain clubs in Mysuru and Mandya district. The study was delimited to only to the administration of cozens’ athletic
ability test. The study was delimited to subjects in the age group of 18-25years.
Hypothesis
For the purpose of the present study, it was hypothesised that there may not be any significant differences in the
mean performance scores of athletic ability among Chasers, Dodgers & all-rounder female Kho-Kho players.
Review Of Related Literature
Premchand was conducted a comparative study of physical qualities of offensive and defensive football
players of college level. He compared agility, speed, strength, endurance and height, weight in offensive and
defensive players and concluded that (1) defensive players were heavier, taller and had more muscular power than
offensive players, (2) offensive players were faster and had more endurance than defensive players, (3) there was no
significant difference between offensive and defensive soccer players in agility.
Cassell A. M. Measured and compared the motor abilities and physical characteristics of 111 collegiate
soccer players by position of play. The motor ability items included an ability test, a leg-power test, a cocker ability
test, an upper body strength test, a test for speed and a test for endurance. The result showed that a difference
existed in the endomorphic component of somato type with half-back significantly (p.05) lower than all the other
position. Difference (p. 05) were also found in the height, with goal keeper and fullbacks taller than forwards. In motor
abilities, differences (p. 05) were found in leg power, with fullbacks more powerful than forwards soccer, ability with
half-backs more skilful than goal keeper. No differences were evident in the abilities of agility, upper body strength and
endurance.](https://image.slidesharecdn.com/fcfae7cb-afca-4125-9408-72091dd30730-161107043714/85/International_Journal_Volume_23-21-320.jpg)
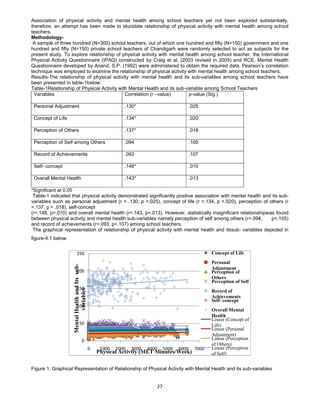
![15
METHODOLOGY
Selection of Subjects
120 female Kho-Kho players [Chasers (N=60), Dodgers (N=20) & All-rounder (N=40)] who are represented by various
women Kho-Kho clubs of Mysuru and Mandya districts were selected as subjects for the study. The age of the
subjects ranged between 18 to 25 years
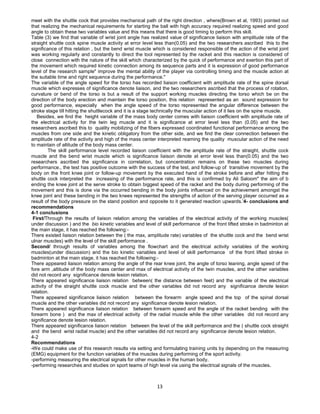
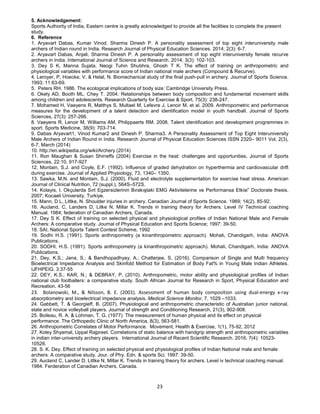
Analysis and Interpretation Of Data
A significant difference in the mean performances scores of athletic ability among chasers, dodgers and all-rounder
female Kho-Kho players was tested using the ‘F’ test through one-way analysis of variance (ANOVA) bases on a
completely randomized design.
Table - 1
S.V D. F S. S M.SS F-ratio
Athletic ability
Error
2
117
32.624
1898.266
16.312
162.27
F=0.101<1
Total 119 19017.890
P>0.05 at 2 and 117 degrees of freedom.
Table -1 that the ‘F’ ratio calculated was 0.101. The ‘F’ value calculated was found to be lesser than the table value, at
2 and 117 degrees of freedom at 5% level of significance (P > 0.05). Hence, we accept the null hypotheses formulated
in the present study. The ‘F’ value obtained does not established any statistical significance.
Conclusions
There was no significant difference in the mean performance scores of athletic ability among Chasers,
Dodgers & all-rounder female Kho-Kho players: (P>0.05) or that there was no significant difference in athletic ability
among Chasers, Dodgers & all-rounder female Kho-Kho players.
Reference
Adraham, R “Comparative study of physical fitness of high Jumper and Long Jumper”, Unpublished Master’s theses,
Y.M.C.A college of Phy., Edu., Madras, 1974.
Barrow, Harold M and Rosemary McGee. “A Practical Approach to measurement physical education”. 2nd
edition
philodelphia lea and Febiger. 1973.
Cureton Thomas K. “Physical Fitness of Chapion Athletes”, Urbana University of Illinois press, 1979.
Cassel Allen McGarry. “A Comparison of motor abilities of physical characteristics of collegiate soccer players by
position of plya”. Dissertation abstracts international, 39 February, 1979.
Mathews Donald. K. “Measurement in Physical Education, Fourth Edition” Philadelphia W.B. Sounders company,
1973.
Premchand, “A comparative study of physical qualities of offensive and defensive football players of college level”.
Unpublished master’s project, Lakshmibai National College of physical education Jiwaji University Gwalior, 1977.](https://image.slidesharecdn.com/fcfae7cb-afca-4125-9408-72091dd30730-161107043714/85/International_Journal_Volume_23-22-320.jpg)
![19
ISSN 2231-3265
International Journal of Health, Physical Education and Computer Science in Sports
Volume No.23, No.1,pp19-25
Journal Impact Factor 3.565
A Peer Reviewed (Refereed) International Research Journal
Body composition profile of elite Indian male and female archers: a comparative study
1
Monalisa Debnath, 1
Madhurima Roy, 2
Subhra Chatterjee(nee Karmakar) & Dr. S.K.Dey*
*Dr. S. K. Dey, Senior Scientific Officer
Sports Authority of India,N. S. Eastern Center
Salt Lake CityKolkata- 700106
Email: drsk_dey@rediffmail.com
1
Monalisa Debnath, Research Fellow,
Sports Authority of India, N. S. Eastern Center, Salt Lake City, Kolkata- 700098, Email:
monalisadebnath1108@gmail.com
1
Madhurima Roy, Research Fellow,
Sports Authority of India, N. S. Eastern Center, Salt Lake City, Kolkata- 700098, Email:
madhurima.nin.icmr@gmail.com
2
Dr. Subhra Chatterjee (Nee Karmakar),
Jr. Scientific Officer, Sports Authority of India, N. S. Eastern Center, Salt Lake City, Kolkata- 700098, Email:
subhra.presi@gmail.com
Abstract
Archery, being a target sport demands attention, strength and technique. It needs unique synchronization of upper
and lower body movement in combination with muscle strength and endurance. The research study was executed
with an aim to evaluate the anthropometric and physiological profile of Indian male and female archers enrolled so as
to compare the differences in their body composition; and to correlate between the anthropometric and physiological
parameters that are significant for peak performance in archery through statistical analysis through one-way ANOVA
and Pearson Matrix Correlation respectively. 14 male and 20 female archers with an age range of 20-30 years of age
were selected through random sampling. Physical assessment included standing height, weight and BMI. Body
composition profiling was done through bioelectrical impedance (BIA) which included fat free mass (FFM), fat %, body
cell mass (BCM), muscle mass (MM), total body water (TBW), Extracellular water (ECW), intracellular water (ECW),
ECW/ICW ratio, glycogen, mineral count, total body potassium (TBK) and total body calcium (TBCa). Hand grip and
back strength (left and right) were measured using hand and back dynamometer respectively. Peak muscle power of
biceps, triceps, quadriceps and hamstring were measured using FETSYSTEMS, HOGGAN muscle tester, UTAH.
Resting heart rate (RHR) was calculated using a stop watch early morning before training. Maximum aerobic power
was assessed by predicting VO2max using beep test. There was no significant difference between the age range (p
value>0.05) of male and female archers, although that there exists a significant difference in the height, weight, FFM,
fat %, BCM, MM, hand grip strength and relative back strength of male and female subjects (p value <0.01). On
contrary, their BMI and trunk flexibility showed no significant difference (p value>0.05). It was observed that the TBW,
ECW and ECW/ICW ratio was significantly more among male archers (p value<0.01). There also exists significant
difference in the TBK (p<0.01) and TBCa (p<0.01) among them with no significant difference in their mineral count (p
value>0.05). RHR, VO2max and PMP of biceps and triceps showed significant difference among male and female
archers (p value<0.01) with no significant difference in peak muscle power of the hamstrings and the quadriceps (P
value >0.05). Findings of the present study may help to take necessary action so as to formulate the systematic
training program distinctly for archers.
Keywords: Archery, body composition, Strength, bioelectrical impedance (BIA), beep test, etc
1. INTRODUCTION
Archery, marked as one of the oldest sport is still under practise that requires greater level of concentration and
technique
[1]
. Higher scoring skill in archery is determined by the ability to precisely shoot an arrow to a given target in
a certain time span with accuracy by maintaining a stable position and posture in accordance to which bow holding,
drawing, aiming, release and follow through are very important parameters to be taken care of [2, 3, 4]
. The sequential
phases in archery represent eventual movements in the upper and lower body that can be studied through motor skill
assessment during voluntary kinematical process
[3]
.
There is not much variation in the physical and physiological characteristics of both the groups of archers i.e., recurve
and compound, although there remain some differences in the techniques of using different bows.](https://image.slidesharecdn.com/fcfae7cb-afca-4125-9408-72091dd30730-161107043714/85/International_Journal_Volume_23-26-320.jpg)
![20
Performing body skills is greatly influenced by individual’s growth, size and body structure [5, 6]
. Survey on
anthropometric measurements and body composition having direct relationship are termed very essential for
achieving higher level of performance
[7, 8]
. Archers while competing have to repeat shooting precisely for a long time
which requires distinctive attention for good performance. Hence, experienced coaches have a big role to play to train
them with physiological and physical qualities to emphasize on [9]
. Precise information on the posture, body movement
and other shooting skills can be gathered from various biomechanical apparatus. Many other internal and external
factors may affect an archer’s performance. Internal factors constitute mental and emotional condition whereas
external factors count wind, noise and other environmental conditions, which may further affect comfort feeling and
mental attention [10]
. Archers have to play outdoors at uneven environmental conditions which bring formidable
challenge to the body’s ability to control Dehydration and hyperthermia may result in strong negative effects on
exercise performance, at least when the exercise duration exceeds a few minutes [11, 12]
. Even at modest
environmental temperatures, some reduction in exercise capacity is apparent and the performance decrement
becomes progressively greater as the environmental heat stress increases [13].
Archery, also known as mental and target sport can be organized outdoors and indoors with an aim to collect highest
scores
[14]
. This game being comparatively static demands an attention, strength and endurance of the forearm,
shoulder griddle and lower body part as well [15]
. While shooting the arrow, the entire body of the archer gets involved
in the contraction of the muscle fibres to maintain balance and resistance. The contraction and relaxation
phenomenon of muscle fibres of the forearm muscles during the release of bow string is of ample importance in this
game
[3]
.Thus, archery needs unique synchronisation of upper and lower body movement to shoot an arrow to a
distinct target [16]
. The overall stability and balance of the body is dependent on leg strength in combination with
muscle strength and endurance that should also not be neglected. The bow is placed using the pressure produced
through drawing back the bow string by the archer. Along with anthropometric measures, the strength, muscularity
and endurance are important for success in archery (Longhurst, J C et al., 1981). It has been observed that hamstring
and quadriceps strengths are related to elite performance level. Scientific studies on body composition profiling of
archers are scanty and not much research evidence are available to depict the significance of anthropometric and
physiological status of archers on their sports performance. As per the literature review, not much research work has
been done on elite Indian workers except few [17]
. Hence, it is very important to explore and predict the impact of
anthropometric and physiological endowments on the overall performance in Archery. The present study was
executed with an aim to evaluate the anthropometric and physiological profile of Indian male and female archers
enrolled into systematic and scientific training programmes, to compare the differences in the results of the two
genders and to correlate between the anthropometric and physiological parameters that are significant for peak
performance in archery.
2. Methodology
2.1. Selection of Subject
Thirty four (34) archers including 14 male and 20 female with an age range of 20-30 years representing India were
selected randomly from the national coaching camp held at Sports Authority of India, Kolkata. The subjects were
considered homogenous as they belonged to almost same socio-economic status, followed similar dietary habits and
were having training under parallel climatic condition. Prior to initial testing a complete explanation of the purposes,
procedures and potential risks and benefits of the tests were explained to all the players and signed consents were
obtained from them. The players who were found to be medically fit, healthy and with no history of any hereditary and
cardio respiratory diseases, were finally selected for the present study. Before the commencement of test, all the
players were clinically examined by the physicians of SAI, Kolkata, who are specialized in Sports Medicine following
standard procedure (SAI, 1992)
[22]
. They were evaluated for various anthropometric and physiological variables in the
Human Performance Laboratory at Sports Authority of India, Kolkata.
2.2. Training Regimen:
Formulation and implementation of systematic training program was done by the qualified coaches under the
guidance of the scientific expert from Sport Science Department, SAI, Kolkata. The training regimen included practise
interval of 4 to 5 hours every day excluding Sunday, which comes around 30 hours in a week. Both morning and
evening session comprised of physical training for one hour and skill training for about two hours. The physical training
schedule includes different strength and endurance training program along with flexibility exercises. Strength and
Endurance training was also applied according to their sports specific requirement. Warm up & cool down session
before and after starting the main practice were also included in the programme. Apart from the technical and tactical
training, the players were also provided psychological or mental training session.
2.3. Physical measurements
The physical characteristics of the subjects including height (cm) and weight (kg) were measured by anthropometric
rod and digital weighing machine respectively following standard procedure [23]
. The decimal age of all the subjects
were calculated from their date of birth recorded from original birth certificate, produced by them at the time of testing.
Body Mass Index (BMI) was calculated from body height and weight (WHO, 1995). Back strength and hand grip
strength (both right and left hand) were measured by back and grip dynamometer (Senoh, Japan) respectively [13]
. The
hip and back flexion as well as extension of the hamstring muscles of the leg was evaluated by modified Sit-and-
Reach Test using a ‘Flexometer’ (Lafayette Instrumental co, USA) following the standard procedure [24]
. Hand grip and
back strength (left and right) were measured using hand and back dynamometer respectively.
The relative back strength was calculated in relation to the body weight. Resting heart rate (RHR) was calculated
using a stop watch early morning before training.](https://image.slidesharecdn.com/fcfae7cb-afca-4125-9408-72091dd30730-161107043714/85/International_Journal_Volume_23-27-320.jpg)
![21
2.4. Test for measuring VO2 max:
Maximum aerobic power (VO2 max) was assessed using an indirect method of multistage fitness test which includes
progressive shuttle run test for the prediction of aerobic fitness (Beep test) (Leger et al., 1988) from where VO2 max
was predicted [25]
.
2.5. Bioelectrical Impedance Analysis (BIA):
Body composition including body mass index (BMI), fat free mass (FFM), fat mass, total muscle mass (BCM), muscle
mass (MM), body mineral content including total body calcium (TbCa), total body potassium (TbK) and body water
spaces including total body water (TBW), extracellular water (ECW), intracellular water (ICW), ECW/ICW ratio were
measured using Bioelectrical Impedance Analysis (BIA) with a multi-frequency analyzer (Maltron Bioscan 920- 2,
Made in UK)
[22]
. Total body electrical impedance to an alternate current (0.2 mA) with four different frequencies (5, 50,
100 and 200 KHz) was measured. Measurements were taken followed by the standard testing manual of Maltron
International [23]
. Before testing, the analyzer was calibrated according to the manufacturer’s instructions. Before
taking the measurement, the players were instructed according to Heyward & Stolarczyk [13]
by the following
guidelines: 1) no heavy exercise 12 h before the test; 2) no large meals 4 h before the test; and 3) consumption of
liquids limited to 1% of body weight, or, two 8-oz. glasses of water, 2 h before the test.
The laboratory tests were performed at a room temperature varying from 23ºC to 25ºC with the relative humidity
varying between 50 and 60%. The field test was performed at the maximum temperature of about 30ºC with relative
humidity of maximum about 70-80%.
2.6. Test for peak muscle power (PMP)
Peak muscle power was measured following FETSYSTEMS, HOGGAN muscle tester, UTAH. Peak muscle power of
the biceps was measured placing the transducer on the anterior surface of the fore arm proximal to the wrist, whereas
for triceps, the transducer was placed on the posterior ulnar aspects. Peak muscle power of the quadriceps was
measured placing the transducer on the anterior surface of the lower leg proximal to the ankle whereas for hamstring,
the measurement was taken from the posterior surface.
2.7. Statistical Analysis
The data were analyzed using the Statistical Program for the Social Sciences (SPSS) version 16.0 for Windows
(SPSS Inc., Chicago, Il, USA). All values are expressed as means ± standard deviation (SD). A confidence level at
95% (p < 0.05) was considered as significant. The study variables assessed among male and female archers were
statistically analysed using one-way analysis of variance (ANOVA) and matrix of correlation coefficient was calculated
To Conclude The Inter-Variable Relationship.
3. Result
Table 1 represents the results obtained from assessing the anthropometric status of archers which shows no
significant difference in the mean age. On the other hand a significant difference in the height and weight (P<0.01)
were obtained when compared between male and female archer. But BMI was found to be statistically insignificant
though the mean value of this component was more in boys as compared to their girl’s counterparts. Fat Free Mass
was found to be more in the male archers (60.19±7.43 kg) than the female (46.06±4.31 kg), whereas the body fat %
was documented to be lower among the formers. Further the body cell mass was found to be significantly more
among males (30.66±6.00 kg) when compared with the females (23.13±4.02 kg). The Muscle mass was also recorded
to be more (27.56±4.82 kg) in male archers as compared to their females counterparts (21.69±6.21kg). Both right and
left hand grip strength was also recorded to be significantly higher among male (42.69±7.47 kg; 47±4.84 kg) archers
than females (31.94±3.92 kg; 29.66±4.87 kg, P<0.05) respectively. The relative back strength showed a significant
difference when compared between male and female archers at the level of p<0.01 whereas the trunk flexibility
showed no such significant difference when compared between these groups.
Table 2 represents the body fluid status of the male and female archers. It was observed that the total body water was
significantly more among male archers (49.86±11.34 Lt/%) than female archers (36.55±7.36 Lt/%). The Extracellular
and Intracellular Water Ratio was recorded to be significantly more among male archers (0.078±0.09) than their
counterpart (0.84±0.09, F=10.281, P<0.01). There also exists significant difference in the Total Body K+ (
F=38.086,
P<0.01) and Total Body Ca+
(F=26.113, P<0.01) among male and female archers. On contrary, the total mineral
count among male (4.11±0.64kg) and female (3.88±0.82kg) subjects doesn’t show any significant difference.
Table 3 represents the assessed values for resting heart rate, VO2max and peak muscle power among male and
female archers. It was observed that male (59.7±2.83) and female archers (65.07±3.61) showed significant difference
in their resting heart rate (15.58**). VO2max was found to be more among the male archers (48.57±6.01) than the
female (39.78±4.11; 18.91**). The peak muscle power of the right (7.54**) and left (7.56**) biceps showed significant
difference among male archers and their counterparts. Peak muscle power of the right (33.36**) and left triceps
(70.46**) were delivered better among the male archers than the females. Peak muscle power of the hamstrings and
the quadriceps showed no significant difference among the two groups (P value >0.05).
Table 4a & 4b. Pearson correlation matrix for different parameters among Indian male and female archers
Pearson correlation matrix depicted that age have positive correlation with weight (.57
*
), muscle mass (.57
*
), left hand
grip strength (.55*
), peak muscle power of right (.87*
) and left (.88**
) quadriceps; and peak muscle power of biceps
(.80*
) among male archers; whereas in females it was significantly correlated with BMI (.64**
) and fat % (.51*
). Height
has been positively correlated with body cell mass (.60*
), muscle mass (.65*
), total body potassium (.60*
) and calcium
(.61
*
) and hand grip strength of left (.55
*
) and right (.60
*
) arms among male subjects. Female’s height have shown
positive correlation with weight (.78**
), fat free mass (.77**
), body cell mass (.61**
), total body potassium (.40*
) and
calcium (.53*
), mineral (.72**
), right (.65**
) and left (.54*
) hand grip strength and relative back strength (-.45*
). Male](https://image.slidesharecdn.com/fcfae7cb-afca-4125-9408-72091dd30730-161107043714/85/International_Journal_Volume_23-28-320.jpg)
![22
archers have shown positive correlation of weight with BMI (.94**
), FFM (.90**
), fat % (.73**
), TBW (.59*
), ECW (.56*
),
ECW/CW ratio (.57
*
), BCM (.88
**
), MM (.84
**
), TBK (.89
**
), TBCa (.89
**
), hand grip strength and peak muscle power of
quadriceps of right (.65
*
; .80
*
) and left (.73
**
; .82
*
) arms respectively. Among females, weight have shown similar
correlations as in males, except negative correlation have been obtained with relative back strength (-.55*
). BMI and
FFM have shown highly significant positive correlation with fat % (.81**
; .52*
), TBW (.55*
; .66**
), BCM (.77**
; .87**
), MM
(.71
**
; .77
**
), TBK (.78
**
; .88
**
) and TBCa (.78
**
; .86
**
) among male archers respectively. Female archers have shown
strong positive correlation of BMI and FFM with fat % (.86
**
; .64
**
), BCM (.72
**
; .67
**
), TBk (.67
**
; .50
*
), TBCa (.72
**
;
.70**
) and glycogen (.48*
; .71**
) respectively. TBW and ECW have shown positive correlation with ICW and glycogen
both among male (.89**
, .88**
; .92**
, .85**
) and female (.52*
, .88**
; .49*
, .76**
) archers respectively. The ECW/ICW ratio
has been positively correlated with BCM (.75
**
), MM (.67
**
), TBK (.75
**
) and TBCa (.76
**
) among males whereas,
positively correlated with mineral count (.71**
) and negatively correlated with peak muscle power of right hamstring (-
.75*
) among female archers. BCM have shown significant positive correlation with MM (.95**
), TBK (.99**
), TBCa (.99**
)
and right (.66*
) and left (.68**
) hand grip strength among males. Same correlation have been plotted for female archers
for MM (.72
**
), TBK (.89
**
), TBCa (.97
**
), mineral (.48
*
), glycogen (.65
**
), right (.46
*
) and left (.55
*
) hand grip strength
except relative back strength (-.61
**
) showing negative correlation. TBK and TBCa have shown significant positive
correlation with right (.66*
; .72**
) and left (.69**
; .75**
) hand grip strength among male archers. On contrary, for females
it has shown positive correlation with glycogen store (.45*
; .58**
) and negative correlation with RBS (-.66**
; -.48*
). Male
archers have shown positive correlation between glycogen and peak muscle power of right (.81
*
) and left (.77
*
)
quadriceps. Among females mineral count is found to have positive correlation with right (.56
*
) and left (.55
*
) hand grip
strength whereas negative correlation with relative back strength (-.50*
). Male archers have shown positive correlation
of mineral count with right (.70**
) and left (.70**
) hand grip strength. RHR have shown positive correlation with VO2max
both among male (.88
**
) and female archers (-.67
**
).
4. Discussion And Conclusion
Studying the relative importance of various vital parameters responsible for peak performance appraisal is of great
concern as it contributes to positive sports performance [3]
. Significant correlations between physique and body
structure with physical performance have been found by Gabett et al (2007)
[18]
. Anthropometric status holds ample of
importance for excelling in sports performance [9]
. The obtained anthropometric status of male and female archers
shows convincing results with the previous research done by Dey S. K. and colleagues. Body fat % also influences
physical performance mechanically and metabolically (Boileau 1997) [25]
. It is considered as an indicator of
performance among US archers with lower fat percent predicting better performance, distinctly applied for males
[26]
.
Our study revealed statistical differences in many of the anthropometric and physiological parameters which are also
supported by a previous study done by Shyamal and Rajpreet [27]
. A study done on various sports person documented
archers to have the highest fat % than other respective fields. Our result also revealed convincing results with male
and female archers evaluated with an average of 19.18% and 22.71% body fat respectively. Furthermore, fat % was
tabulated to be significantly lower among males showing convincing results as documented in previously done studies
[28]
. Previous research has registered female archers with highest body fat % alongwith shooting, lawn bowl and
tenpin. Male archer’s alongwith tenpin recorded BMI above the normal range. Although, BMI is not considered as an
efficient indicator of fatness since athletes usually have more muscle mass than the general masses
[29]
. Although, our
study have found that the BMI of male (24.74kg/m2
) and female (22.97 kg/m2
) archers were under the normal range.
Earlier research work revealed that VO2 max among archers in comparison with general population shows no
statistically important difference. VO2max have been found to be more among other sports athletes than those involved
with archery
[30]
. The right hand grip strength was found more among females than males whereas the later showed
more of left hand grip strength. On contrary, Lander et al (1983) documented in their study that both male and female
archers showed greater arm extension in dominant right arm than non-dominant left arm [31]
.
General training regimen including running, swimming and general movement specific weight training are marked
sufficient to increase the strength and endurance
[32]
. Archery does not elicit much importance on physical size,
although physical strength and general fitness are given more importance by elite-level archery competitor [3]
. Archer’s
arrow shooting is based on their positioning on the target that further depends upon psychological, physical and
environmental factors that should be assessed [33]
. In archery, upper body limbs especially shoulder elbow, wrist and
fingers plays major roles for both muscular strength and endurance that affect archer’s performance and success
[34,
35]
. In concise, out study depicts that there was no significant difference between the age range (p value>0.05) of male
and female archers, although that there exists a significant difference in the height, weight, FFM, fat %, BCM, MM,
hand grip strength and relative back strength of male and female subjects (p value <0.01). On contrary, their BMI and
trunk flexibility showed no significant difference (p value>0.05). It was observed that the TBW, ECW and ECW/ICW
ratio was significantly more among male archers (p value<0.01). There also exists significant difference in the TBK
(p<0.01) and TBCa (p<0.01) among them with no significant difference in their mineral count (p value>0.05). RHR,
VO2max and PMP of biceps and triceps showed significant difference among male and female archers (p value<0.01).
Whereas, PMP of the hamstrings and the quadriceps showed no significant difference among the two groups (P value
>0.05).](https://image.slidesharecdn.com/fcfae7cb-afca-4125-9408-72091dd30730-161107043714/85/International_Journal_Volume_23-29-320.jpg)
![30
ISSN 2231-3265
International Journal of Health, Physical Education and Computer Science in Sports
Volume No.23, No.1,pp30-36
Journal Impact Factor 3.565
A Peer Reviewed (Refereed) International Research Journal
Effects Of A 12-Week Resistance Training Program On Biomotor Abilities Of Malaysian
Sports School Athletes
Entheran Subramaniam
1
& Lim Boon Hooi
2
1
bukit Jalil Sports School, Kuala Lumpur, Malaysia.
2
sports Centre, University Of Malaya, Kuala Lumpur, Malaysia.
Email: lboonhooi62@gmail.Com
Abstract
Training is an integral part of any coaching program. Training refers to a systematic process with a long duration of
physical and mental exertion to improve an athlete’s qualities to produce a high performance endeavors in any chosen
sports. Consequently, any designed training program should prioritize the overall development of athletes. Thus the
primary objectives of training especially for the adolescent athletes should be to obtain a multilateral condition, to build
solid foundation, to perfect the techniques of the chosen sport, to improve the specific physical abilities, to learn
affirmative needed tactics, to create an effective relationship between the coach and the athlete, to improve biomotor
abilities, to monitor the athlete’s health status and prevent injuries, and to enrich the athlete’s knowledge related to the
training. The purpose of this study was to investigate the effectiveness of a 12-week resistance training program on
biomotor abilities of Malaysian Sports School athletes. Sixty four adolescent athletes aged between 13 to 15 years
(14.32 ± 0.79) old boys and girls student athletes of the Bukit Jalil Sports School, Kuala Lumpur, Malaysia who were
randomly assigned to 2 groups based on sexual maturation status. The experimental group (n=32) performed a
resistance training via a 10 station circuit training using medicine ball twice weekly for 12 weeks whereas, the control
group (n=32) performed their normal training session for the same duration. All the participants were tested on seven
biomotor abilities for pre and post intervention. SPANOVA analysis revealed a significant difference in all the seven
biomotor abilities (p<.000) from the pre-test to post-test of the experimental group compared to the control group with
a significant level of p<.05. The findings indicated that the 12-weeks resistance training program had effectively
elicited a statistically significant effect in improving and enhancing all the seven biomotor abilities of the adolescent
athletes of the experimental group compared to the control group. In conclusion the designed resistance training
program resulted in significant effect in all seven biomotor abilities of the Malaysian Sports School athletes. Therefore
the designed resistance training program should be able to assist the Malaysian coaches who aspire to develop
adolescent athletes in terms of coaching, training and enhancing the biomotor abilities of athletes.Keywords-circuit
training; adolescent; sexual maturation
Introduction:Training is an integral part of any coaching program. Training refers to a systematic process with a long
duration of physical and mental exertion to improve an athlete’s qualities to produce a high performance endeavors in
any chosen sports. Theory and practices of the designed training programs are pertinent to be based on scientific
findings and the principles of humanism which has be in the centre of a coach’s philosophy, which can be expressed
with the following sentence: "Athlete First, Victory Second". Even though striving to win has always been important,
but the athletes’ personal development is more pertinent [27]. And with increasing participation of children in a wide
variety of youth sports across the sports and games spectrum, there is a significant need for a better physical
preparation to prevent sport-related injuries. Thus resistive strength training program has the most potential of any
physical activity that could address this need. As a result, resistance training has become a primary component of
athletic condition, injury prevention, rehabilitation, and general fitness program and it requires the consideration of
several factors including intensity, frequency, and volume of exercise, thus this leads to the great potential for
improving a child’s ability to tolerate sport stresses, improve biomotor athletic performances and avoid sports related
injuries [11,32]. Although many coaches are quite competent at designing seasonal training programs, it is essential to
look beyond a particular season and plan for the long term development of an athlete [12]. Resistance training is
defined as a specialized method of conditioning that involves the progressive use of wide range of resistive loads and
a variety of training modalities that includes usage of free weights, body weight, medicine balls, elastic tubing, and
weight training machines as means to increase one’s ability to exert and resist force [3,39]. Thus, resistance training
for young athletes has become one of the most popular and rapidly evolving modes of enhancing athletic
performances. Although early studies questioned both the safety and the efficacy of resistance training, however
recent evidence indicates that both children and adolescents can increase muscular strength due to resistance
training, and the increase in strength is largely related to the intensity and volume of loading and appears to be the
result of increased neuromuscular activation and coordination and training induced strength gains are reversible when](https://image.slidesharecdn.com/fcfae7cb-afca-4125-9408-72091dd30730-161107043714/85/International_Journal_Volume_23-37-320.jpg)
![31
the training is discontinued. Hence, with proper supervision and appropriate designed program, young athletes
participating in resistance or strength training can increase their strength. Previous studies, literature reviews and
reports indicated that regular participation in youth resistance or strength training program increases muscle strength,
local muscular endurance [25], improve local muscular endurance, enhance bone mineral density [42], and reduce the
risk of injuries in sports and recreational activities [7,21]. Resistance training has shown to improve sport
performances, used in preventing injuries & strengthening muscles in rehabilitation of injuries, improve overall health
by increasing maximal oxygen intake, alter body composition, increases overall muscle strength and motor
performance [5,7]. Children as young as eight old can participate safely in proper supervised resistance training and
result have shown improvements in strength and coordination [45]. Therefore often the best way to include some
strengthening exercises in the overall program training of young athletes is to set a circuit training or series of
exercises to go through two or three times per week. Circuit training develops strength and endurance, thus plays a
role of an appropriate form of training for most sports and it can be adjusted to suit age, fitness and health of the
athlete, and the circuit training exercises are simple enough to make each athlete feel a sense of achievement in
completing them, thus offering a wide range of exercises to select from which will maintain the athlete’s enthusiasm. In
additional to these health benefits, resistance training has potential better tolerated by youth because of its `circuit’
format which is characterized by short periods of physical activities interspersed with brief rest periods between sets
and exercise which has been observed to be more typical of how children move and play and how a sport is played
[19,20]. Previous studies indicated that resistance training via circuit training using either untrained or recreationally
trained athletes had effectively improved and enhanced strength gains in bench press, seated row and squats [49],
sprint-agility and anaerobic endurance [47], improved strength cardiovascular and muscular fitness in six selected
FITNESSGRAM tests [18], improved VO2 max by 18% which is similar to the gains produced by traditional aerobic
programs and increased strength by 20% [38], enhanced leg power to about 14.2% to 24.5% [23], yielded 55% to
74% strength gains after 8 weeks of training [25], increased strength by 12% to 55% after 10 to 12 weeks of training
[15], and strength gains [46]. However, the existing resistance training literature focusing on adolescent based sexual
maturation status and the effects of resistance training intervention program on adolescent and sexual maturation are
limited It is unclear if the resistance training as an intervention training program via circuit training that incorporated a
mental skill training has any effect if imposed upon adolescent athletes based on sexual maturation status, thus raises
questions regarding the recommendations of the per said training modalities and intervention program for active
adolescent athletes. Consequently more research concerning sexual maturation status and resistance training
program via an intervention program, and how this intervention training program affects the biomotor abilities of
adolescent and youth athletes are paramount as to provide vital information for coaches who are coaching these age
group athletes.Thus the main purpose of the study is to establish the effectiveness of a 12-week resistance training
intervention program on the biomotor ability performances based on sexual maturation status of Malaysian Sports
School athletes and to provide mechanistic (empirical) and practioners (practical) evidence based recommendations
that can be utilize by the coaches, fitness trainers, conditioning experts, physical educators, parents, and interested
individuals to enhance the overall development of an athlete and athletic performances level of the athletes involved in
sports especially the adolescent athletes in Malaysia. Thus, the aim of this study is to enlist feasible and realistic
perspective regarding resistance training intervention program in order interventions can be designed and
implemented successfully by coaches to develop, improve and enhance the sporting performances of athletes namely
the Malaysian aspiring adolescent athletes to realize their potential in their chosen sports.
Method
PARTICIPANTS:A total of seventy, males (n=40) and females (n=30) were engaged for this study from a Malaysian
Sports School aged between 13 to 15 years old who have novice level experience of resistance training and are of
various sports namely, Track & Field, Netball, Field Hockey, Basketball, Squash, and Cricket, and following baseline
testing the subjects were randomly assigned to either experimental group, resistance training using medicine ball
(RTUMB) or control group (CON) based on sexual maturation status. Participants were volunteers and were informed
of the experimental risks and the research was approved by Ministry of Education of Malaysia and Internal Research
Committee of University of Malaya Sports Centre. All the testing and training procedure were fully explained, and
written parental consent was obtained for each participant who agreed to participate in the study due to the age of the
participants which is below 18 years old. Six participants were excluded from the study due to injuries not related to
the study. Subsequently, all subjects completed a medical screening form. The characteristics of the remaining 64
subjects who completed the study are as in Table 1.
Table 1:Participants Characteristics: Group Mean±SD
Experimental Group Control Group t-test p-values
Participants (n) 32 32
Age (years) 14.49 ± 0.78 14.37 ± 0.81 t64 = .242 .624](https://image.slidesharecdn.com/fcfae7cb-afca-4125-9408-72091dd30730-161107043714/85/International_Journal_Volume_23-38-320.jpg)
![32
Height (cm) 1.70 ± 8.17 1.67 ± 5.34 t64 = 5.280 .025
Weight (kg) 60.23 ± 1.10 57.28 ± 9.90 t64 = 1.122 .293
Sexual Maturation
(pre-PHV or post-PHV)
1.48 ± .51 1.51 ± .51 t64 = .000 1.000
Instrument
The instruments utilized in this study consisted of Sexual Maturation Status which was determined based on a
maturation index that was calculated using the Mirwald and colleague equation. This technique is a non-evasive and
practical method of predicting years from peak height velocity (PHV) as a measure of maturity onset using
anthropometric variables, thus avoiding ethical and technical complexities found in other techniques [36], and the
seven biomotor abilities test administered to gauge the effectiveness of the resistance training intervention program
were 50-yards Dash (50-D) for speed [2], Sit & Reach (S&R) for flexibility [2], T-Drills (TD) for agility [41], Seated Two-
Hand Chest Pass Medicine Ball Put (STHMBP)for power [32], (a six pound medicine ball-Body Solid Medicine Ball,
Champ Sports, USA was used for the test), Half Squat Jump (HSJ) for muscular strength [30], Modified Sit-Ups (MS)
for abdominal strength [1], and Multistage 20M Shuttle Run (MSR) for aerobic capacity [35], and the Barnet, Chan and
Bruce equation was used to calculate and predict the estimated VO2 max of the subjects based on the score of the
MSR as this equation yields a better and appropriate results due to the considerations given to the gender and age
aspects of the participants involved [10]. All the biomotor abilities tests were done for pre and post intervention and
were conducted at the school’s gymnasium except for the 50-yards Dash test was held at the Malaysian National
Sports Council’s outdoor synthetic track surface.
Procedure
Testing-Participants underwent familiarization sessions that were designed to improve exercise technique, to ensure
consistent and accurate biomotor athletic performances during testing and training. Subsequent to familiarization, pre-
tests was conducted before the commencement of the training phase. All participants were tested on seven selected
biomotor abilities tests for pre and post intervention, and were carried out at least 24 hours after the last training
session to minimize the effects of fatigue on the results. Thus, it correlates with the purpose of this study which
focuses on the effects of the designed resistance training intervention program on biomotor abilities.
Training load-The prescribed amount of repetition or training load for each exercise were determined by the repetition
maximum (RM) test based on the maximum repetition of effort the participants could executed within 60 seconds
(1RM) with the rest between the test was set at 5 minutes permitting an adequate amount of time for recovery for all
the selected exercises [8,14] using the medicine ball (2kg for males and 3kg for females) [29,31].
Nevertheless, the repetition maximum test was done earlier before the commencement of the training intervention
program and the amount of repetition the participants needed to execute for each exercise was recorded.
Subsequently, repetitions for each exercises for each station of the circuit training was then calculated based on 70%
maximal motions load of 1RM test. Although, traditionally circuit training is considered to be a compromise between
aerobic and strength training, and 8-12 repetitions per set are generally recommended to elicit improvements in
muscular strength and endurance as well as muscle hypertrophy [3,26], however resistance or strength training that
uses higher intensity loads with longer rest periods, usually 60-90% of 1RM with 1-5 minutes of rest developed greater
strength [4,39].
Circuit Training Protocol-A 10 station circuit training with the loading of the main muscle group changes using varied
selected exercises and the participants move from one exercise station to another in a sequence upon completing the
calculated repetition. The participants performed 1-3 sets of calculated repetitions (i.e., calculated repetitions + 1-3
added repetition divided by 2 for 1 to 3 sets) based on the prior 1RM test on the subset of upper body, core muscle,
and lower body exercises using the medicine ball, for the designated sessions accordingly. The participants were
allowed to rest for 60-90 seconds [6] between exercises with exercises at each station are done at 70% maximal
motion based on prior 1RM test of concentric and eccentric muscle actions with a slow to moderate intensity that
would elicits strength gains due to the nature of the intervention training program, and the age of the participants
involved, thus adapting to the principle of progressive overloading [51,52], with the rest interval between sets is 3-5
minutes is likely enough time to uptake H+
and delay fatigue, then in turn likely will allow participants in the age
specified for the study to complete the set repetition and volume of training, therefore improve and enhance strength
gains [3,8]. Each exercise station within the circuit is numbered and the participants worked in pairs and progresses
from one station to another in sequence, completing a prescribed repetition of workout at each station which is
recorded and read aloud by the partner-B to ensure the exercising partner-A will execute the calculated number
repetition that needed to done in each exercising station, before moving on to another station, i.e. from station 1 to
station 2 and so upon completion of the 10 stations in the circuit, thus completing one circuit or one set of circuit
training than it’s the partner B’s turn to repeat the training with the assistance of partner A. The set rest for the
performer is when he is assisting his or her partner doing the training with the medicine ball by counting the partner’s
targeted dose. Thus, the rest is actually is an active rest, between 3-5 minutes upon completion of all the 10 stations,](https://image.slidesharecdn.com/fcfae7cb-afca-4125-9408-72091dd30730-161107043714/85/International_Journal_Volume_23-39-320.jpg)
![33
thus complying the prerequisite of rest needed when training for strength gains [3,32,50,51], and in accordance with
the progressive overloading that is the continuous increase of workload on the body, tolerance in continuously
increasing charges of which is imminent for progress in a program, thus the body continuous to adapt as long as it is
given stimuli of a higher workload than of what it is used to. Therefore in the current study, after every three weeks, or
six sessions or for every ten sets of training a new RM test was conducted and a new score is gathered, and a new
amount of repetition was calculated based on 70% maximal motion of 1RM test that needed to be exercised at each of
the 10 stations, and the training sessions progressed as in the previous stage and so on for 12 weeks upon
completion of the current research [34,44].
Resistance Training Program-After baseline measurements, participants were randomly assigned to two groups-one
experimental group (RTUMB) (n=32) and one control group (CON) (n=32), based on sexual maturation status.
Subsequent to randomization, the participants of the RTUMB group (n=32) engaged in the designed resistance
training program that was divided into three sections: 1) Warming up and stretching (jogging, dynamic stretching and
ABC drills) which lasted for 10 minutes to addresses the adequate joint mobility, neuromuscular compliance and
functional range of motion capacities which is needed to carry out the intended resistance workouts that follow suit
[48]; 2) Mental Training Drills that lasted for 10 minutes includes Relaxation Techniques (2 minutes), Positive Self Talk
(3 minutes), and Imagery Techniques (5 minutes) [28,37,40]; 3) Progressive Resistance Training via 10 stations circuit
training using medicine ball of varied exercises namely, Toe Touch, Front Raise, Split Squat, Pelvic Thrust, Reverse
Lunges, Overhead Toss, Lying Trunk Twist, Chest Press, Lunges, and Squat, Toss, Bounce and Catch using
medicine ball [10,31] twice weekly 12 weeks that lasted for 60 minutes for the resistance training that was designed to
induce overall strength gains of the experimental group participants especially in the four major muscle groups
namely, leg, abdomen, arms and shoulders, back, and trunk; and 4) Limbering Down (Striding and static stretching)
that lasted for 10 minutes. Conversely, the experimental group participants through their respective coaches were
asked to refrain from any additional resistance training other than the program prescribed by the researcher, whereas,
the control group only performed their normal training session and abstain from any kind of formal or additional
resistance training throughout the duration of the study, however both groups adhered to their normal training
program, maximum of nine sessions that accumulated to 14 hours per week. The resistance training intervention
program lasted for approximately 90 minutes per session and took place at the Bukit Jalil Sports School gymnasium.
Statistical Analysis-Subsequent to randomization division of groups, an independent t-test was used to determine
any significant difference between the RTUMB and CON group. The data from the pre test and post test was treated
and analyzed using SPANOVA or known as Split-plot ANOVA. It is a ‘mixed between-within subjects’ ANOVA, and
this two-way mixed design repeated measure analysis combines between subjects and within subjects variables in
one analysis [16]. Effect sizes (ES) too were calculated to compare the magnitude of changes in between the groups
as well as the significance of the effects of the data analysis using Rhea’s equation [43]. And α level of p<0.05 was
used as the criterion to determine either significant main or interaction effects. Analysis were conducted using SPSS
16.0 statistical program
ResultsThe summary of the pre-test and post-test means, standard deviation and the SPANOVA analysis of the
biomotor abilities are presented in Table 3. Descriptive analysis indicated the RTUMB participants’ mean scores have
improved from pre to post test, and the SPANOVA analysis test of significance too indicated that there is a significant
treatment effect on all seven biomotor abilities, in addition the Hyunh-Feldt test too confirmed that there is also a
significant interaction effect due to the treatment administered, and pairwise comparison using the Bonferroni method
too yielded a significant difference on all the tested biomotor athletic performances of the experimental group (within
group) compared to the control group (between group), the 50-yards Dash, the experimental group pre-test, post-test
means and standard deviation (6.91 ± .58), (6.48 ± .56) and control group’s (6.63 ± .54), (6.58 ± .56) and the
SPANOVA analysis on 50-yards Dash (p<.000; ESs=0.74) too demonstrates that there is a significant treatment effect,
however 50-yards Dash between group was found to be not significant (p<.536); Sit & Reach, the experimental
group’s (36.75 ± 3.27), (37.55 ± 3.28), and the control group’s (37.48 ± 5.07), (37.52 ± 5.05) and the SPANOVA
analysis shows that there is a significant intervention effect on Sit & Reach (p < .000; ESs=0.24), but Sit & Reach
between group was found to be not significant (p<.742); T-Drills, the experimental group’s (11.39 ± .75), (10.66 ± .70)
whereas the control group’s (10.90 ± .86), (10.68 ± .73), and the SPANOVA on T-Drills too shows that there is a
significant intervention effect (p<.000; ESs=0.97), however T-Drills between group was found to be not significant
(p<.211); Seated Two-Hand Chest Pass Medicine Ball Put, the experimental group’s (2.88 ± .57), (4.04 ± .70)
whereas the control group’s (3.71 ± .84), (3.97 ± .82), and the SPANOVA analysis on Seated Two-Hand Chest Pass
Medicine Ball Put shows that there is a significant effect (p<.000; ESs=2.04); Half Squat Jump, of the experimental
group’s (51.88 ± 6.62), (66.63 ± 6.36), whereas the control group’s (60.25 ± 6.70), (64.56 ± 5.85) and the SPANOVA
analysis on Half Squat Jump shows that there is a significant intervention effect (p<.000; ESs=2.23); Modified Sit-Ups,
the experimental group’s (40.19 ± 5.96), (56.25 ± 5.98), whereas the control group’s (43.56 ± 6.56), (42.06 ± 5.84) and
the SPANOVA analysis on Modified Sit-Ups too indicates that there is a significant effect (p<.000; ESs=2.69); and
Multistage 20m Shuttle Run, the experimental group’s (52.18 ± 1.98), (55.89 ± 1.44) whereas the control group (53.66
± 2.42), (52.27 ± 2.37) and the SPANOVA analysis on Multistage 20m Shuttle Run showed that there is a significant
intervention effect (p<.000; ESs=1.91).](https://image.slidesharecdn.com/fcfae7cb-afca-4125-9408-72091dd30730-161107043714/85/International_Journal_Volume_23-40-320.jpg)
![34
Table 3:Pre-test and post-test Mean, Standard Deviation, Mean Differences and SPANOVA analysis for the Biomotor
abilities tests-50-yards Dash, Sit & Reach, T-Drills, Seated Two-Hand Chest Pass Medicine Ball Put, Half Squat
Jump, Modified Sit-Ups, and Multistage 20m Shuttle Run
Experimental Group Control Group
Multivariate
Huynh-Feldt
Test
Pre-test Post-test MD Pre-test Post-test MD
F-ratio
value
at
(df=1,6
2)
P
Effect
Size
(ESs)
50-D 6.91 ± .58 6.48 ± .56
-
0.43
6.63 ± .54 6.58 ± .56
-
0.05
116.64 .000*
.074
S&R
36.75 ±
3.27
37.55 ±
3.28
.80
37.48 ±
5.07
37.52 ±
5.05
.04 73.62 .000*
0.24
TD
11.39 ±
.75
10.66 ±
.70
-
0.73
10.90 ±
.86
10.68 ±
.73
-
0.22
62.59 .000*
0.97
STHM
BP
2.88 ± .57 4.04 ± .70 1.16 3.71 ± .84 3.97 ± .82 .26 190.56 .000*
2.04
HSJ
51.88 ±
6.62
66.63 ±
6.36
14.7
5
60.25 ±
6.70
64.56 ±
5.85
4.31 132.95 .000*
2.23
MSU 40.19 ± 5.96 56.25 ± 5.98 16.06 43.56 ± 6.56 42.06 ± 5.84 -1.50 222.39 .000* 2.69
MSR 52.18 ± 1.94 55.89 ± 1.44 3.71 53.66 ± 2.42 52.27 ± 2.37 -1.39 357.82 .000* 1.91
Total 28.88 33.93 30.88 31.09 165.22 .000
Note. *p<.05
DiscussionThe findings of the study indicated that compared to a typical a non active as a control group and active
experimental group of participants in most experimental studies, the 12-week designed resistance training program
utilizing actively training participants has resulted in significant increases in mean scores in all seven biomotor ability
performances. The resistance training group demonstrated significant increase and improvements in all seven
biomotor abilities measures compared to the control group from pre-test to posttest indicating that training at varied
volume and intensity manipulation resulted in significant strength gains this then leads to improvements in biomotor
abilities thus seems to a correlation between increases in strength and performances [3]. Consequently, the results
are similar to previous studies that found that resistance training improves athletic performances [24], improvements in
sprint agility [47], where the subjects were male physical education students, improvements of the VO2 max [38],
where the subjects were college women, improvements in upper body strength [17], where the subjects were
pubescent male baseball players, and improvements in sit & reach and seated ball put [25], where the subjects were
children.Whereas, the continuum in the effect size from trivial to large may due to the lifestyle of the participants of the
current study who are student athletes of a Malaysian Sports School who actively trains nine sessions per week and
only abstain from any kind of formal resistance or strength training during the duration of the study, but they do train
other required health and motor related skills to hone their talent in the respective sports, games or events they were
identified to excel in and this is seen as the limitation of the current study whereby it was found that the 50-yards dash
test for speed, sit & reach test for flexibility, and T-drill test for agility between group was not significant. However,
based on the effect size it can be concluded that the designed resistance training program had instigated a significant
effect on certain type of biomotor ability tests in the current study namely, seated two-hand chest pass medicine ball
put test for power, half squat jump tests for muscular endurance, modified sit-ups test for strength, and multistage 20m
shuttle run test for aerobic capacity.
Nevertheless, the present study is distinct from the past research due to the combination of 2 aspects: adolescent and
sexual maturation status. Although previous studies clearly outlined the advantages of resistance or strength training,
however there’s little empirical and practical evidence related to studies with the respect to the effects of resistance
training programs on adolescents based on sexual maturation status and are limited and scare. Therefore, the
findings of this study could be useful and adopted by coaches and trainers who is working with young athletes to
improve strength, thus enhancing athletic performances. However an important word of caution is that adolescent
athletes are not encouraged to exert maximum force or support maximum load, which may trigger the risk of injury.
Conversely, training with low loads ensures the demand placed on the adolescent athlete’s anatomical structure is
less, thus improvements of their muscle and bone strength could be enhanced [13].](https://image.slidesharecdn.com/fcfae7cb-afca-4125-9408-72091dd30730-161107043714/85/International_Journal_Volume_23-41-320.jpg)
![35
As a result, the administered 12-week resistance training program significantly has induced a positive effect and
significant difference by improving and enhancing the scores on all seven biomotor abilities tests of the experimental
group participants compared to the control group. Consequently, it can be concluded and summarized that the
administered treatment-resistance training intervention program has instigated a statistically significant effect on all the
seven biomotor abilities.
References
1. AAHPERD (1980). Health related physical fitness test manual. Reston, VA: American Alliance for Health, Physical
Education, Recreation and Dance. In Miller, D. K. (2006). Measurement by the Physical Educator-Why and How
(5th
Ed.). New York: McGraw-Hill Co., Inc.
2. AAHPERD (1976). Health related physical fitness test manual. Reston, VA: American Alliance for Health, Physical
Education, Recreation and Dance. In Miller, D. K. (2006). Measurement by the Physical Educator-Why and How
(5th
Ed.). New York: McGraw-Hill Co., Inc.
3. American College of Sports Medicine. (2009). Position Stand: Progression models in resistance training for
healthy adults. Medicine and Science in Sports and Exercise, 34:687-708.
4. American College of Sports Medicine (ACSM). (2002). Progression models in resistance training for healthy
adults. Medicine and Science in Sports and Exercise, 34(2): 364-380.
5. American Academy of Pediatrics (2008). Strength Training by Children and Adolescents. Pediatrics, 121: 835-840.
6. Arent, S. M., Landers, D., Matt, K., & Etnier, J. (2005). Dose-response and mechanistic issues in the resistance
training and affect relationship. Journal of Sport Exercise Psychology, 27: 92-110.
7. Avery, D. F., Westcott, W. L., & Micheli, L. J. (1996). The effects of strength training and detraining on children.
Journal of Strength and Conditioning Research, 10(2): 109-114.
8. Baechle, T. R, Earle, R. W., & Wathen, S. (2000). Resistance training. In Essentials of strength training and
conditioning (2nd
Ed.). National Strength and Conditioning. Beachle, T. R., & Earle, R. W. (eds.) Champaign, IL;
Human Kinetics (pp. 395-432).
9. Barnett, A, Chan, L, & Bruce, I. (1993). A preliminary study of the 20-m multistage shuttle runs as a predictor of
peak vo2 in Hong Kong Chinese students. Pediatric Exercise Science, 5: 42-50.
10. Benjamin, H. J. & Glow, K. M. (2003). Strength training for children and adolescents. What can physicians
recommend? The Physician and Sports Medicine, 31(9): 19-28.
11. Bompa, T. O. (2000). Total training for young champions. Champaign, IL: Human Kinetics (pp. 102-115).
12. Bompa, T. O. (1995). From childhood to champion athlete. Toronto: Veritas Publishing Inc.
13. Bompa, T.O. (1994). Theory and methodology of training-the key to athletic performance. New York: Kendall/Hunt
Publishing Co.
14. British Association of Sport and Exercise Science (2004). BASES position statement on guidelines for resistance
exercise in young people. Journal of Sports Science, 22: 383-390.
15. Chilibeck, P. D., Calder, A. W., Sale, D. G., & Webber, C. E. (1998). A comparison of strength muscle mass
increases during resistance training in young women. European Journal of Applied Physiology, 77: 170-175.
16. Chua, Yan Piaw. (2009). Advanced research statistical (Univariate & Multivariate Tests] (4th
Ed.). Kuala Lumpur:
McGraw-Hill.
17. DeRenne, C., Hetzler, R. K., Buxton, B. P., & Ho, K. W. (1996). Effects of training frequency on strength
maintenance in pubescent baseball players. Journal of Strength and Conditioning Research, 10(1): 8-14.
18. Dorgo, S., King, G. A., Candelaria, N. G., Bader, J. O., Brickey, G. D., & Adams, C. E. (2009). Effects of manual
resistance training on fitness in adolescents. Journal of Strength and Conditioning Research, 23(8): 2287-2294.
19. Faigenbaum, A.D. (2003). Youth resistance training. President’s Council on Physical Fitness and Sports Research
Digest, 4(3): 1-8.
20. Faigenbaum, A. D. (2000). Strength training for children and adolescents. Journal of Clinical Sports Medicine,
19(4): 593-619.
21. Faigenbaum, A. D., Kraemer, W. J., Blimkie, C., J., R., Jeffreys, I., Micheli, L. J., Nitka, M., Rowland, T. W. (2009).
Youth resistance: Updated position statement paper from the National Strength & Conditioning Association.
Journal Strength Conditioning Research, 8 (23): S1-S20.
22. Faigenbaum, A. D., & Mediate, P. (2006). The effects of medicine ball training on physical fitness in high school
physical education students. Physical Educator, 63: 160-170.
23. Faigenbaum, A. D., Miliken, L. A., Loud, R. L, Burak, B. T., Doherty, C, L, & Westcott, L. (2002). Comparison of 1
and 2 days per week of strength training in children. Research Quarterly for Exercise and Sports, 73(4): 416-424.
24. Faigenbaum, A. D., Westcott, W., LaRosa , Loud, R. , & Long, C. (1999). The effects of different resistance
training protocols on muscular strength and endurance development in children. Pediatrics, 104(1): 1-7.
25. Faigenbaum, A. D., Zaichkowsky, L.D., Westcott, W. L., Michell, L. J., & Fehlandt, A. F. (1993). The effects of a
twice-a-week strength training program on children. Pediatric Exercise Science, 5: 339-346.
26. Fleck, S.J., & Kraemer, W.J. (2004). Designing resistance training programs (3
rd
Ed.). Champaign, IL: Human
Kinetics.
27. Istvanfi, C. (1997). Training theory and methodology: From principle to practice. Hungary, Budapest: Hungary
University of Physical Education.](https://image.slidesharecdn.com/fcfae7cb-afca-4125-9408-72091dd30730-161107043714/85/International_Journal_Volume_23-42-320.jpg)
![36
28. Jacobson, E. (1938). Progressive Relaxation. Chicago, IL: University of Chicago Press in Christine, P. (2004).
Stress Management-Dynamic Health and Human Movement. Champaign, IL: Human Kinetics.
29. Jespensen, M., & Potvin, A. N. (2003). The great medicine ball handbook (2nd
ed.). Surrey, B.C.: Productive
Fitness Products Inc.
30. Johnson, B. L., & Nelson, J. K. (1986). Practical Measurement for Evaluation in Physical Education (4
th
Ed.).
Minnesota: Burgess Publishing.
31. Jones, M. (1997). Strength conditioning with medicine balls. Leeds: The National Coaching Foundation.
32. Kraemer, W. J., & Fleck, S. J. (2007). Optimizing strength training. Champaign, IL: Human Kinetics.
33. Kraemer, W. J., & Fleck, S. J. (2005). Strength training for young athlete. Champaign, IL: Human Kinetics.
34. Lawrence, D., & Hope, B. (2007). Circuit training (2nd
Ed.). London: A & C Black.
35. Leger, L. A., & Lambert, J. A. (1982). A maximal multistage 20m shuttle run test to predict VO2 max. European
Journal of Applied Physiology, 49:1-12.
36. Mirwald, R. L., Baster-Jones, A. D., Bailey, D. A. & Beunen, G. D. (2002). An assessment of maturity from
anthropometric measurements. Medicine Sports Exercise. 2002; 34(4): 689-694.
37. Morris, T, Spittle, M, & Watt, A. P. (2005). Imagery in Sport. Champaign, IL: Human Kinetics.
38. Mosher, P. E., Underwood, S. A., Ferguson, M. A., & Arnold, R. O. (1994). Effects of 12 weeks of aerobic circuit
training on aerobic capacity, muscular strength and body composition in college-age women. Journal of Strength
and Conditioning Research, 8(3): 129-130.
39. National Strength and Conditioning Association (NSCA). (2009). Youth resistance training: Updated position
statement paper from the National Strength and Conditioning Association. Journal Strength Conditioning
Research, 23(5): S60-S79.
40. Orlick, T. (2000). In Pursuit of Excellence-How to win in sport and life through mental training (3rd
ed.).
Champaign, IL: Human Kinetics.
41. Pauole, K., Kent, M., John, G., Michael, L, & Ralph, R. (2000). Reliability and validity of the T-test as a measure of
agility, leg power, and leg speed in college-aged men and women. Journal of Strength Conditioning and
Research, 14(4): 443-450.
42. Ramsay, J. A., Blimkie, C. J. R., Smith, K., Garner, S., & Mac-Dougall, J. D., & Sale, D. G. (1990). Strength
training effects in prepubescent boys. Medicine Science and Sports Exercise, 22(5): 605-614.
43. Rhea, M. R. (2004). Determining the magnitude of treatment effects in strength training research through the use
of the effect size. Journal of Strength and Conditioning Research, 18(4): 918-920.
44. Scholich, M. (1992). Circuit training for all sports. Toronto: Sports Book Publisher.
45. Sports Medicine Institute for Young Athletes, Hospital for Special Surgery (2009). Strength training for young
athletes-What kids and their parents need to know. http://www.hss.ed/conditions_14511.asp [Accessed May 14,
2009].
46. Tanimoto, M, Sanada, K., Yamamoto, K., Kawano, H, Gando, Y, Tabata, I, Ishiii, N., & Miyachi, M. (2008). Effects
of whole-body low-intensity resistance training with slow movement and tonic generation on muscular size and
strength in young men. Journal of Strength and Conditioning Research, 22(6): 1926-1938.
47. Taskin, H. (2009). Effect of circuit training on the sprint-agility and anaerobic endurance. Journal of Strength and
Conditioning Research, 23(6): 1803-1810.
48. Thomas, M. (2000). The functional warm-up. Journal of Strength & Conditioning, 22(2): 51-53.
49. Velez, A., Golem, D. L., & Arent, S. M. (2010). The impact of a 12-week resistance training program on strength,
body composition, and self-concept of hispanic adolescents. Journal of Strength and Conditioning Research,
24(4): 1065-1073.
50. Willardson, J. M. (2008). A Brief Review: How much rest between sets? National Strength and Conditioning
Association, 30(3): 44-50.
51. Willardson, J. M. (2006). A brief review: Factors affecting the length of the rest interval between resistance training
exercise sets. Journal of Strength Conditioning Research, 20: 978-984.
52. Willardson, J. M., & Burkett, L. N. (2008). The effect of different rest intervals between sets on volume
components and strength gains. Journal of Strength Conditioning Research, 22: 146-152.](https://image.slidesharecdn.com/fcfae7cb-afca-4125-9408-72091dd30730-161107043714/85/International_Journal_Volume_23-43-320.jpg)
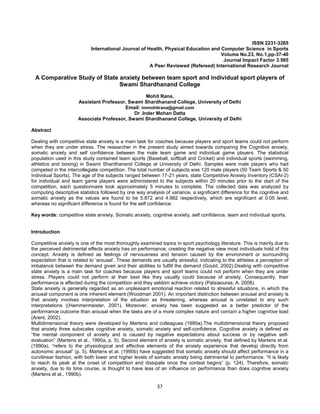
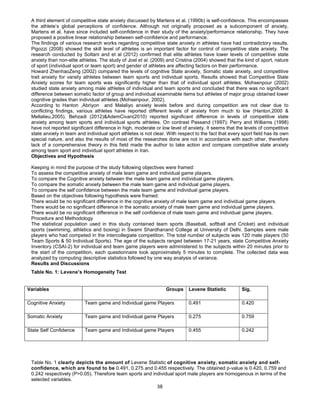
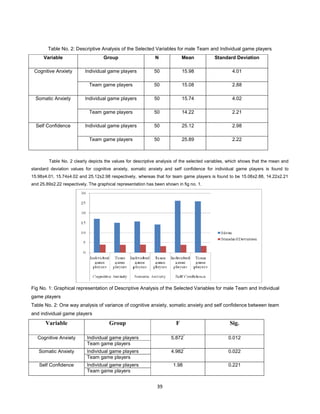
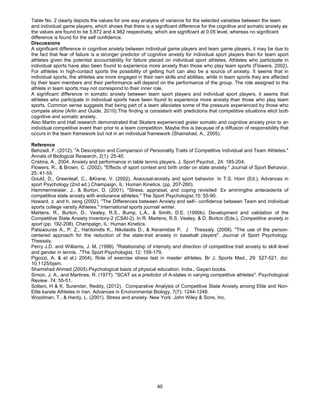
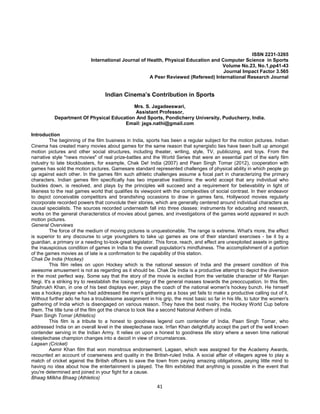
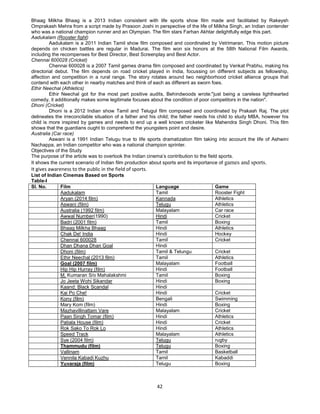
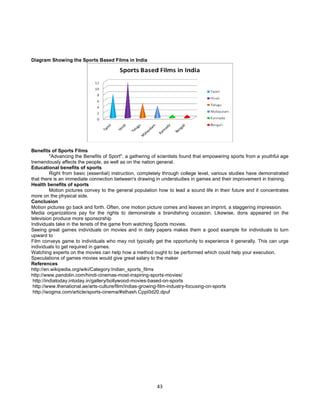
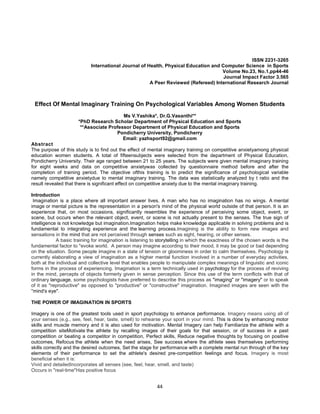
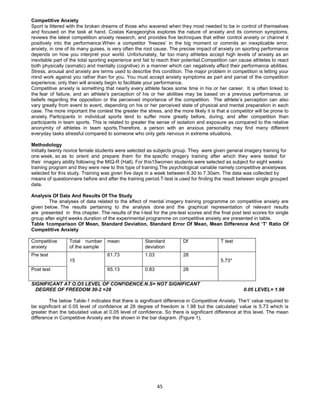
![46
Figure 1
PRE AND POST-TEST SCORES OF COMPETITIVE ANXIETY
61.73
65.13
60
61
62
63
64
65
66
Pre Test Post Test
MeanScore
Competitive Anxiety
Conclusion
The result predicted that there was significant difference in cognitive anxiety due to eight weeks of training program
among the students. In case of beginners or novice sportspersons, mental imagery can aid in learning skills by helping
to develop the appropriate mental blueprint of the skill.
References
Callow, N., & Roberts, R (2010). Imagery research: An investigation of three issues. Psychology of Sport &
Exercise11, 325-329.
Malouin F, Richards CL, Durand A, Doyon J. Reliability of mental chronometry for assessing motor imagery ability
after stroke. Archives of Physical Medicine and Rehabilitation. 2008; 89(2):311–319. [PubMed]
Roberts, S. M. (2011). The Impact of Mental Imagery on the Confidence of Student-Athletes (Doctoral dissertation,
Defiance College).
Rainer Martens, Robin Vealey, Damon Burton. Competitive Anxiety in Sport.
HALE, B. (1998) Imagery Training. UK; The National Coach Foundation.
MARTENS, R. et al.(1990) The Development of the Competitive State Anxiety Inventory-2 (CSAI-2). Human Kinetics.
SPIELBERGER, C.D. (1966) Anxiety and behaviour. Academic Press, New York.
SCAT, Martens, Vealey, & Burton, 1990. Sport Competition Anxiety TestIntra-individual variability in state anxiety and
Self-Confidence in elite golfers.
Egan, Kieran (1992). Imagination in Teaching and Learning. Chicago: University of Chicago Press.
Block, N. (1983). Mental Pictures and Cognitive Science. Philosophical Review 92: 499-539.
Marks, D.F. (1973). Visual imagery differences in the recall of pictures. British Journal of Psychology, 64, 17-24.
ELLIOT, D. et al. (2014) The effects of relaxing music for anxiety control on competitive sport anxiety. European
journal of sport science, 14 (sup1), p. S296-S301
HANIN, Y. L. (2010) Coping with anxiety in sport. Coping in sport: Theory, methods, and related constructs, p. 159-
175.](https://image.slidesharecdn.com/fcfae7cb-afca-4125-9408-72091dd30730-161107043714/85/International_Journal_Volume_23-53-320.jpg)
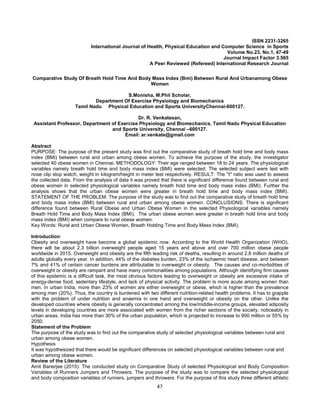
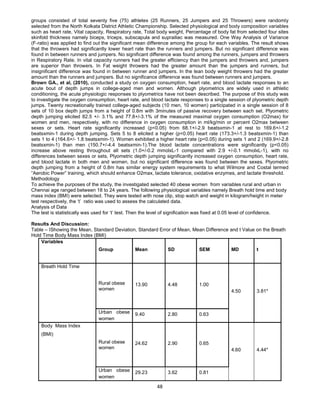
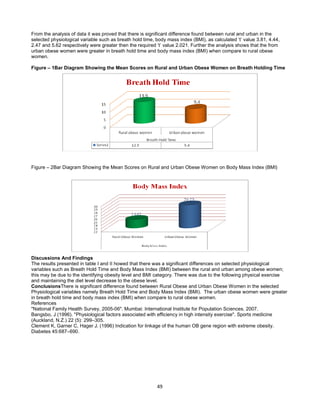
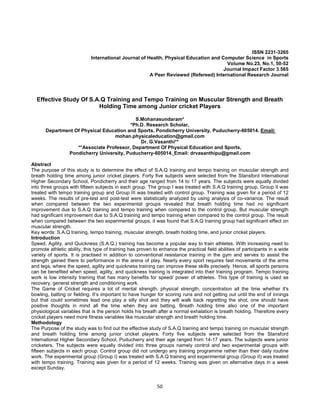
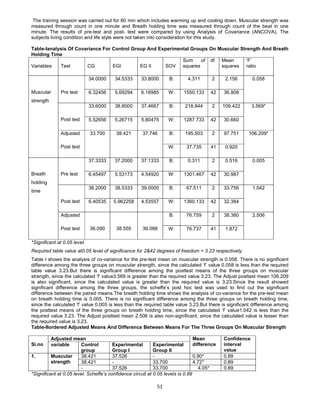
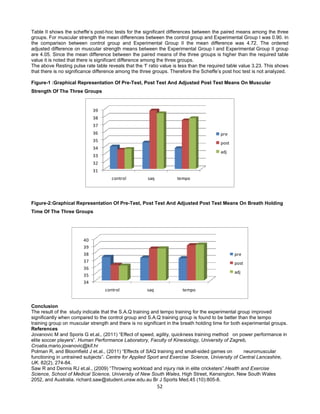
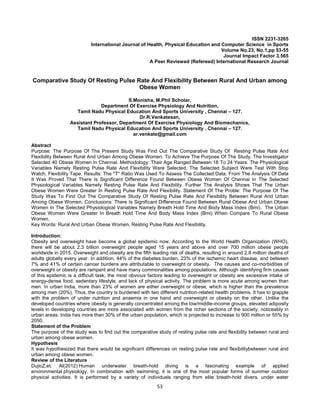
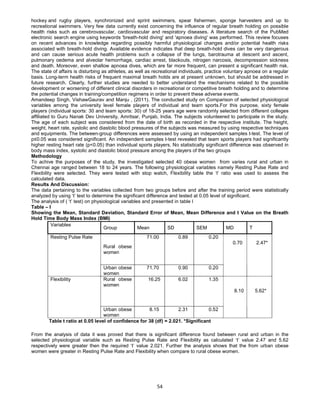
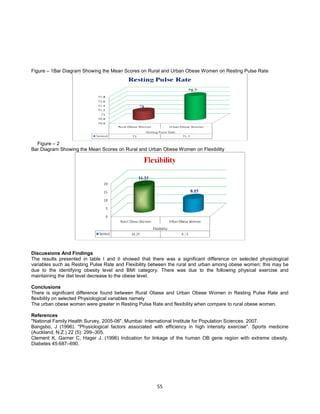
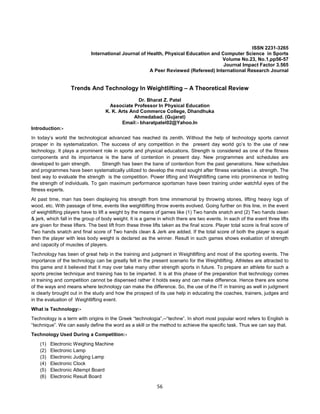
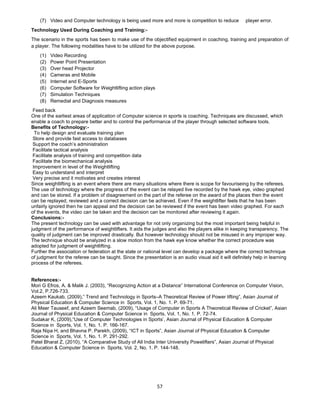
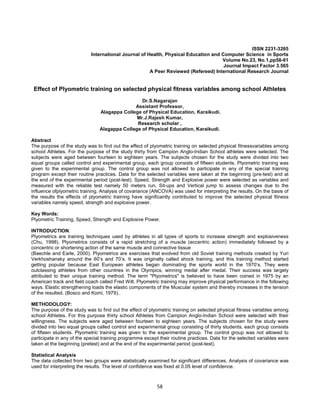
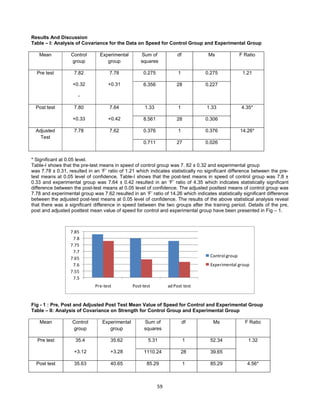
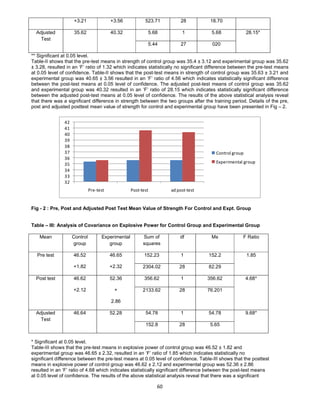
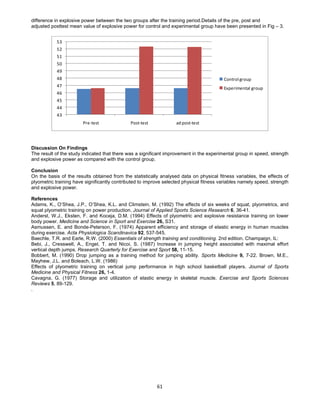
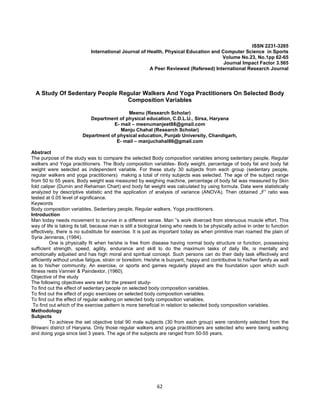
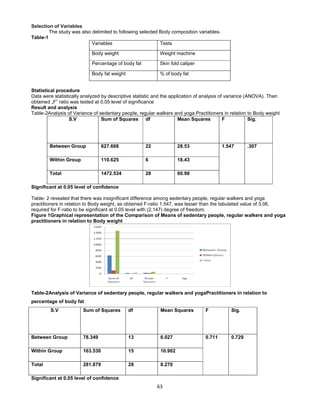
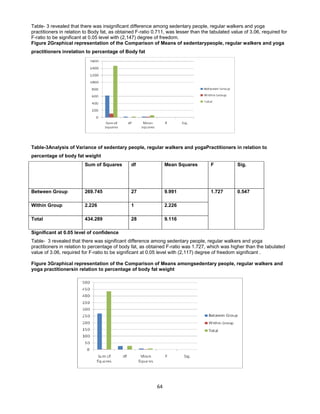
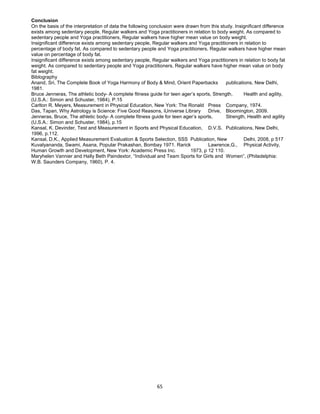
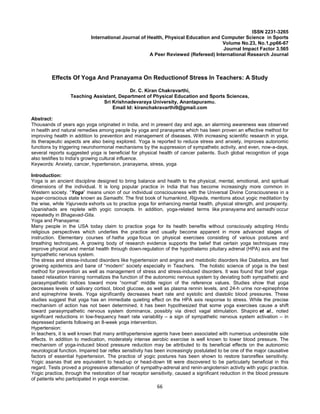
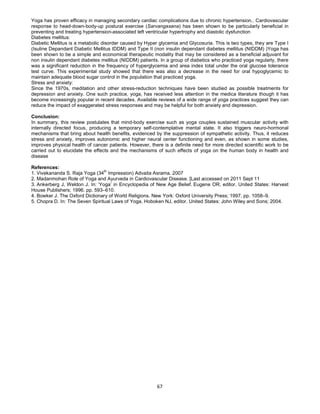
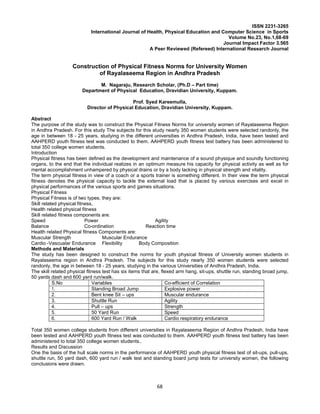
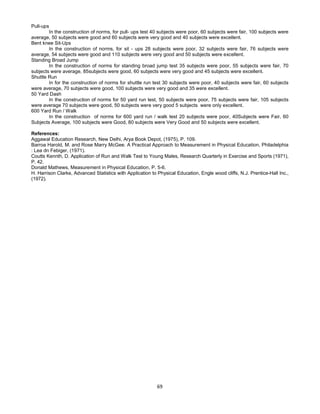
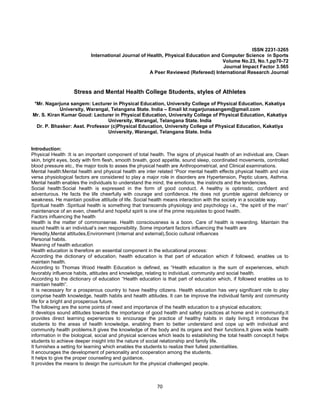
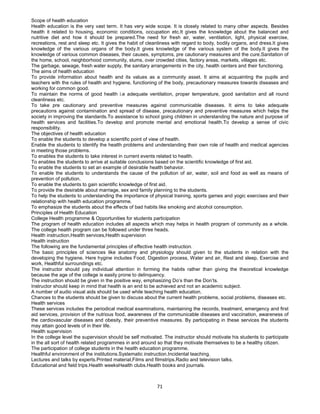
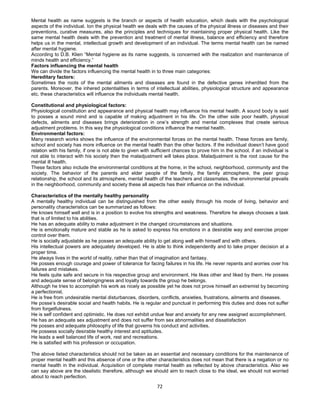
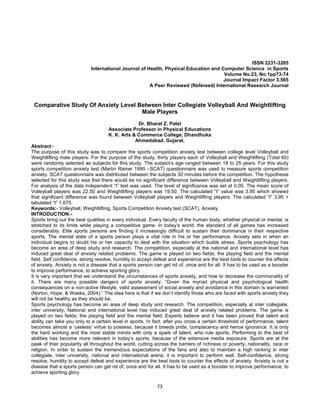
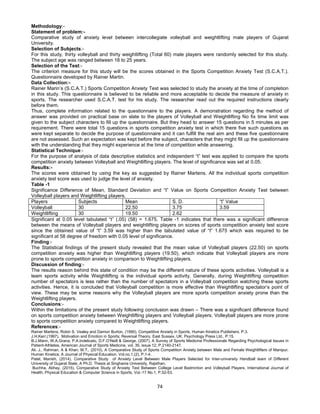
![76
Methodology
Thirteen young overweight and obese (BMI ≥25 kg/m2
) women (30-35 years), were randomly selected. All women
were premenopausal and had not been on hormone replacement therapy for at least one year before enrollment in the
study. In addition, they were non-smoker and had no history of diabetes, cardiovascular and neurological diseases. To
detect cardiovascular, pulmonary or other diseases, subjects were examined by a physician. Medical history and
physical activity questionnaires were filled by all participants. Participants were informed of the procedures and risks
of the study and signed a written informed. This study was approved by the University’s Ethic Committee. Subject
Participated in two sessions of high and low intensity aerobic exercises. In the first session, Subjects run on treadmill
at intensity of 40 percent of vo2max for 40 minutes, and following 72 hours of rest interval, in the second session, they
run at 80 percent of Vo2max for 20 minutes.
Three blood samples (5 ml) from anticubital vein were obtained with minimum stasis before and immediately following
exercise sessions at the same time of day (morning). The samples were separated by centrifugation (3000 g for 15
min) and sera were stored in a -80°C freezer for la ter analyses. Apelin (Eastbiopharm, China) and TNF-α
(ImmunoBoster, USA) concentrations were determined using ELISA. Fasting serum glucose concentrations were
measured by the glucose oxidase method using a Beckman Glucose Analyzer (Beckman Instruments, Irvine, CA).
Insulin was measured by using radioimmunoassay with commercial kits (ImmunoNucleo, Stillwater, MN). The
homeostasis model assessment of insulin resistance (HOMA-IR) was calculated using the HOMA-IR equation ([fasting
insulin (µU mL
-1
) × fasting glucose (mmol L
-1
)]/ 22.5)(10).Total cholesterol (TC), triglyceride (TG), and HDL-C levels
were measured by using the enzymatic method (Hamburg, Germany). LDL-C level was calculated by Friedwald’s
equation(11).
Data were assessed for normality using Shapiro- wilk test. The differences among pre- and post- exercise values were
compared among three steps by using repeated measure analysis of variance (ANOVA). When repeated measure
ANOVA indicated the presence of a significant difference, post-hoc comparisons using Bonferroni’s method were
applied to identify which mean differences were statistically significant. The relationships between pre-exercises
variables and in response to exercises were determined using Pearson’s correlation test. The level of significance in
all statistical analyses was set at P<0.05.All statistical analyses were performed with SPSS 16.0 software package for
Windows.
Results
There did not exist significant differences between changes of Apelin(P=0.318), cholesterol(P=0.464), HDL(P=0.480),
LDL(P=0.169), insulin(P=0.810), fasting glucose (P=0.219)and HOMA-IR (P=0.298)in response to high versus low
intensity aerobic exercise in triple phases of study (P>0.05); However, significant differences were reported for
changes of TNF-α (P=0.034) and triglyceride (P=0.038)levels. As, bonferroni's correction showed thatTNF-α changes
were significant in pre-test compared to high intensity aerobic exercise(P=0.031) and triglyceride chenges were
significantly difference in pre-test compared to low intensity aerobic exercise(P=0.010).Moreover, According to
Pearson correlation, there were significant correlations between changes of Apelinin response to low intensity aerobic
exercise and changes of cholesterol (P=0.031, r=0.598), HDL (P=0.048, r=-0.569) and insulin (P=0.049, r=0.551).
Table 1. mean ± SD of factors assessed before and after high and low
session of aerobic exercise
Pre- test Low intensity High intensity
Apelin 514.92 ± 146.5 514.85 ± 151.61 558.1 ± 142.1
TNF-α 17.8 ± 26.8 195 ± 30.8 214.3 ± 16.2∗
Triglyceride 114.4 ± 32.42 144.84 ± 46.7 128.8 ± 44.2
Cholesterol 205.8 ± 24 210.2 ± 19.1 201.31 ± 29.2
HDL 39.31 ± 8.9 38.31 ± 8.34 37.31 ± 6.3
LDL 138.15 ± 20.2 130 ± 21.6 126.6 ± 25.1
Insulin 6 ± 1.45 6.3 ± 2.3 6.1 ± 1.4
Fasting
Glucose
84.1 ± 9.4 91.1 ± 14.4 85.31 ± 10.2
HOMA-IR 1.3 ± 0.4 1.43 ± 0.6 1.3 ± 0.34
∗ indicates significant difference (P<0.05)](https://image.slidesharecdn.com/fcfae7cb-afca-4125-9408-72091dd30730-161107043714/85/International_Journal_Volume_23-83-320.jpg)
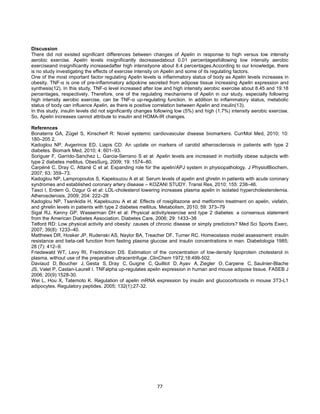
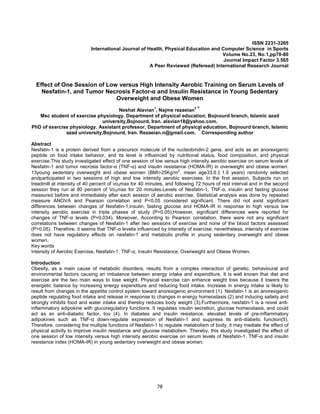
![79
Methodology
Thirteen young overweight and obese (BMI ≥25 kg/m
2
) women (30-35 years), were randomly selected. All women
were premenopausal and had not been on hormone replacement therapy for at least one year before enrollment in the
study. In addition, they were non-smoker and had no history of diabetes, cardiovascular and neurological diseases. To
detect cardiovascular, pulmonary or other diseases, subjects were examined by a physician. Medical history and
physical activity questionnaires were filled by all participants. Participants were informed of the procedures and risks
of the study and signed a written informed. This study was approved by the University’s Ethic Committee. Subject
Participated in two sessions of high and low intensity aerobic exercises. In the first session, Subjects run on treadmill
at intensity of 40 percent of vo2max for 40 minutes, and following 72 hours of rest interval, in the second session, they
run at 80 percent of Vo2max for 20 minutes.
Three blood samples (5 ml) from anticubital vein were obtained with minimum stasis before and immediately following
exercise sessions at the same time of day (morning). The samples were separated by centrifugation (3000 g for 15
min) and sera were stored in a -80°C freezer for la ter analyses. Nesfatin-1 (Eastbiopharm, China) and TNF-α
(ImmunoBoster, USA) concentrations were determined using ELISA. Fasting serum glucose concentrations were
measured by the glucose oxidase method using a Beckman Glucose Analyzer (Beckman Instruments, Irvine, CA).
Insulin was measured by using radioimmunoassay with commercial kits (ImmunoNucleo, Stillwater, MN). The
homeostasis model assessment of insulin resistance (HOMA-IR) was calculated using the HOMA-IR equation ([fasting
insulin (µU mL
-1
) × fasting glucose (mmol L
-1
)]/ 22.5)(5).
Data were assessed for normality using Shapiro- wilk test. The differences among pre- and post- exercise values were
compared among three steps by using repeated measure analysis of variance (ANOVA). When repeated measure
ANOVA indicated the presence of a significant difference, post-hoc comparisons using Bonferroni’s method were
applied to identify which mean differences were statistically significant. The relationships between pre-exercises
variables and in response to exercises were determined using Pearson’s correlation test. The level of significance in
all statistical analyses was set at P<0.05.All statistical analyses were performed with SPSS 16.0 software package for
Windows.
Results
There did not exist significant differences between changes of Nesfatin-1(P=0.357), insulin(P=0.810), fasting glucose
(P=0.219)and HOMA-IR(P=0.298) in response to high versus low intensity aerobic exercise in triple phases of study.
However, significant differences were reported for changes of TNF-α levels (P=0.034). As, bonferroni's correction
showed that TNF-αchanges were significant in pre-test compared to high intensity aerobic exercise(P=0.031).
However, no significant differences reported for changes of insulin, fasting glucose and HOMA-IR (P>0.05). Moreover,
According to Pearson correlation, there were not any significant correlations between changes of Nesfatin-1 after two
sessions of exercise and changes of none of the blood factors assessed (P>0.05).
Discussion
There did not existed significant differences between changes of Nesfatin-1 in response to high versus low intensity
aerobic exercise. Nesfatin-1 levels insignificantly increasedfollowing low and high intensity aerobic exerciseabout 7.63
and 2.74percentages, respectively.According to our knowledge, there is no study investigating the effects of exercise
intensity on Nesfatin-1 and some of its regulating factors.
One of the most important factor regulating Nesfatin-1 levels is inflammatory status of body as Nesfatin-1 levels
increases in obesity. TNF-α is one of pre-inflammatory adipokine secreted from adipose tissue decreasing Nesfatin-1
expression and synthesis(5). In this study, TNF-α level increased after low and high intensity aerobic exercise about
8.45 and 19.18 percentages, respectively. Therefore, one of the regulating mechanisms of Nesfatin-1 in our study,
especially following high intensity aerobic exercise, can be TNF-α up-regulating function. In addition to inflammatory
status, metabolic status of body can influence Nesfatin-1, as there is positive correlation between Nesfatin-1 and
insulin(7).
Table 1. mean ± SD of factors assessed before and after high and low
session of aerobic exercise
Pre- test Low intensity High intensity
Nesfatin-1 10.22 ± 2.5 11 ± 1.5 10.5 ± 2.1
TNF-α 17.8 ± 26.8 195 ± 30.8 214.3 ± 16.2∗
Insulin 6 ± 1.45 6.3 ± 2.3 6.1 ± 1.4
Fasting
Glucose
84.1 ± 9.4 91.1 ± 14.4 85.31 ± 10.2
HOMA-IR 1.3 ± 0.4 1.43 ± 0.6 1.3 ± 0.34
∗ indicates significant difference (P<0.05)](https://image.slidesharecdn.com/fcfae7cb-afca-4125-9408-72091dd30730-161107043714/85/International_Journal_Volume_23-86-320.jpg)
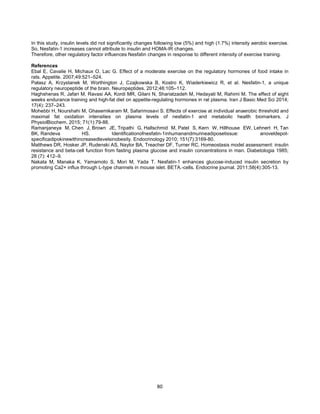
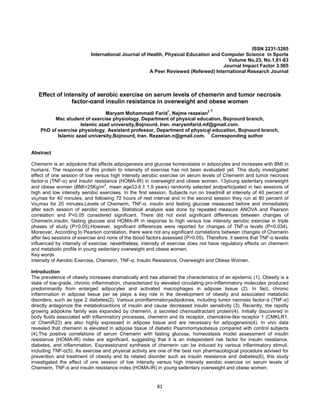
![82
Methodology
Thirteen young overweight and obese (BMI ≥25 kg/m
2
) women (30-35 years), were randomly selected. All women
were premenopausal and had not been on hormone replacement therapy for at least one year before enrollment in the
study. In addition, they were non-smoker and had no history of diabetes, cardiovascular and neurological diseases. To
detect cardiovascular, pulmonary or other diseases, subjects were examined by a physician. Medical history and
physical activity questionnaires were filled by all participants. Participants were informed of the procedures and risks
of the study and signed a written informed. This study was approved by the University’s Ethic Committee. Subject
Participated in two sessions of high and low intensity aerobic exercises. In the first session, Subjects run on treadmill
at intensity of 40 percent of vo2max for 40 minutes, and following 72 hours of rest interval, in the second session, they
run at 80 percent of Vo2max for 20 minutes.
Three blood samples (5 ml) from anticubital vein were obtained with minimum stasis before and immediately following
exercise sessions at the same time of day (morning). The samples were separated by centrifugation (3000 g for 15
min) and sera were stored in a -80°C freezer for la ter analyses. Chemerin (Eastbiopharm, China) and TNF-α
(ImmunoBoster, USA) concentrations were determined using ELISA. Fasting serum glucose concentrations were
measured by the glucose oxidase method using a Beckman Glucose Analyzer (Beckman Instruments, Irvine, CA).
Insulin was measured by using radioimmunoassay with commercial kits (ImmunoNucleo, Stillwater, MN). The
homeostasis model assessment of insulin resistance (HOMA-IR) was calculated using the HOMA-IR equation ([fasting
insulin (µU mL
-1
) × fasting glucose (mmol L
-1
)]/ 22.5)(7).
Data were assessed for normality using Shapiro- wilk test. The differences among pre- and post- exercise values were
compared among three steps by using repeated measure analysis of variance (ANOVA). When repeated measure
ANOVA indicated the presence of a significant difference, post-hoc comparisons using Bonferroni’s method were
applied to identify which mean differences were statistically significant. The relationships between pre-exercises
variables and in response to exercises were determined using Pearson’s correlation test. The level of significance in
all statistical analyses was set at P<0.05.All statistical analyses were performed with SPSS 16.0 software package for
Windows.
Results
There did not exist significant differences between changes of Chemerin(P=0.034), insulin(P=0.034), fasting glucose
(P=0.034)and HOMA-IR(P=0.034) in response to high versus low intensity aerobic exercise in triple phases of study.
However, significant differences were reported for changes of TNF-α levels (P=0.034). As, bonferroni's correction
showed that TNF-αchanges were significant in pre-test compared to high intensity aerobic exercise(P=0.031).
However, no significant differences reported for changes of insulin, fasting glucose and HOMA-IR (P>0.05). Moreover,
According to Pearson correlation, there were not any significant correlations between changes of Chemerin after two
sessions of exercise and changes of none of the blood factors assessed (P>0.05).
Discussion
There did not existed significant differences between changes of Chemerin in response to high versus low intensity
aerobic exercise. Chemerin levels insignificantly increasedfollowing low and high intensity aerobic exerciseabout 0.5
and 7.41percentages, respectively.According to our knowledge, there is no study investigating the effects of exercise
intensity on Chemerin and some of its regulating factors.
One of the most important factor regulating Chemerin levels is inflammatory status of body as Chemerin levels
increases in obesity. TNF-α is one of pre-inflammatory adipokine secreted from adipose tissue increasing Chemerin
expression and synthesis(5). In this study, TNF-α level increased after low and high intensity aerobic exercise about
8.45 and 19.18 percentages, respectively. Therefore, one of the regulating mechanisms of Chemerin in our study,
especially following high intensity aerobic exercise, can be TNF-α up-regulating function. In addition to inflammatory
status, metabolic status of body can influence Chemerin, as there is positive correlation between Chemerin and
insulin(8).
Table 1. mean ± SD of factors assessed before and after high and low
session of aerobic exercise
Pre- test Low intensity High intensity
Chemerin 308.92 ± 121.66 310.31 ± 52.1 331.8 ± 61.3
TNF-α 17.8 ± 26.8 195 ± 30.8 214.3 ± 16.2∗
Insulin 6 ± 1.45 6.3 ± 2.3 6.1 ± 1.4
Fasting
Glucose
84.1 ± 9.4 91.1 ± 14.4 85.31 ± 10.2
HOMA-IR 1.3 ± 0.4 1.43 ± 0.6 1.3 ± 0.34
∗ indicates significant difference (P<0.05)](https://image.slidesharecdn.com/fcfae7cb-afca-4125-9408-72091dd30730-161107043714/85/International_Journal_Volume_23-89-320.jpg)
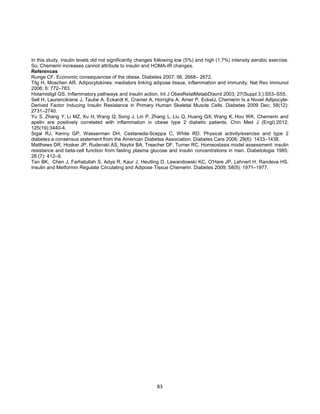
![85
Methodology
Thirteen young overweight and obese (BMI ≥25 kg/m2
) women (30-35 years), were randomly selected. All women
were premenopausal and had not been on hormone replacement therapy for at least one year before enrollment in the
study. In addition, they were non-smoker and had no history of diabetes, cardiovascular and neurological diseases. To
detect cardiovascular, pulmonary or other diseases, subjects were examined by a physician. Medical history and
physical activity questionnaires were filled by all participants. Participants were informed of the procedures and risks
of the study and signed a written informed. This study was approved by the University’s Ethic Committee. Subject
Participated in two sessions of high and low intensity aerobic exercises. In the first session, Subjects run on treadmill
at intensity of 40 percent of vo2max for 40 minutes, and following 72 hours of rest interval, in the second session, they
run at 80 percent of Vo2max for 20 minutes.
Three blood samples (5 ml) from anticubital vein were obtained with minimum stasis before and immediately following
exercise sessions at the same time of day (morning). The samples were separated by centrifugation (3000 g for 15
min) and sera were stored in a -80°C freezer for la ter analyses. Lipocalin-2 (Eastbiopharm, China) and TNF-α
(ImmunoBoster, USA) concentrations were determined using ELISA. Fasting serum glucose concentrations were
measured by the glucose oxidase method using a Beckman Glucose Analyzer (Beckman Instruments, Irvine, CA).
Insulin was measured by using radioimmunoassay with commercial kits (ImmunoNucleo, Stillwater, MN). The
homeostasis model assessment of insulin resistance (HOMA-IR) was calculated using the HOMA-IR equation ([fasting
insulin (µU mL
-1
) × fasting glucose (mmol L
-1
)]/ 22.5)(11).
Data were assessed for normality using Shapiro- wilk test. The differences among pre- and post- exercise values were
compared among three steps by using repeated measure analysis of variance (ANOVA). When repeated measure
ANOVA indicated the presence of a significant difference, post-hoc comparisons using Bonferroni’s method were
applied to identify which mean differences were statistically significant. The relationships between pre-exercises
variables and in response to exercises were determined using Pearson’s correlation test. The level of significance in
all statistical analyses was set at P<0.05.All statistical analyses were performed with SPSS 16.0 software package for
Windows.
Results
There existed significant differences between changes of lipocalin-2 (P=0.048) and TNF-α (P=0.034) in response to
high versus low intensity aerobic exercise in triple phases of study. As, bonferroni's correction showed that lipocalin-2
changes in response to low intensity aerobic exercise compared to high intensity aerobic exercise were significant
(P=0.021) and for TNF-α, its changes were significant in pre-test compared to high intensity aerobic
exercise(P=0.031). However, no significant differences reported for changes of insulin, fasting glucose and HOMA-IR
(P>0.05). Moreover, According to Pearson correlation, there were not any significant correlations between changes of
lipocalin-2 after two sessions of exercise and changes of none of the blood factors assessed (P>0.05).
Discussion
There existed significant differences between changes of lipocalin-2 in response to high versus low intensity aerobic
exercise. Lipocalin-2 levels insignificantly decreased about 8.4 percentage following low intensity aerobic exercise;
however, its levels significantly increased around 14.2 percentage after high intensity one.According to our
knowledge, there is no study investigating the effects of exercise intensity on lipocalin-2 and some of its regulating
factors.
One of the most important factor regulating lipocalin-2 levels is inflammatory status of body as lipocalin-2 levels
increases in obesity. TNF-α is one of pre-inflammatory adipokine secreted from adipose tissue not only increasing
lipocalin-2 expression and synthesis(8), its expression is up-regulated by lipocalin-2 treatment(12). In this study, TNF-
α level increased after low and high intensity aerobic exercise about 8.45 and 19.18 percentages, respectively.
Therefore, one of the regulating mechanisms of lipocalin-2 in our study, especially following high intensity aerobic
exercise, can be TNF-α up-regulating function. In addition to inflammatory status, metabolic status of body can
influence lipocalin-2, as there is positive correlation between lipocalin-2 and insulin(13).
In this study, insulin levels did not significantly changes following low (5%) and high (1.7%) intensity aerobic exercise.
So, lipocalin-2 increases cannot attribute to insulin and HOMA-IR changes.
Table 1. mean ± SD of factors assessed before and after high and low
session of aerobic exercise
Pre- test Low intensity High intensity
Lipocalin-2 801.4 ± 222.21 734.14 ± 147.1 915.23 ± 211.81∗
TNF-α 17.8 ± 26.8 195 ± 30.8 214.3 ± 16.2∗
Insulin 6 ± 1.45 6.3 ± 2.3 6.1 ± 1.4
Fasting
Glucose
84.1 ± 9.4 91.1 ± 14.4 85.31 ± 10.2
HOMA-IR 1.3 ± 0.4 1.43 ± 0.6 1.3 ± 0.34
∗ indicates significant difference (P<0.05)](https://image.slidesharecdn.com/fcfae7cb-afca-4125-9408-72091dd30730-161107043714/85/International_Journal_Volume_23-92-320.jpg)
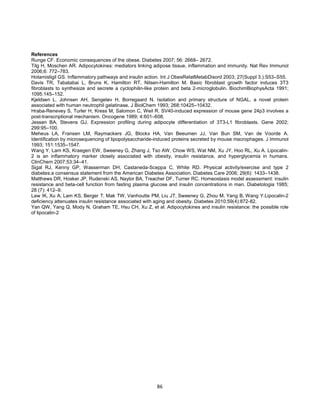
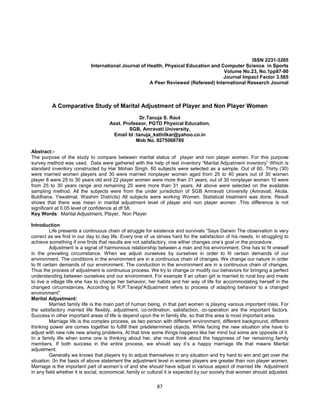
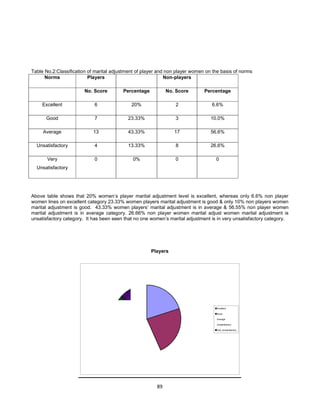
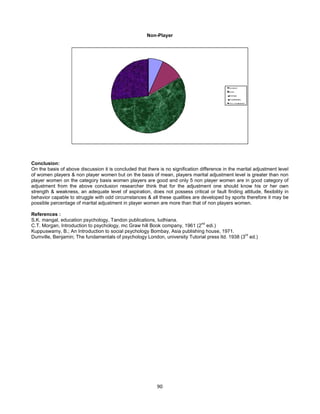
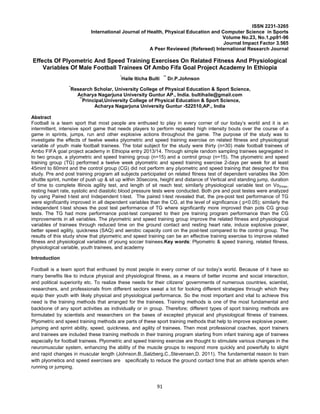
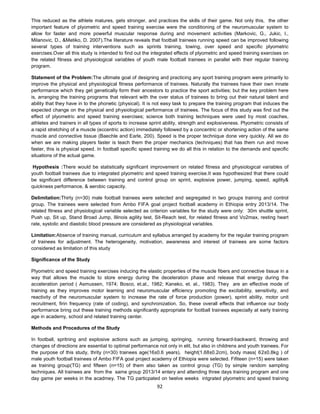
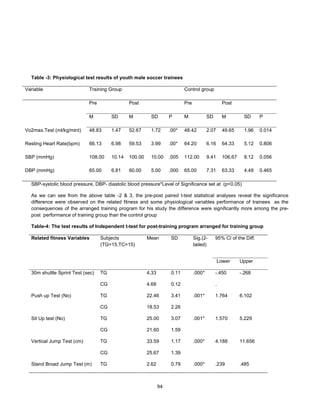
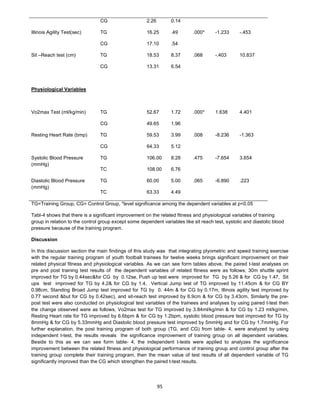
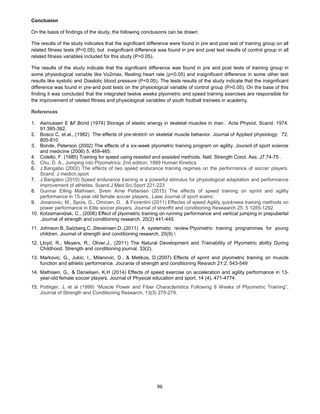
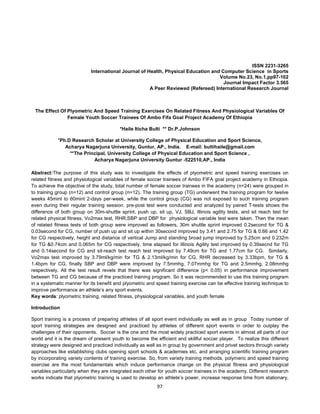
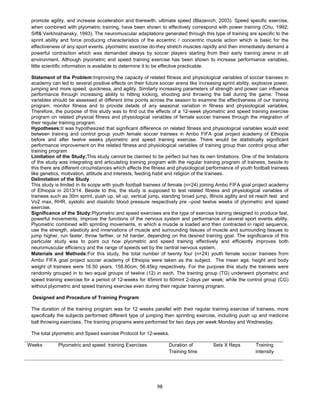
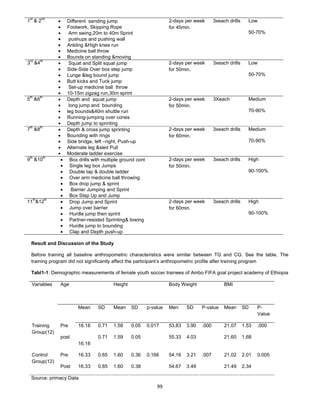
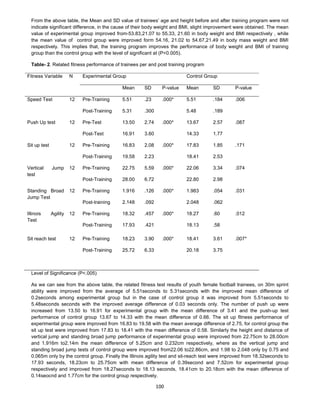
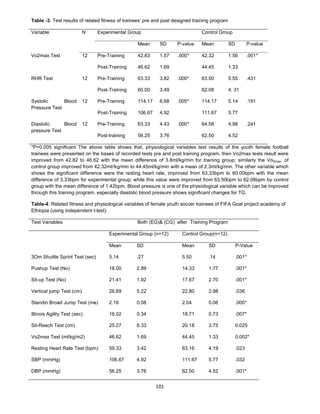
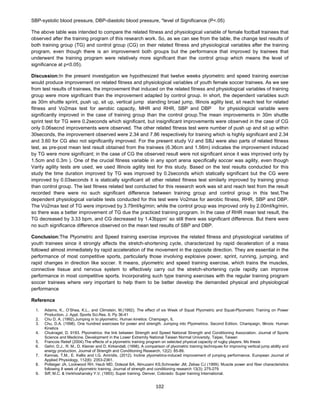
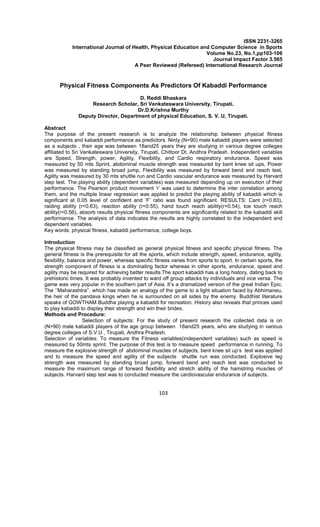
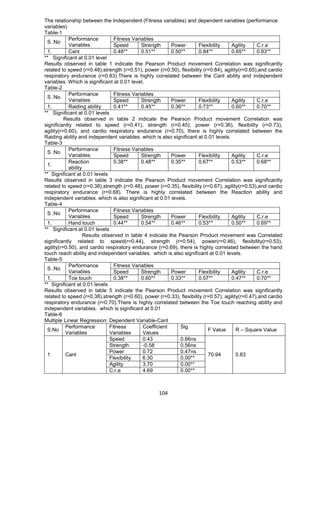
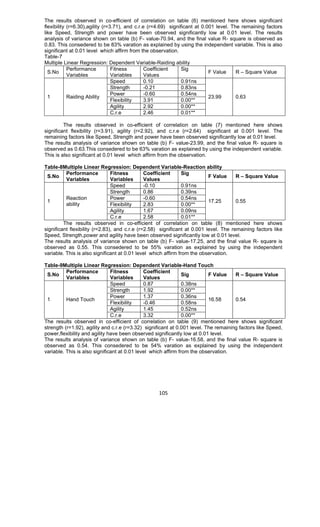
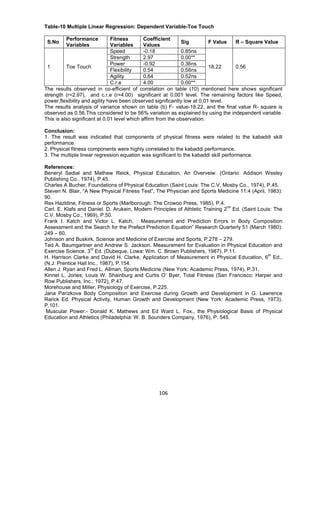
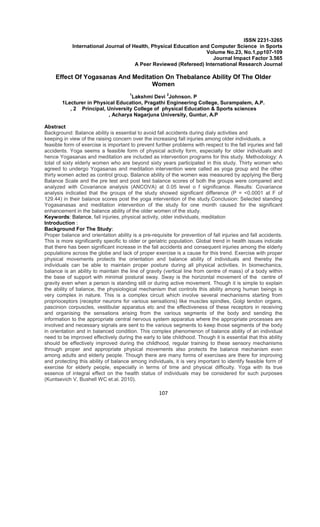
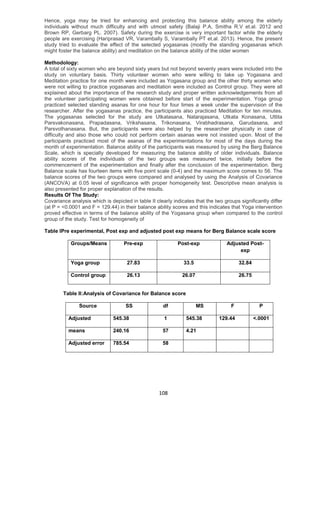
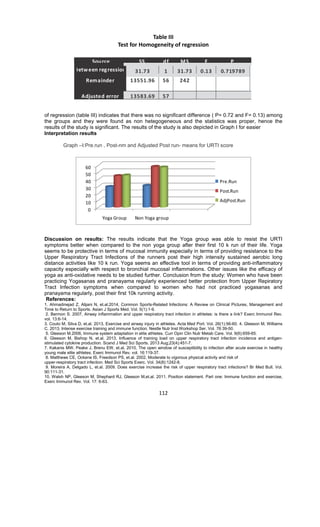
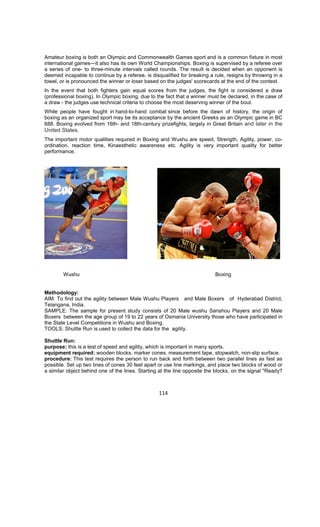
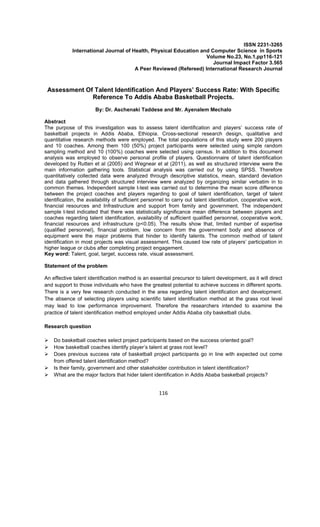
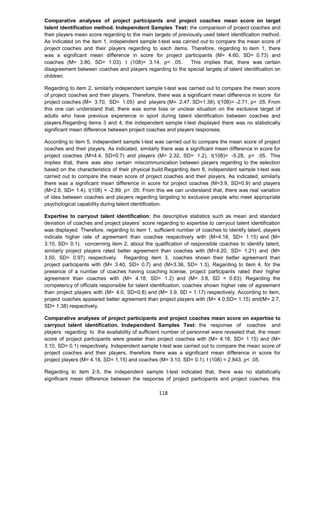
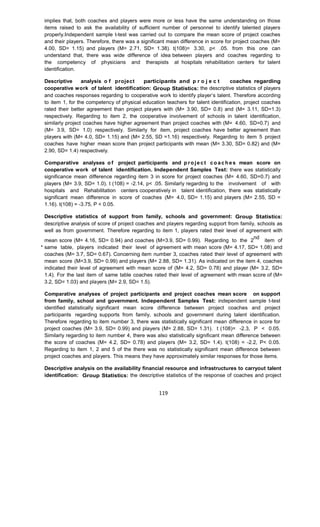
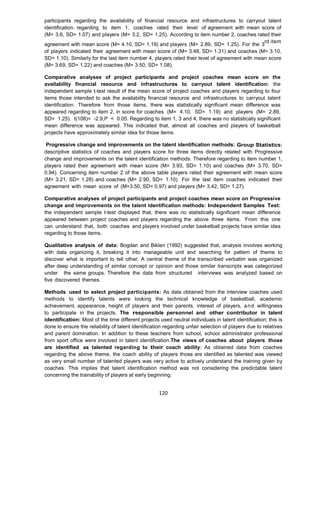
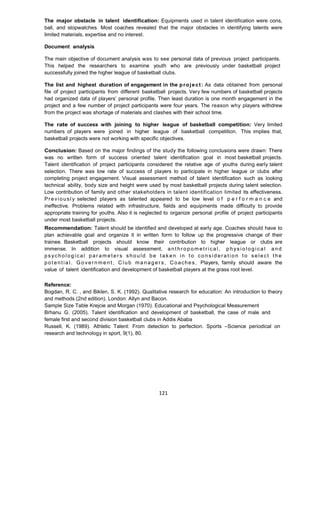
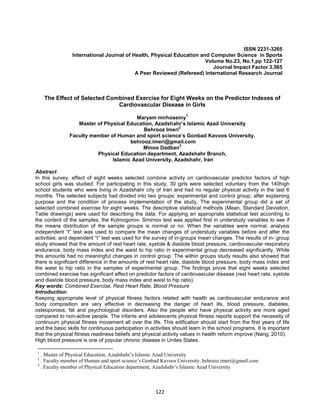
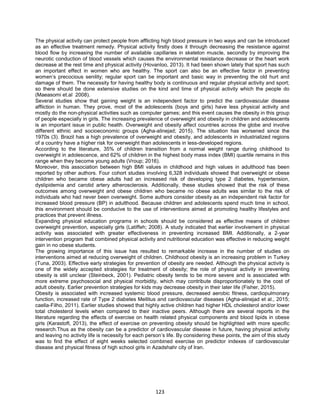
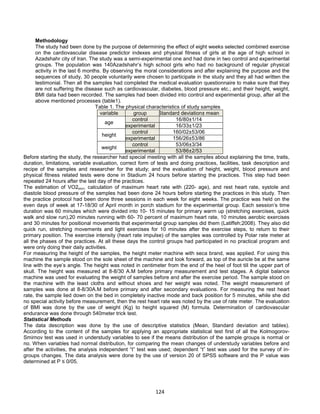
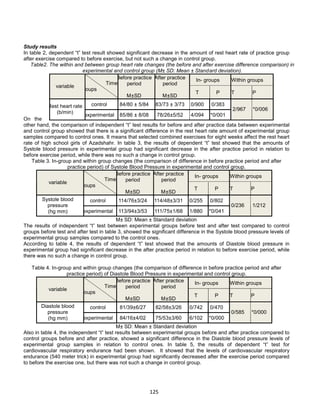
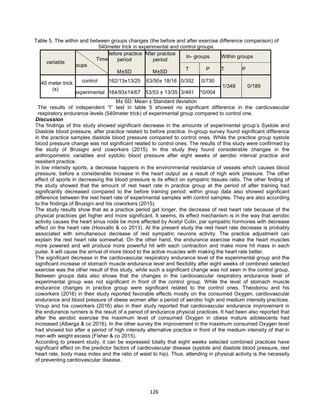
![127
References:
-Agha-Alinejad H, Farzad B, Salari M, Kamjoo S, Harbaugh BL, Peeri M. (2015). Prevalence of overweight
and obesity among Iranian preschoolers: Interrelationship with physical fitness. J Res Med Sci. 20(4):334-41.
-Alberga AS, Prud'homme D, Sigal RJ, Goldfield GS, Hadjiyannakis S, Phillips P, et al. (2016). Effects of
aerobic training, resistance training, or both on cardiorespiratory and musculoskeletal fitness in adolescents
with obesity: the HEARTY trial. Appl Physiol Nutr Metab. 41(3):255-65.
-Bruseghini P, Calabria E, Tam E, Milanese C, Oliboni E, Pezzato A, Pogliaghi S, Salvagno GL, Schena F,
Mucelli RP, Capelli C. (2015). Effects of eight weeks of aerobic interval training and of isoinertial resistance
training on risk factors of cardiometabolic diseases and exercise capacity in healthy elderly subjects.
Oncotarget. 6(19):16998-7015.
-Casella-Filho, A. Chagas, Ac. Maranhão ,Rc. And et al. (2011). Effect Of Exercise Training On Plasma
Levels And Functional Properties Of High-Density Lipoprotein Cholesterol In The Metabolic Syndrome. Amj
Cardiol. 107(8):1168- 72.
-Fisher G, Brown AW, Bohan Brown MM, Alcorn A, Noles C, Winwood L, et al. (2015). High Intensity Interval-
vs Moderate Intensity- Training for Improving Cardiometabolic Health in Overweight or Obese Males: A
Randomized Controlled Trial. PLoS One. 10(10):e0138853.
-Hovanloo Fariborz, Arefirad Tahereh, Ahmadizad Sajad. (2013). Effects of sprint interval and continuous
endurance training on serum levels of inflammatory biomarkers. J Diabetes Metab Disord. 12: 22.
-Karstoft K, Winding K, Knudsen SH, et al. (2013). The Effects of Free-Living Interval-Walking Training on
Glycemic Control, Body Composition, and Physical Fitness in Type 2 Diabetic Patients. Diabetes Care. 36(2),
228-36.
-Latiffah, L. Hanachi, P. (2008). To Investigate The Relation Of Hypertension And Anthropometric
Measurement. J Appl Sci. 8:3963-3968.
-Maeasomi H, (2008). The effects of select exercise on the capacity physiology and body composition boys in
the rang of age 16-17. Hara J Tehr Univ. 3(9): 12-21
-Marandi SM, Minasian V, Kelishadi R, Khalighinejad P, Borojeni MM, Borghi SH. (2014). Short-term Effects
of a Physical Activity Intervention on Obesity and Cardiovascular Fitness of 12-14-year-old Boy Students. Int
J Prev Med. 5(Suppl 2):S114-9.
-Theodorou AA, Panayiotou G, Volaklis KA, Douda HT, Paschalis V, Nikolaidis MG, Smilios I and et al.
(2016). Aerobic, resistance and combined training and detraining on body composition, muscle strength, lipid
profile and inflammation in coronary artery disease patients. Res Sports Med. 1-14. [Epub ahead of print]
-Vorup J, Tybirk J, Gunnarsson TP, Ravnholt T, Dalsgaard S, Bangsbo J. (2016). Effect of speed endurance
and strength training on performance, running economy and muscular adaptations in endurance-trained
runners. Eur J Appl Physiol. [Epub ahead of print].
-Wang,Z.Nakayama,T. (2010). Inflammation,Alink Between Obesity And Cardiovascular Disease. Division Of
Laboratory Medicine Tokyo. 173-8610.
-World Health Organization. (2006). BMI Classification". Global Database on Body Mass Index. Retrieved. 27,
2012.](https://image.slidesharecdn.com/fcfae7cb-afca-4125-9408-72091dd30730-161107043714/85/International_Journal_Volume_23-134-320.jpg)
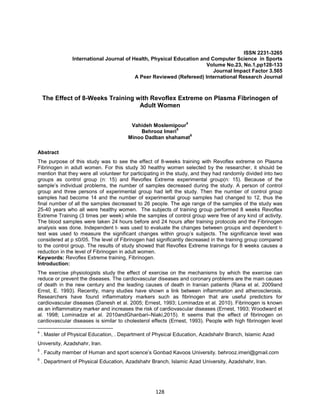
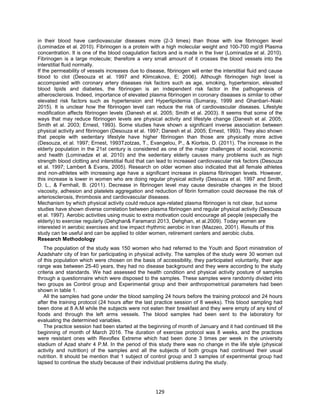
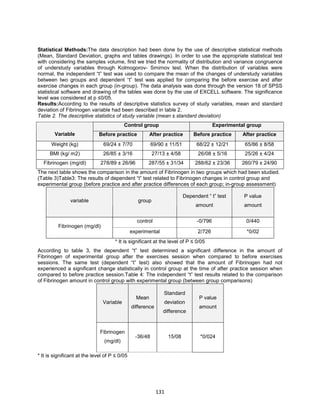
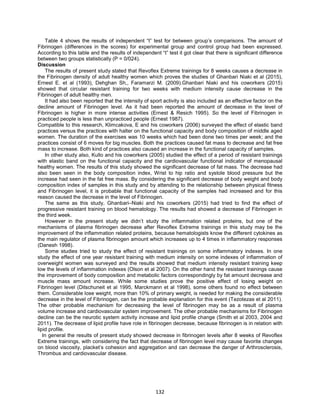
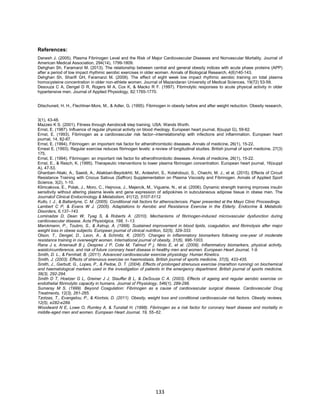
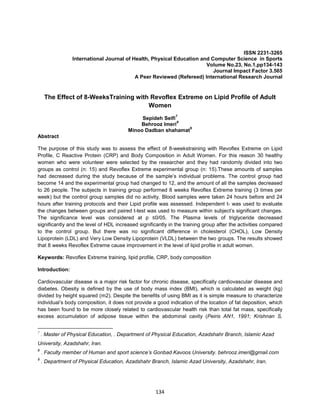
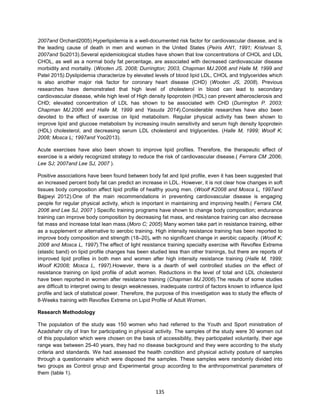
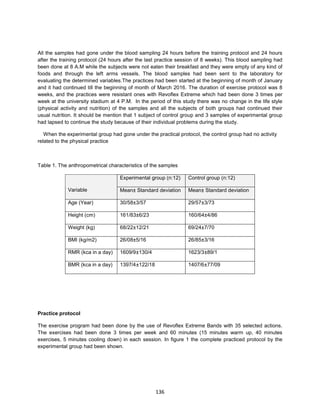
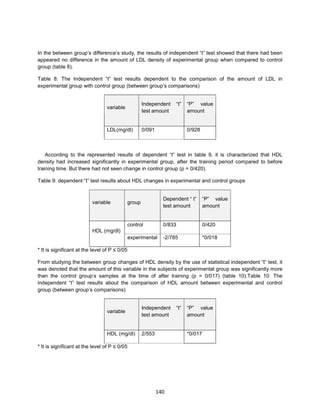
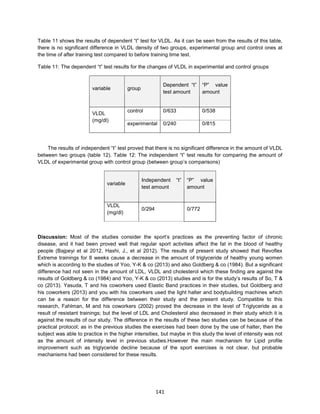
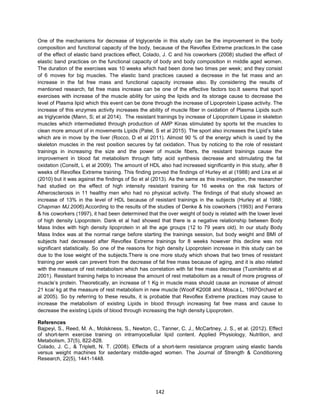
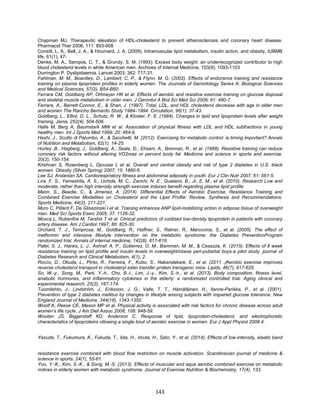
![144
ISSN 2231-3265
International Journal of Health, Physical Education and Computer Science in Sports
Volume No.23, No.1pp,144-152
Journal Impact Factor 3.565
A Peer Reviewed (Refereed) International Research Journal
Design, Development and Evaluation of 3D Virtual Environment Based as
Psychological Intervention Tool for Volleyball Players
Tan M. J.
1
, A.H. Omar
2
, Dayang Tiawa Awang Hamid
2
, M Syaifuddin Mohd
3
& Lim B.H.
4
1
Faculty of Bioscience and Medical Engineering, Universiti Teknologi Malaysia
2
Sports Innovation and Technology Centre, Universiti Teknologi Malaysia
3
Department of Mechanical Engineering, Universiti Teknologi PETRONAS
4
Sports Centre, Universiti Malaya
Abstract
This paper describes design and development of a 3D immersive environment as a psychological
intervention tool for volleyball players. Players with good mental strength typically able to control their
performance while facing high pressure situations. One of the main issues for athletes’ failure to achieve
peak performance in actual competition is due to internal factors such as anxieties and external factors
such as the high pressure competition environment. Most coaches preferred to use the tried and tested
method of video playback to improve the mental strength and sport performance of their athletes.
However, the inherent disadvantages of the video playback method are fairly obvious due to i. Heavy
requirements to subjective feedback and post mortem discussion from coaches and ii. Lack of feeling of
being in the real situation by athletes. Therefore, a new high impact sport technology in the form of Virtual
Environment (VE) was developed to address these limitations for mental training of volleyball players.
Hereby, a 3D immersive environment was implemented in this study to deal and intervene with the pre-
competitive anxiety of volleyball players. This 3D immersive environment is able to provide a real games
situation and allows players to experience the competition environment.At the same time; it also provides
players the motion sequences of volleyball skills. A Google Cardboard HMD was used as a hardware
device to deliver the VE content, provide more presence feeling and help players to visualize themselves
in immersive conditions. Exploratory work and initial development of the 3D immersive environment and
implementation of the prototype is discussed and explained. The pilot program involving a group of
volleyball players had validated the VE intervention tool where the players had shown positive results in
reducing the pre-competition anxieties and increasing the self confidence levels.
Keywords: 3D immersive environment, Google Cardboard HMD, volleyball players, virtual environment.
Introduction
Virtual reality was first developed in early 1960s and has been widely utilized as a research tool in
psychology [1]. One of the studies from medical science revealed that, virtual reality can help patients to
increase their muscle movement repetitions by walking in immersive environment and grabbing virtual
objects in a type of treatment to help recovery from stroke illness. Moreover, with creation of realistic
environment in virtual reality, this allows better interaction and immersive training for the sport
practitioners. Virtual reality is one of the technologies that was breaking through the ground of
psychological treatments and had shown effectiveness in many fields including surgical training, flight
simulator training, medicine science, education, civil engineering, phobia therapy, military training and
sports. Previous researcher revealed that immersive VR can provide athletes with the feeling of presence
and extremely important information through interactive environment [2].](https://image.slidesharecdn.com/fcfae7cb-afca-4125-9408-72091dd30730-161107043714/85/International_Journal_Volume_23-151-320.jpg)
![145
Recently, researchers discovered that VR system can be used to display realistic 3D environment to
induce anxiety, allowing players to perform resilience training, and familiarize themselves with the high-
pressure competition situation [2]. Virtual reality may be interchanged with video systems to enhance the
sports training experience of players because it is a computer-generated environment that is able to drum
up the user’s senses in the real world or imaginary world [3,4]. Volleyball is recognised as a competitive
team sport and it involves the psychological skills elements to develop the concentration of a winner,
learn to manage emotions under pressure resilience, and quick recovery from mistakes [5]. In sport
psychology, there are various types of psychology skills to manage anxiety level such as: imagery, self-
talk, relaxation, and concentration breathing. At present, most coaches prefer to use intervention of video
technology as imagery lesson on their players. With reference to video technology system may be
replaced by virtual reality (VR). Therefore, these days, advanced technology such as VR is being
developed and has experienced a rapid growth in the field of sports psychology. However, there is a lack
of useful, VR technologies being developed for mental training of volleyball athletes, therefore create an
opportunity for exploratory development work of virtual reality or virtual environment psychological
intervention tool for the sport.
Problem Statement
The most important issues which are of great concerns for coaches and sport psychologists are the
recognition of the important reasons affecting sports performance of an athlete. Pre-competitive state
anxiety must be treated in order to avoid from bad influence on athletes’ performance and reduction in the
level of self-confidence. Previous researcher piloted an experiment during a MASUM intervarsity
competition and the results have shown that, the female volleyball players displayed higher pre-
competitive state anxiety level compared to their self-confidence level [6]. Another researcher
recommended utilization of sport psychology training to decrease the pre-competitive state anxiety level
of players [7].The conventional method of video playback is considered as a limited method to enhance
athlete’s performance due to the fixed viewpoint of the camera position during recording. Because of this
limitation of video playback, immersion of the new virtual environment technology is proposed to be used
to overcome this limitation in order to help players in their training. In addition, application of video
playback analysis often requires the post-mortem team discussion and most for the training heavily
depended upon subjective feedback from coaches. Knowledge of majority of the coaches is limited and
this limit potential growth of players [2]. Immersive virtual reality can provide the feeling of presence and
extremely important information thru interactive environment to all players [2]. The development of a 3D
virtual environment is developed based on real situations of volleyball competition environment. A custom
made “Google Cardboard” was utilized to ensure that users can be immersed in the real environment
which is displayed inside the device. The exposure levels during the 3D imagery training are controlled
and increased gradually throughout the treatment program. The proposed intervention program can
perhaps be addressed during crucial skill development phase of amateur and novice players or during
mental rehearsal for competition conditions.If all the problems identified due to lack of mental training are
not resolved, volleyball players will further find their performance will never improve and reach the point of
stagnation at the higher levels or even the international stage althoughphysically and talent wise they are
on par with foreign athletes. Most often, at the highest level in sports, often the winning championship
points are won through sheer determination and will power of the players which is a testimony to both
their physical hard work and mental strength. At the lower level of sports, amateur or novice players will
often find it difficult to break through the invisible mental barriers, which prevent them from performing
their best at crucial times in tournament and stunted their progress to reach their full potential.
Design and Development
Before the design process, all the requirements had to be established in an analysis phase. Therefore, a
preliminary study was conducted to identify the pre-competition state anxiety level among Malaysia
volleyball players. The findings from this study indicated that the pre-competition state anxiety level
among Malaysia volleyball players were high. Additionally, most of these players had never been involved
in sport psychology training sessions other than the conventional video playback method. Therefore,
there is an opportunity to create a 3D virtual environmentas a tool to overcome pre-competition state
anxiety based on the results revealed in the preliminary study. The purpose of the development stage is
to design, develop and validate a 3D virtual environment as a psychological training tool. The work
consists with two types of development in this stage: a) software development of a 3D virtual
environment, b) development of a custom “Google Cardboard” HMD device as the display hardware.](https://image.slidesharecdn.com/fcfae7cb-afca-4125-9408-72091dd30730-161107043714/85/International_Journal_Volume_23-152-320.jpg)
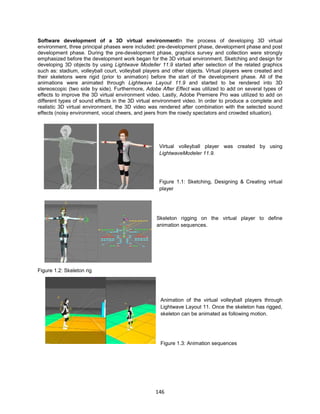
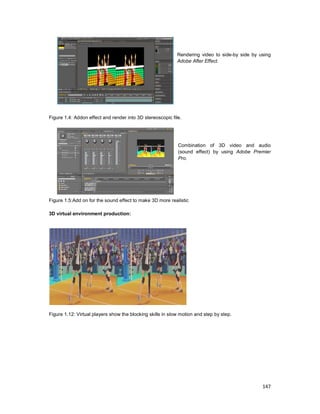
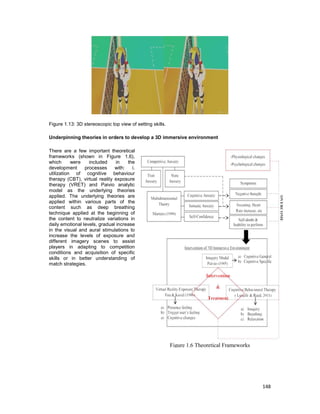
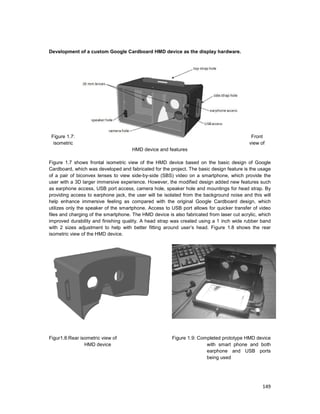
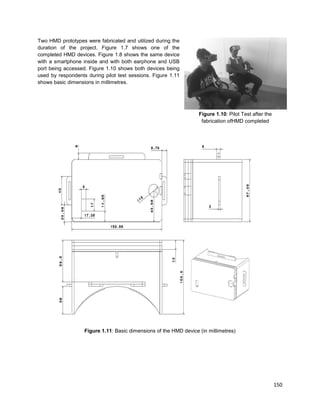
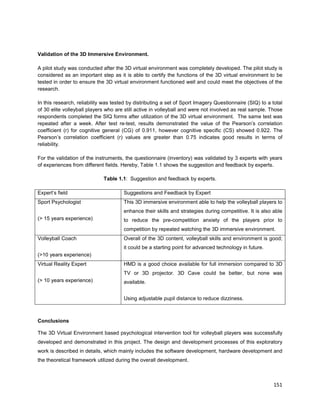
![152
Evaluation of the tool revealed high levels of reliability and furthermore, feedbacks from experts from
related fields also indicated effectiveness in reducing the pre-competition anxiety levels, good contents for
volleyball skills and good choice of using HMD for better user immersion.Additionally, there are several
areas that can be further explored and improved upon based on the findings of this work such as; i. Real
time head tracking and response of the virtual environment to user’s physical movement of their body and
head, and ii. New development of haptic feedback hardware on specific body parts (in contact with the
moving projectile) such as forearms, fingers and palm of the hand to increase realism and increase
presence of the 3D virtual environment.
References
[1] Rose, F. D. and Foreman, N. P. (1999). Virtual reality. The Psychologist, 12, 550-554.
[2]Benoit Bideau et al., (2010) Bull, S. J. (1995). Reflections on a 5-year consultancy program with the
England women's cricket team. The Sport Psychologist, 9, 148-163.
[3]Williams, A. M. and Grant, A. (1999). Training perceptual skill in sport. International Journal of Sport
Psychology, 30, 194-220.
[4]Lee, T. D., Chamberlin, C. J. and Hodges, N. J. (2001). Practice. In Singer, R. N., Hausenblas, H. A. &
Janelle, C. M. (Eds.), Handbook of sport psychology (2nd ed., pp. 115–143). New York: Wiley.
[5] Goldberg, A. S. (2015). Volleyball player and peak performance. Retrieved 13 July, 2015, from
http://www.competitivedge.com/catalog/volleyball
[6] Jilun.S.L.H. (2004). Perbezaan tahap kebimbangan sebelum pertandingan dikalangan pemain bola
tampar lelaki dan wanita Universiti Pendidikan Sultan Idris, semasa pemilihan pemain untuk menyertai
MASUM pada Oktober 2003. Thesis. Universiti Pendidikan Sultan Idris, Tanjung Malim.
[7] Kassim,Z. (2003). Perbandingan tahap kebimbangan seketika dan keyakinan diri sebelum
pertandingan dikalangan pemain bola tampar UPSI dalam kejohanan sukan MASUM 2002. Thesis.
Universiti Pendidikan Sultan Idris, Tanjung Malim.](https://image.slidesharecdn.com/fcfae7cb-afca-4125-9408-72091dd30730-161107043714/85/International_Journal_Volume_23-159-320.jpg)
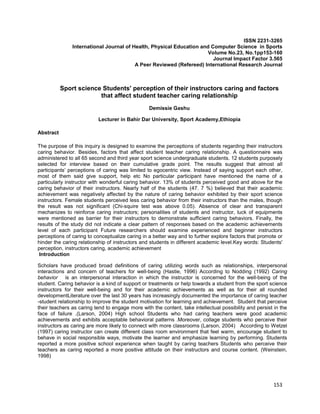
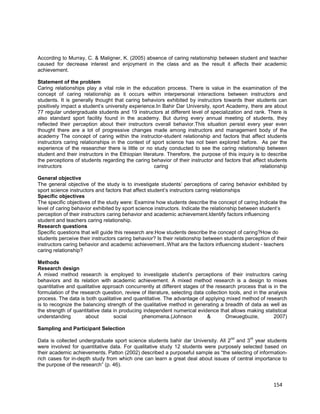
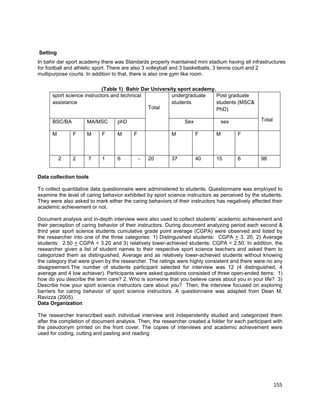
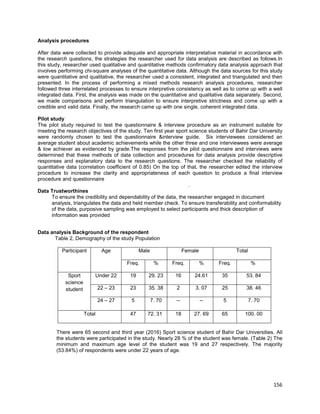
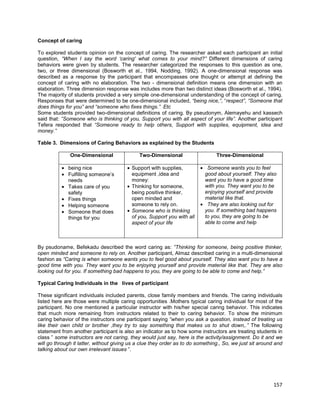
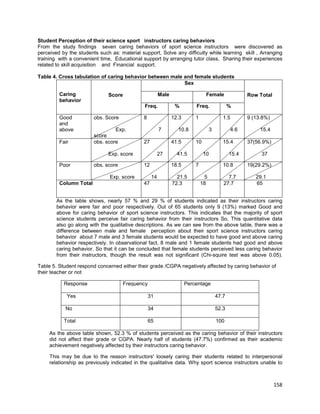
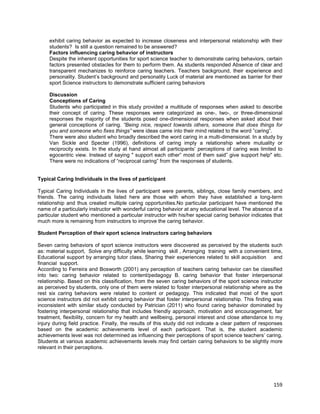
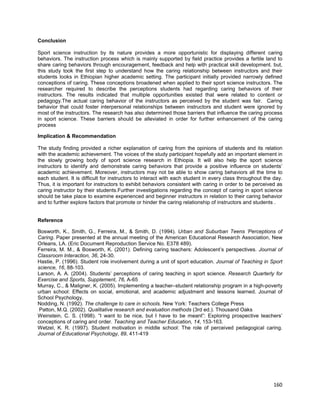
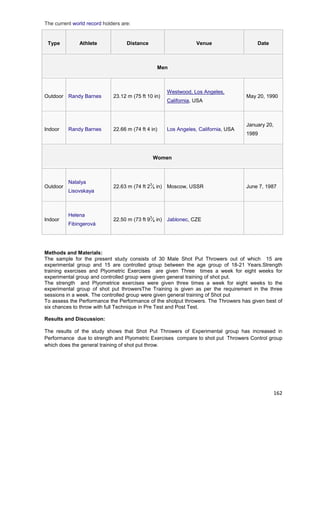
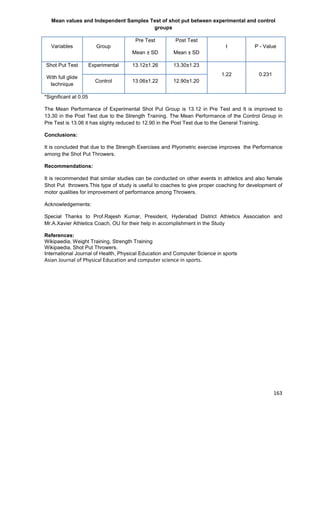

This study examined the relationship between selected anthropometric variables and performance among high school male kabaddi players in Mandya District, India. The anthropometric variables assessed were height, leg length, arm length, and ideal weight. The purpose was to predict kabaddi performance from these anthropometric measures. It was found that physical structure, especially height and leg length, provided advantages in kabaddi. The study aimed to increase understanding of anthropometric demands for kabaddi performance at different levels.


