Download as PDF, PPTX
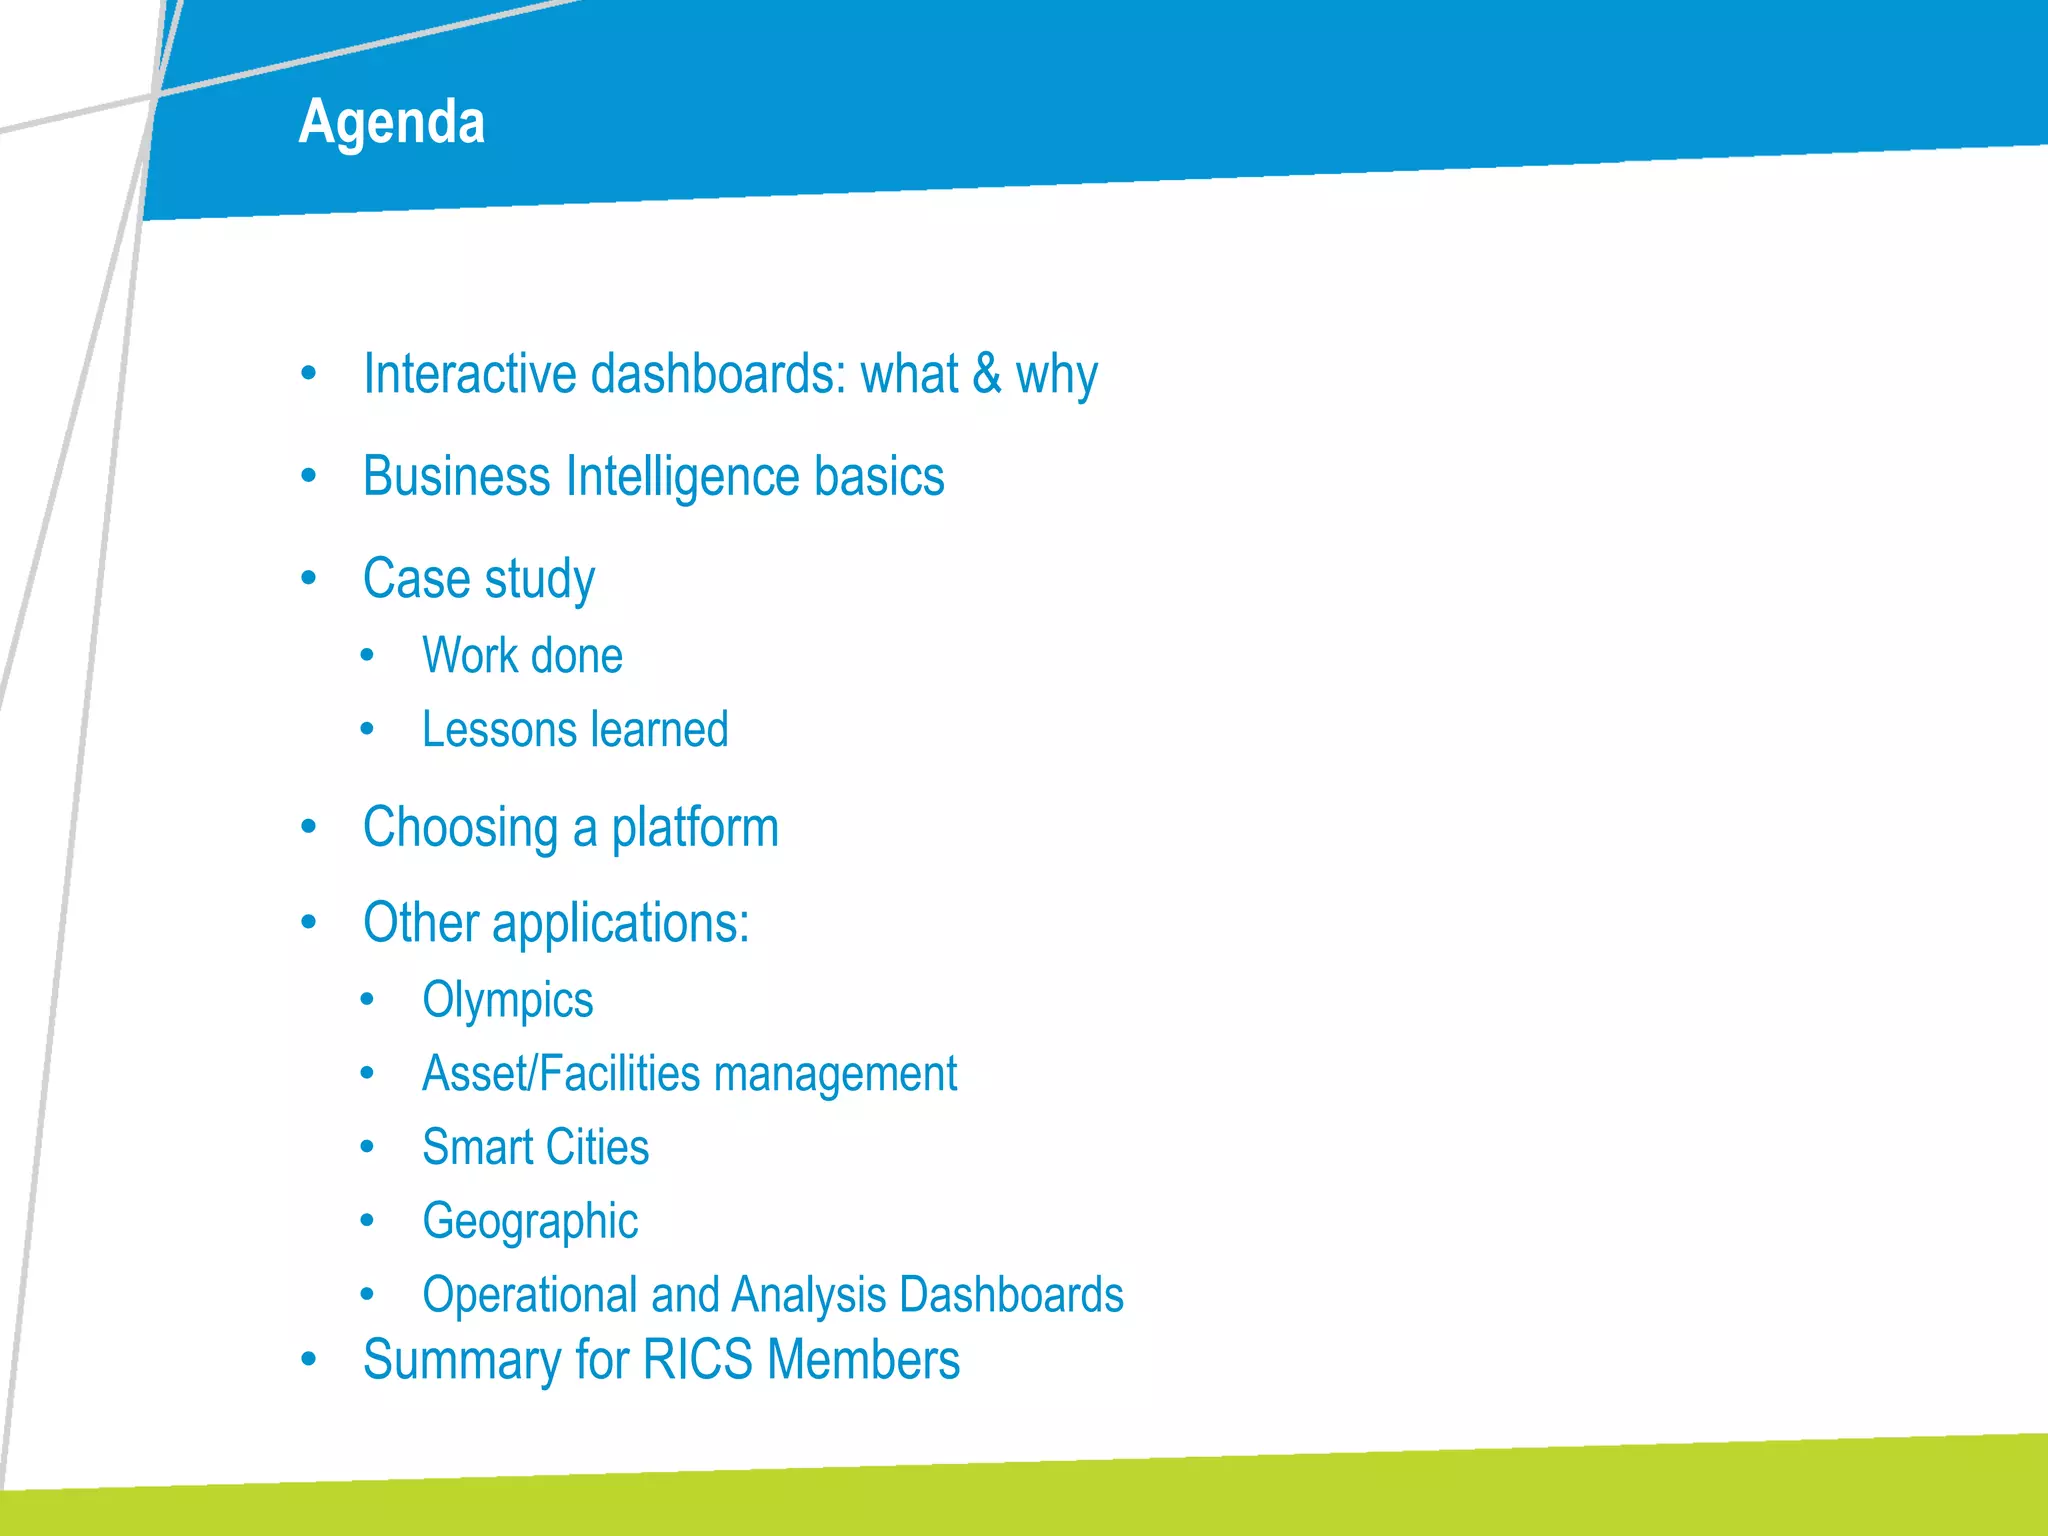
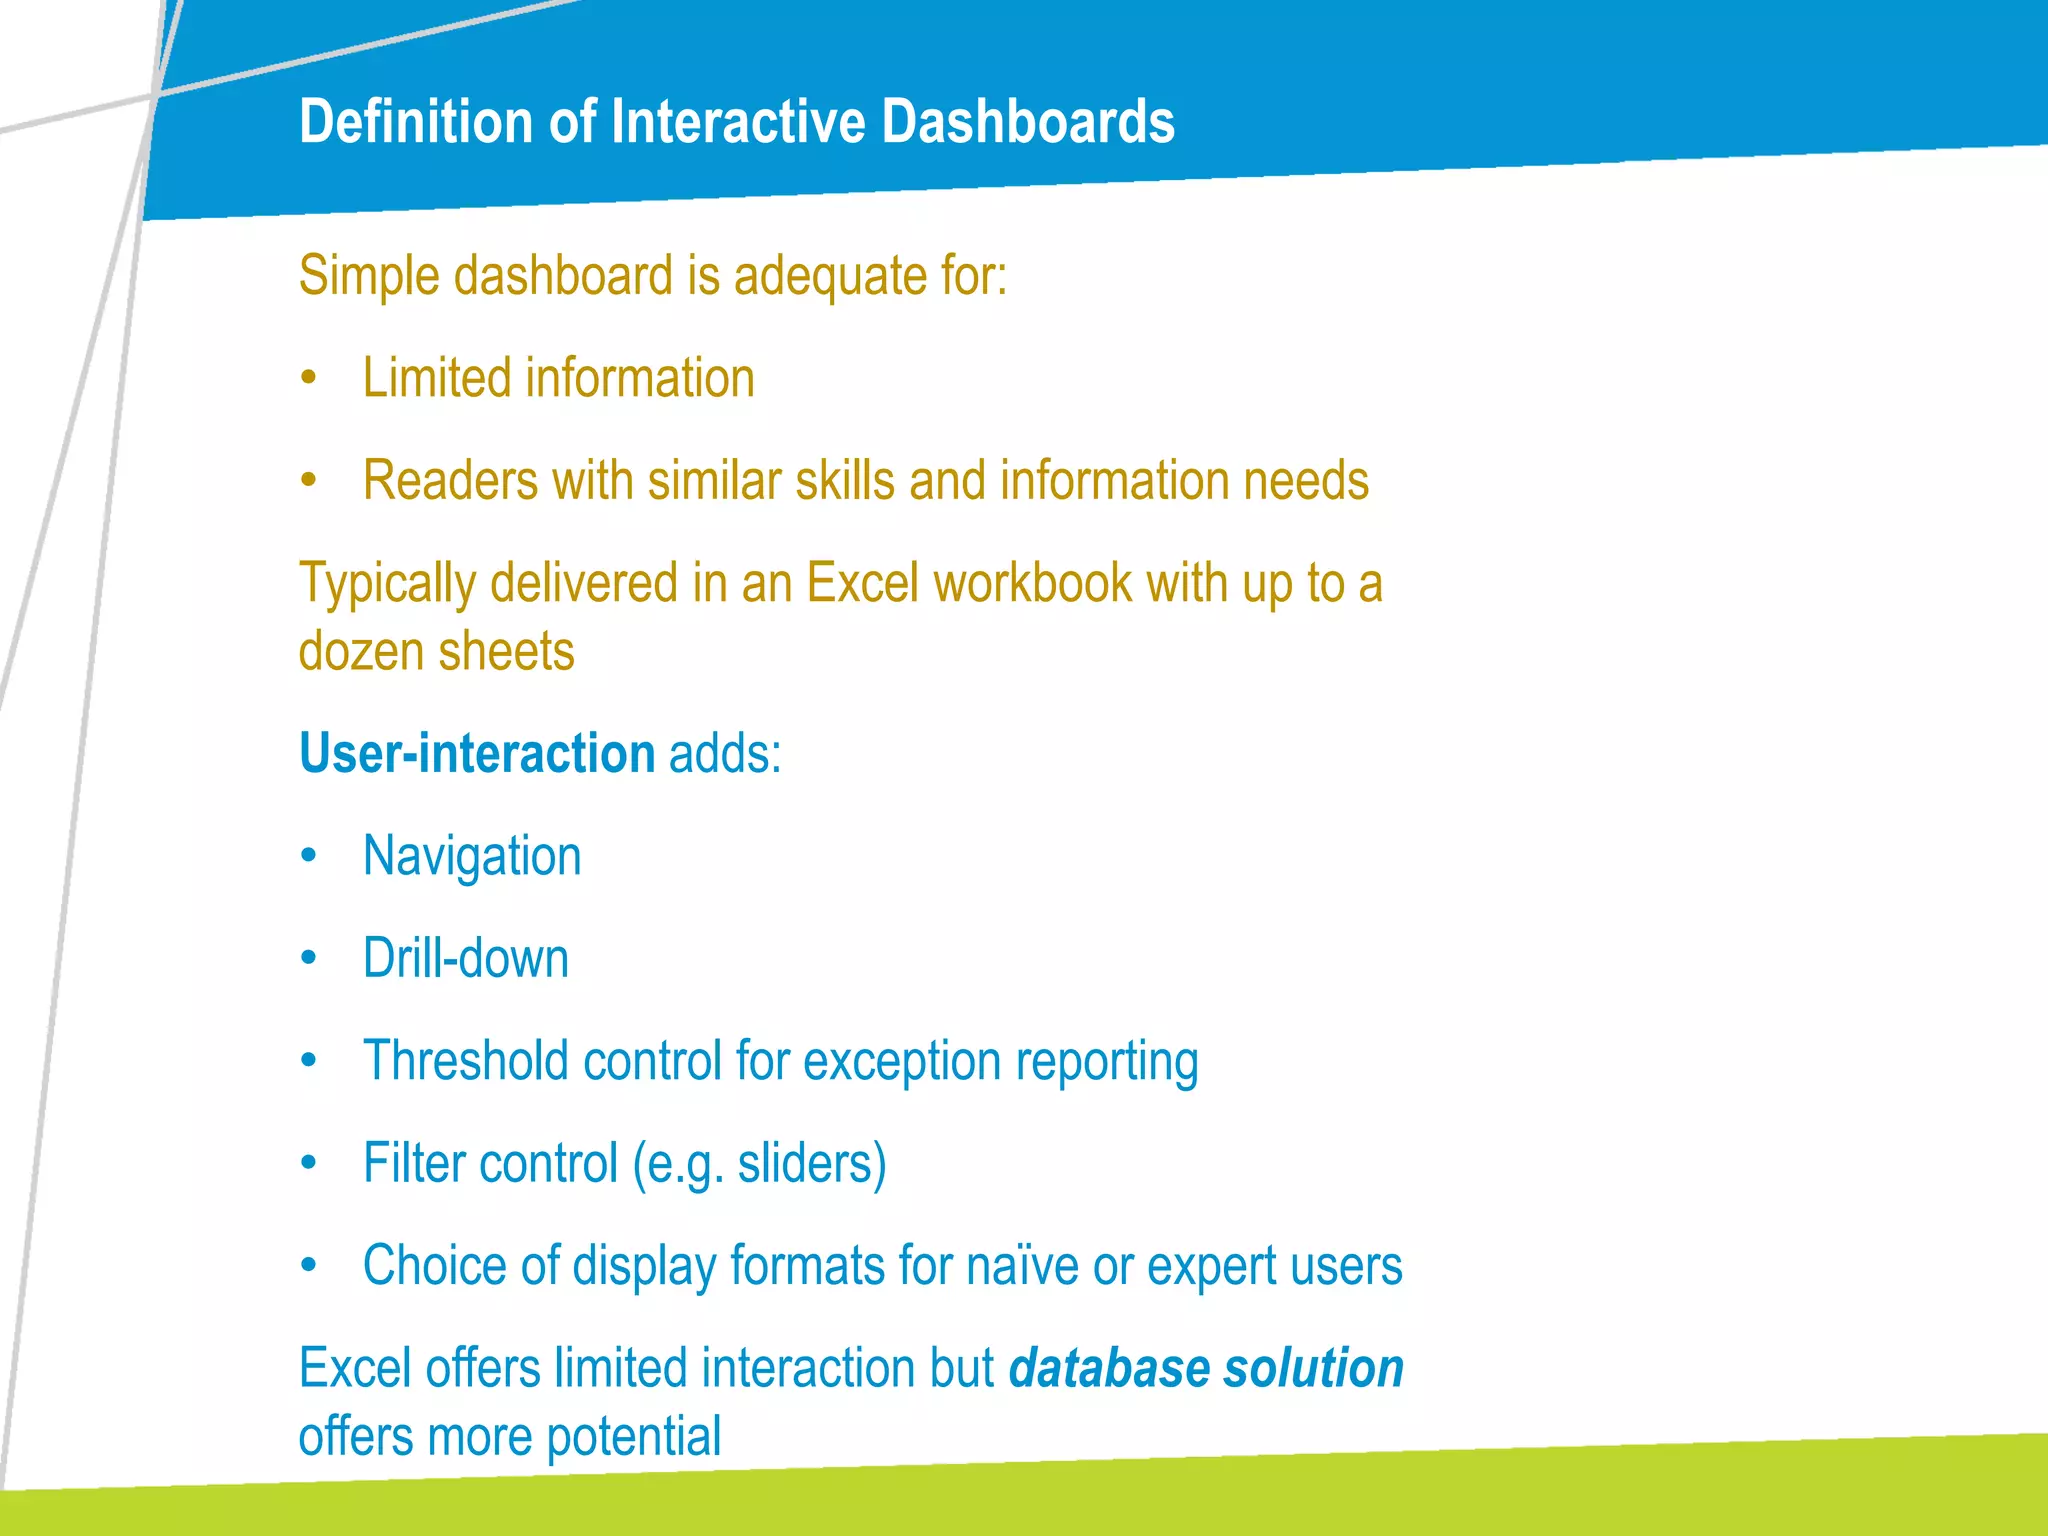
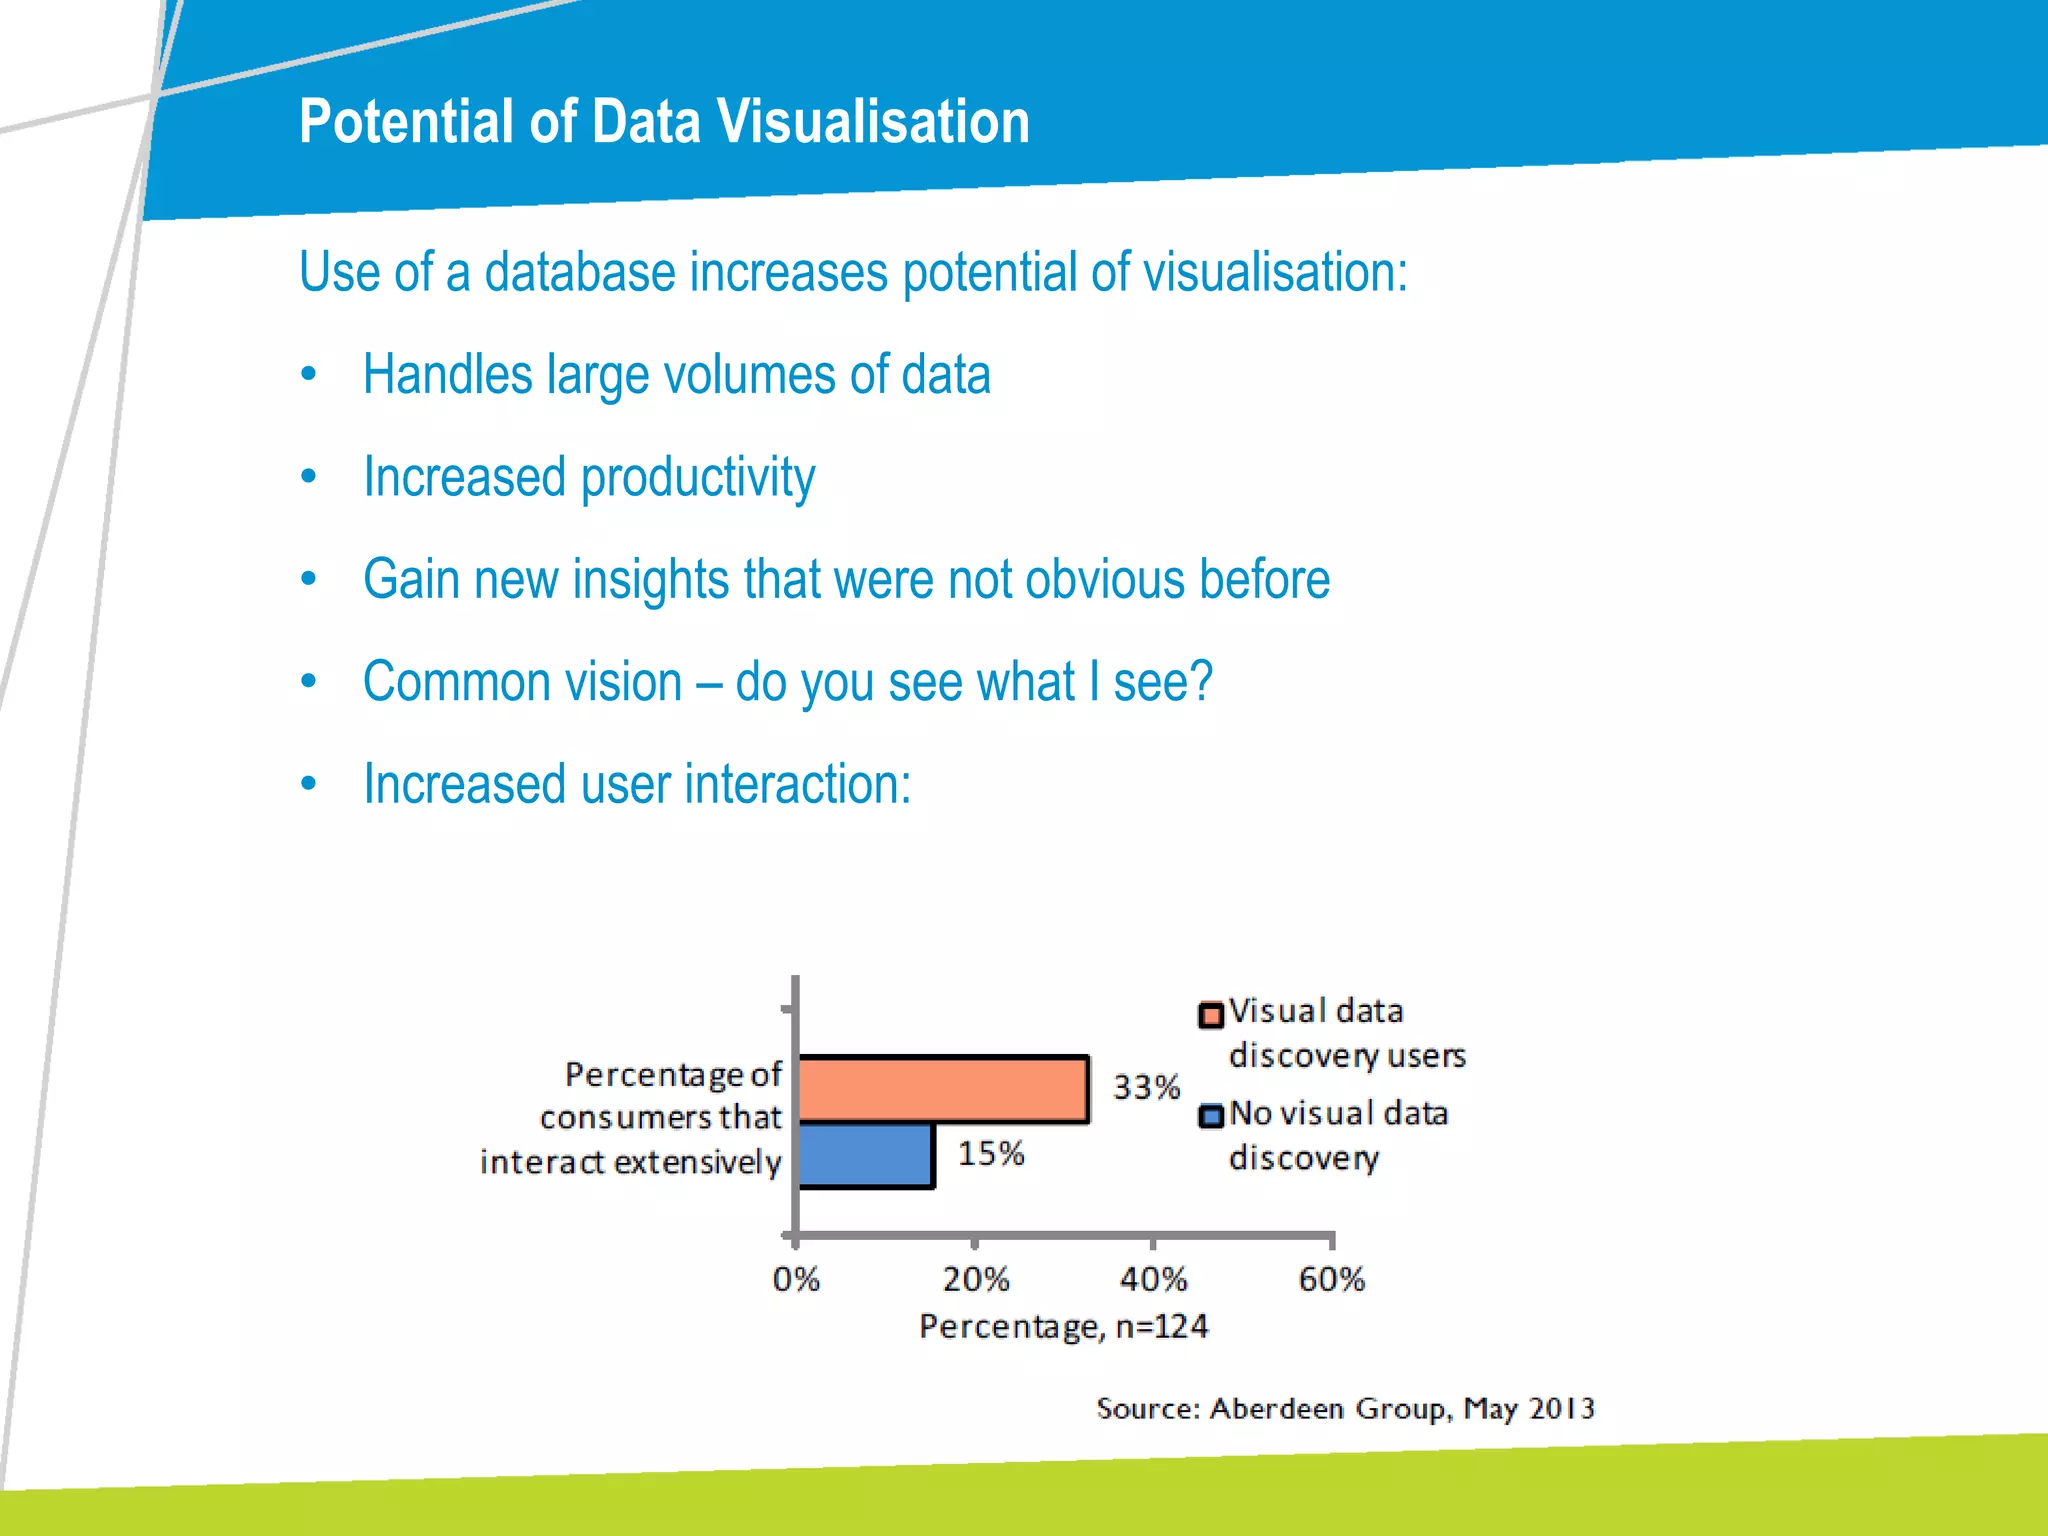
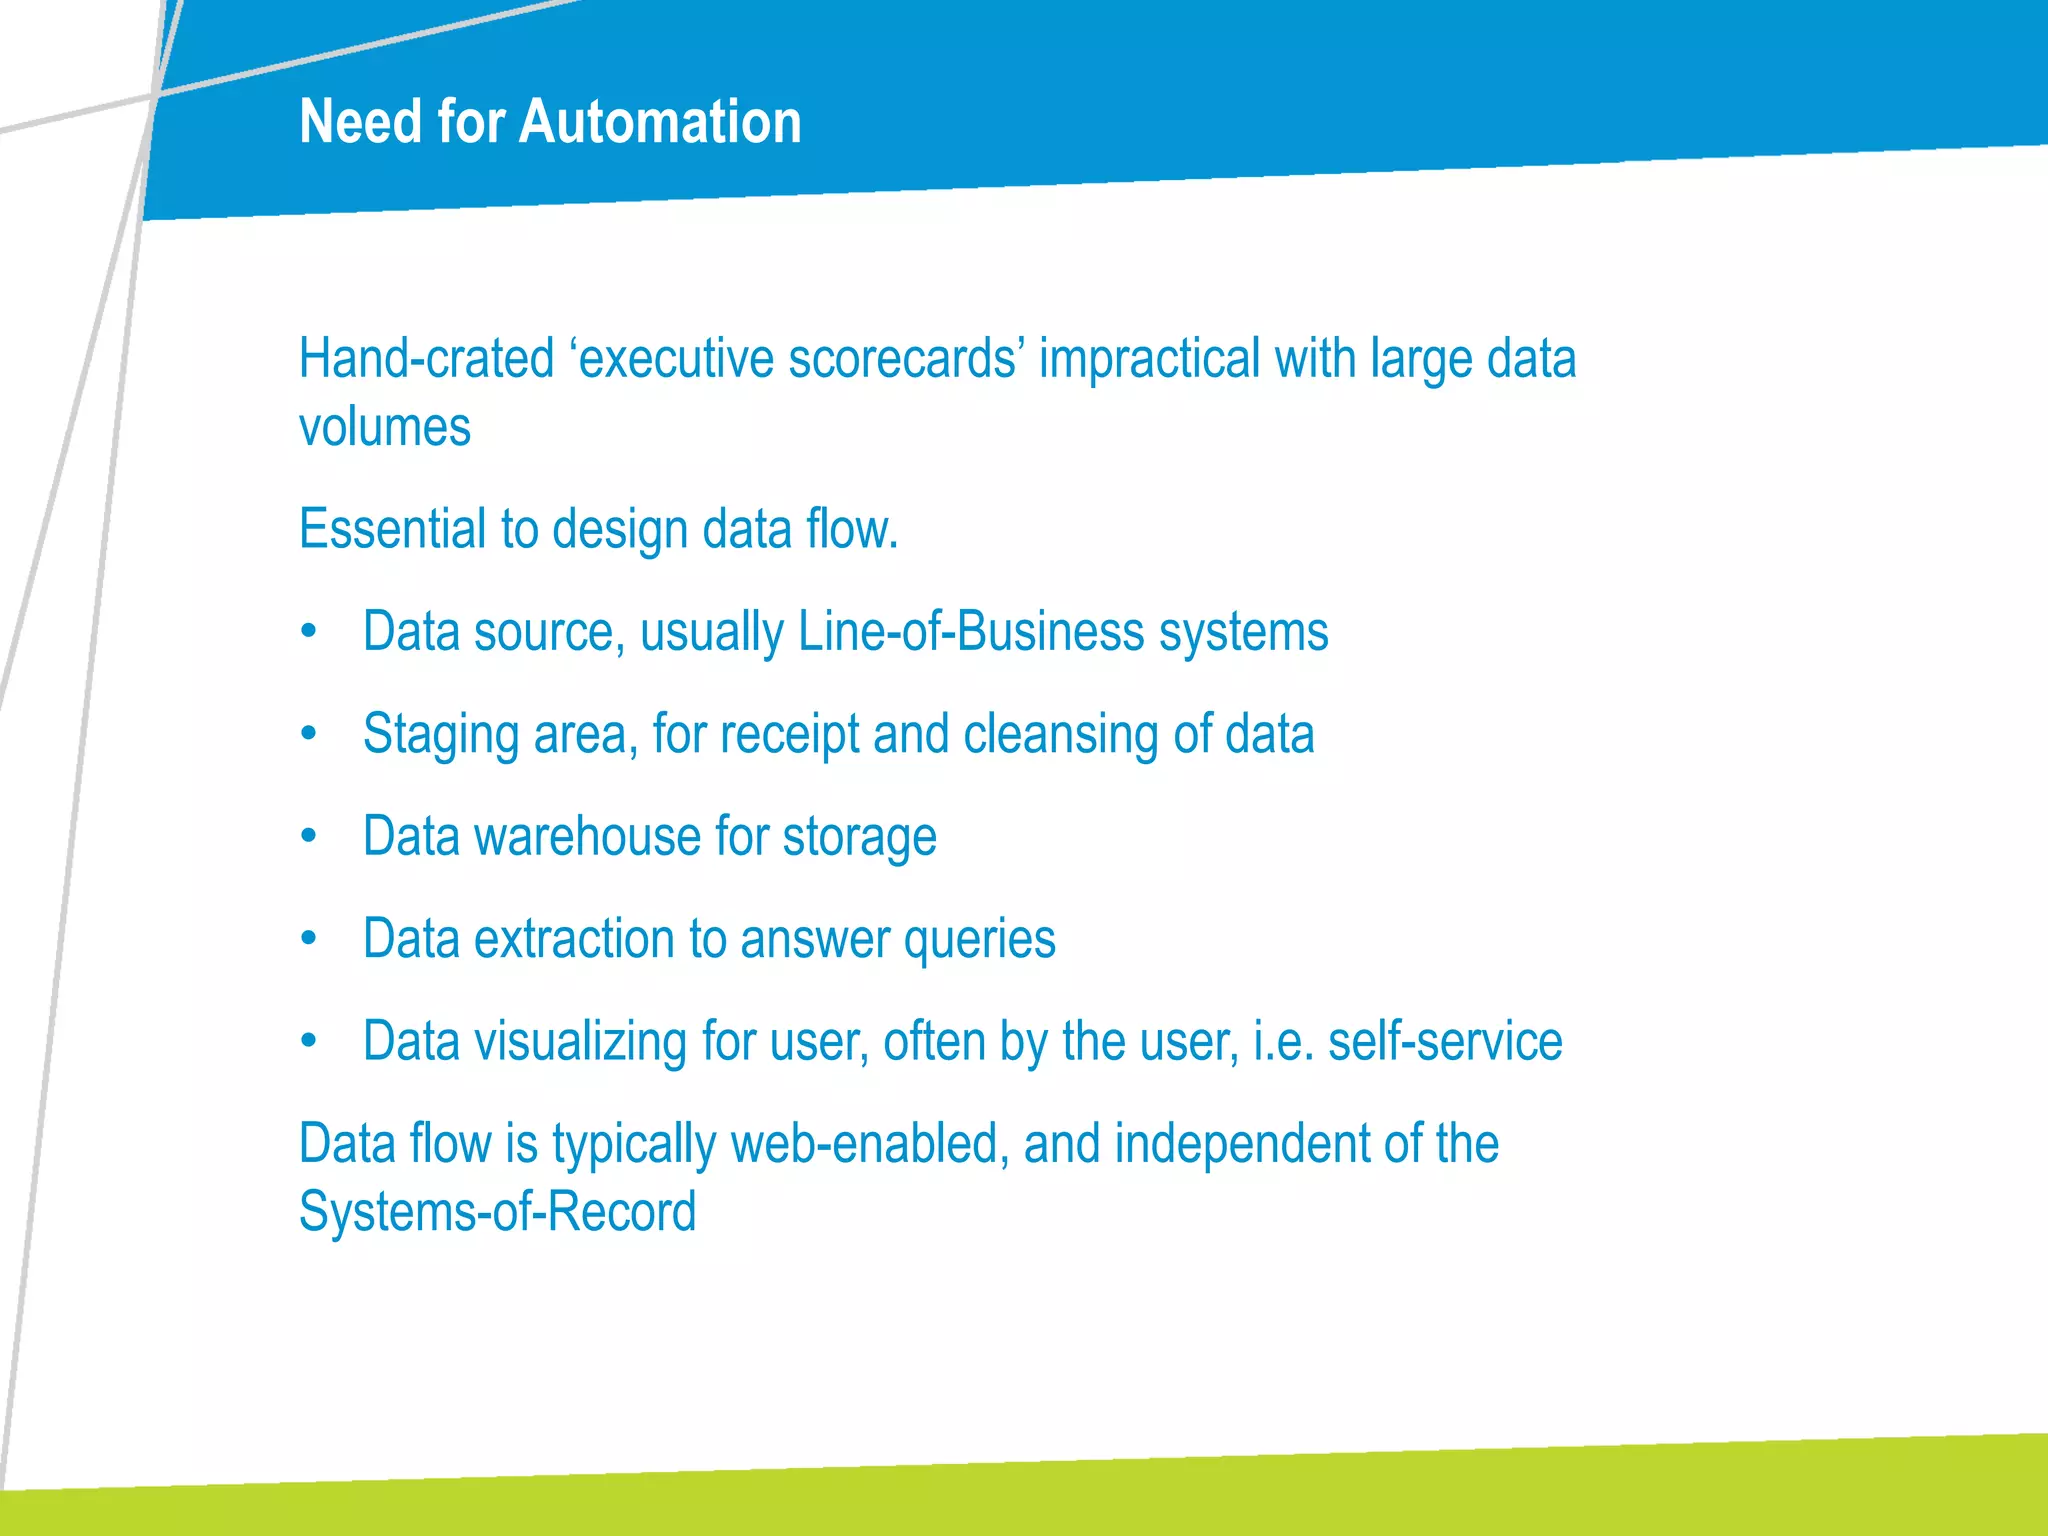
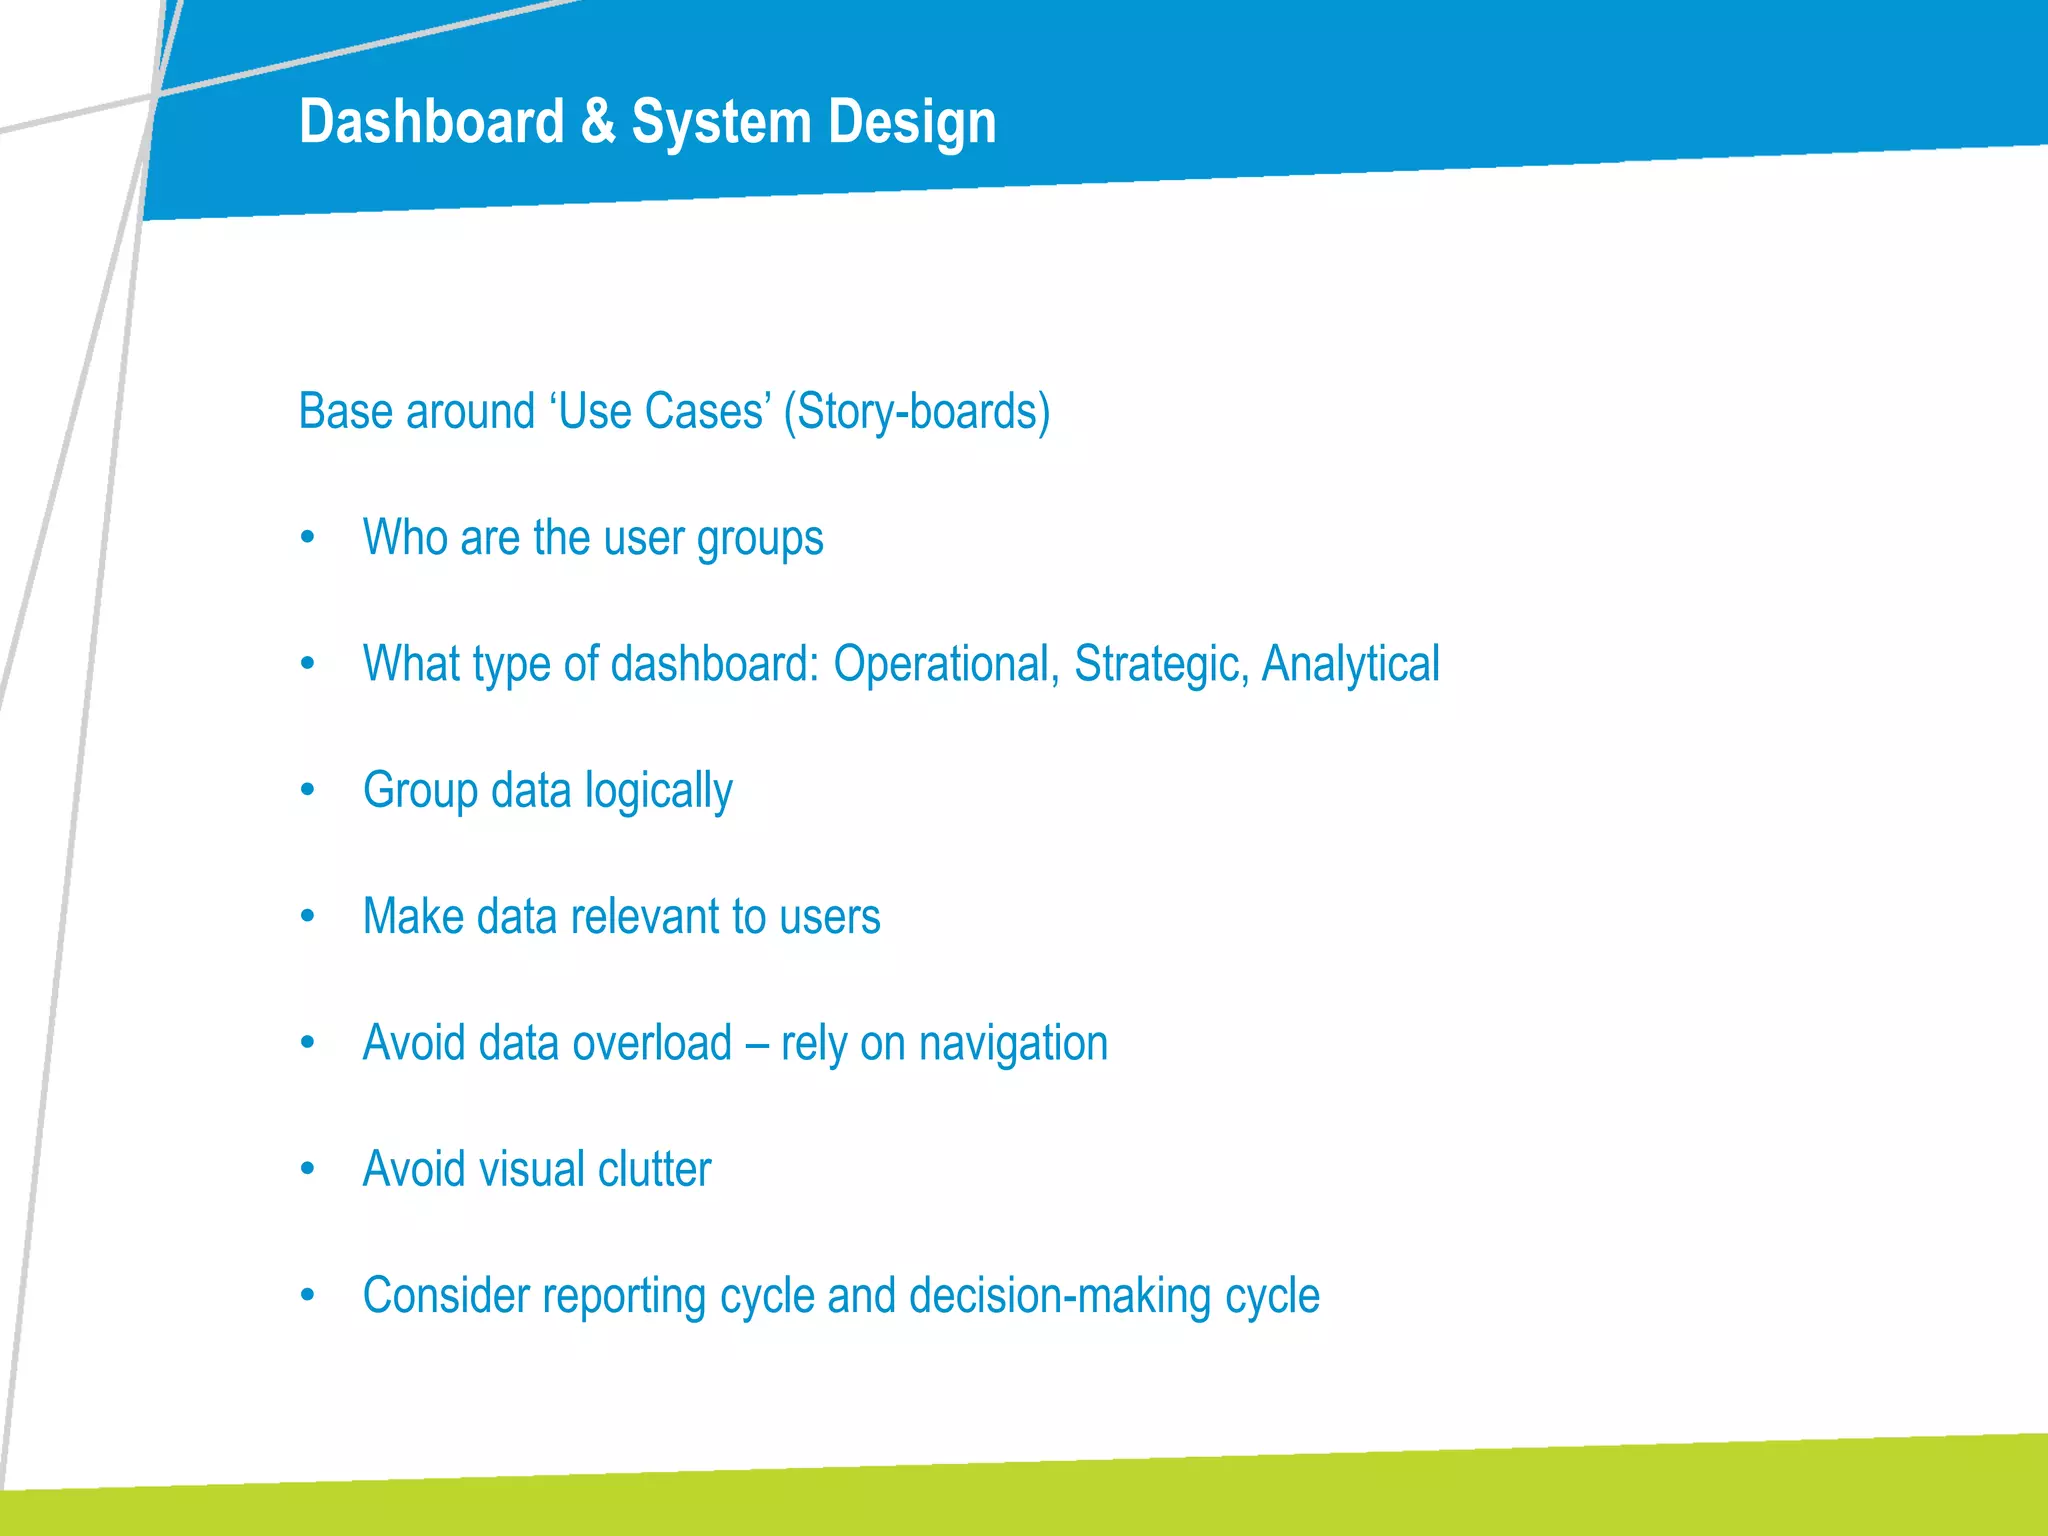

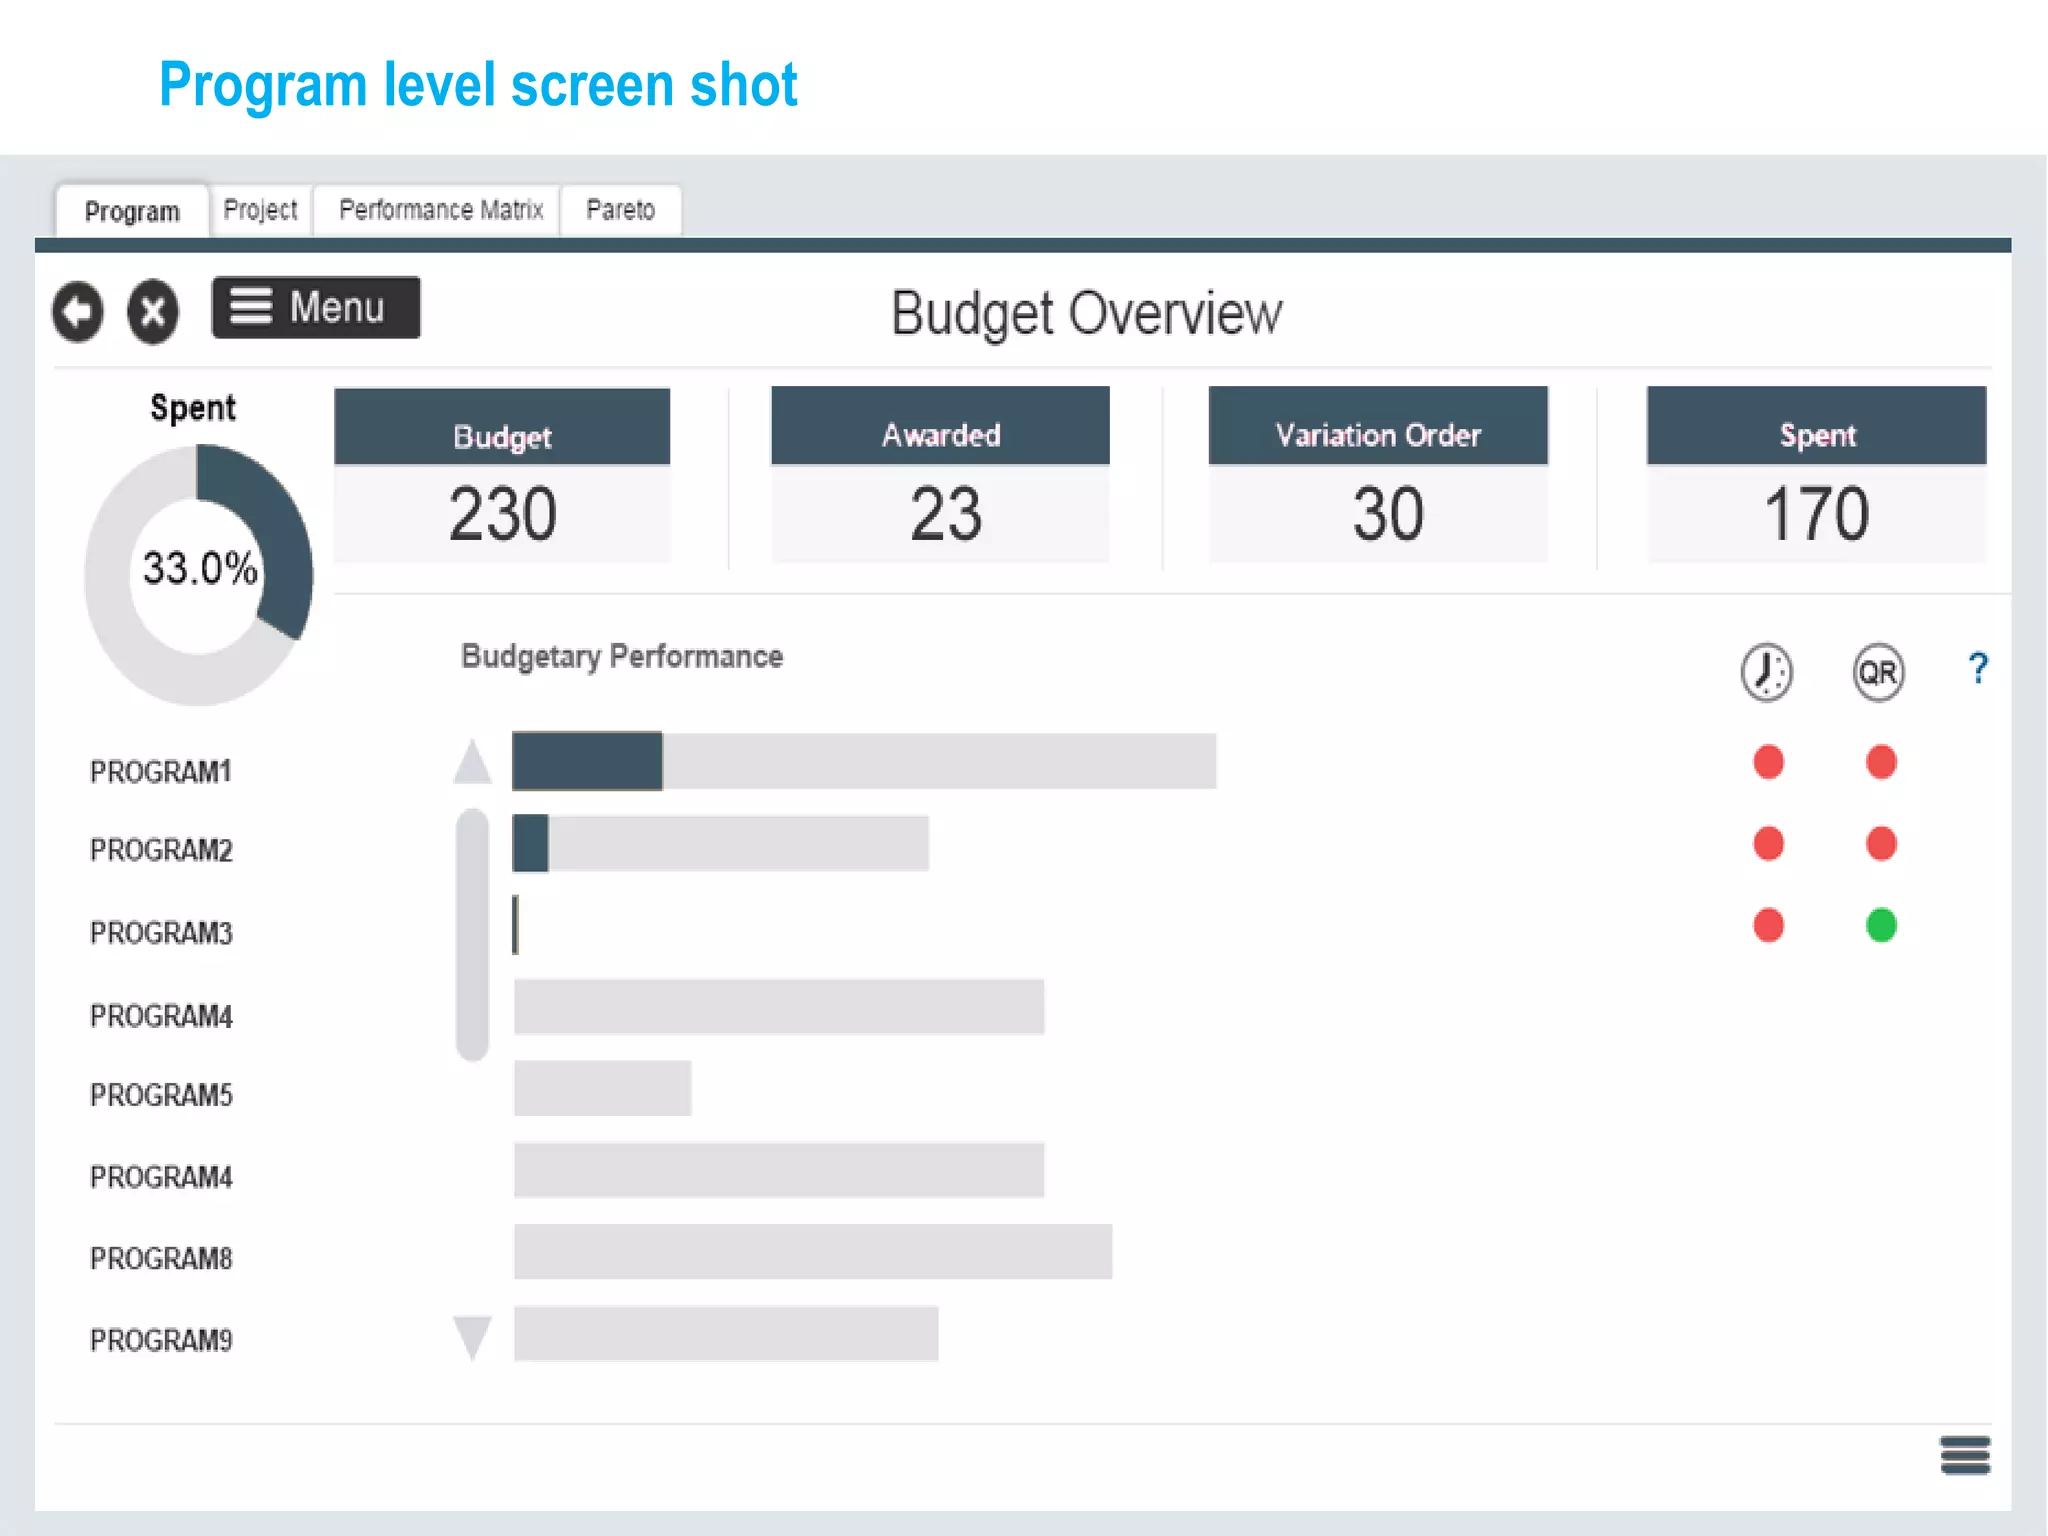
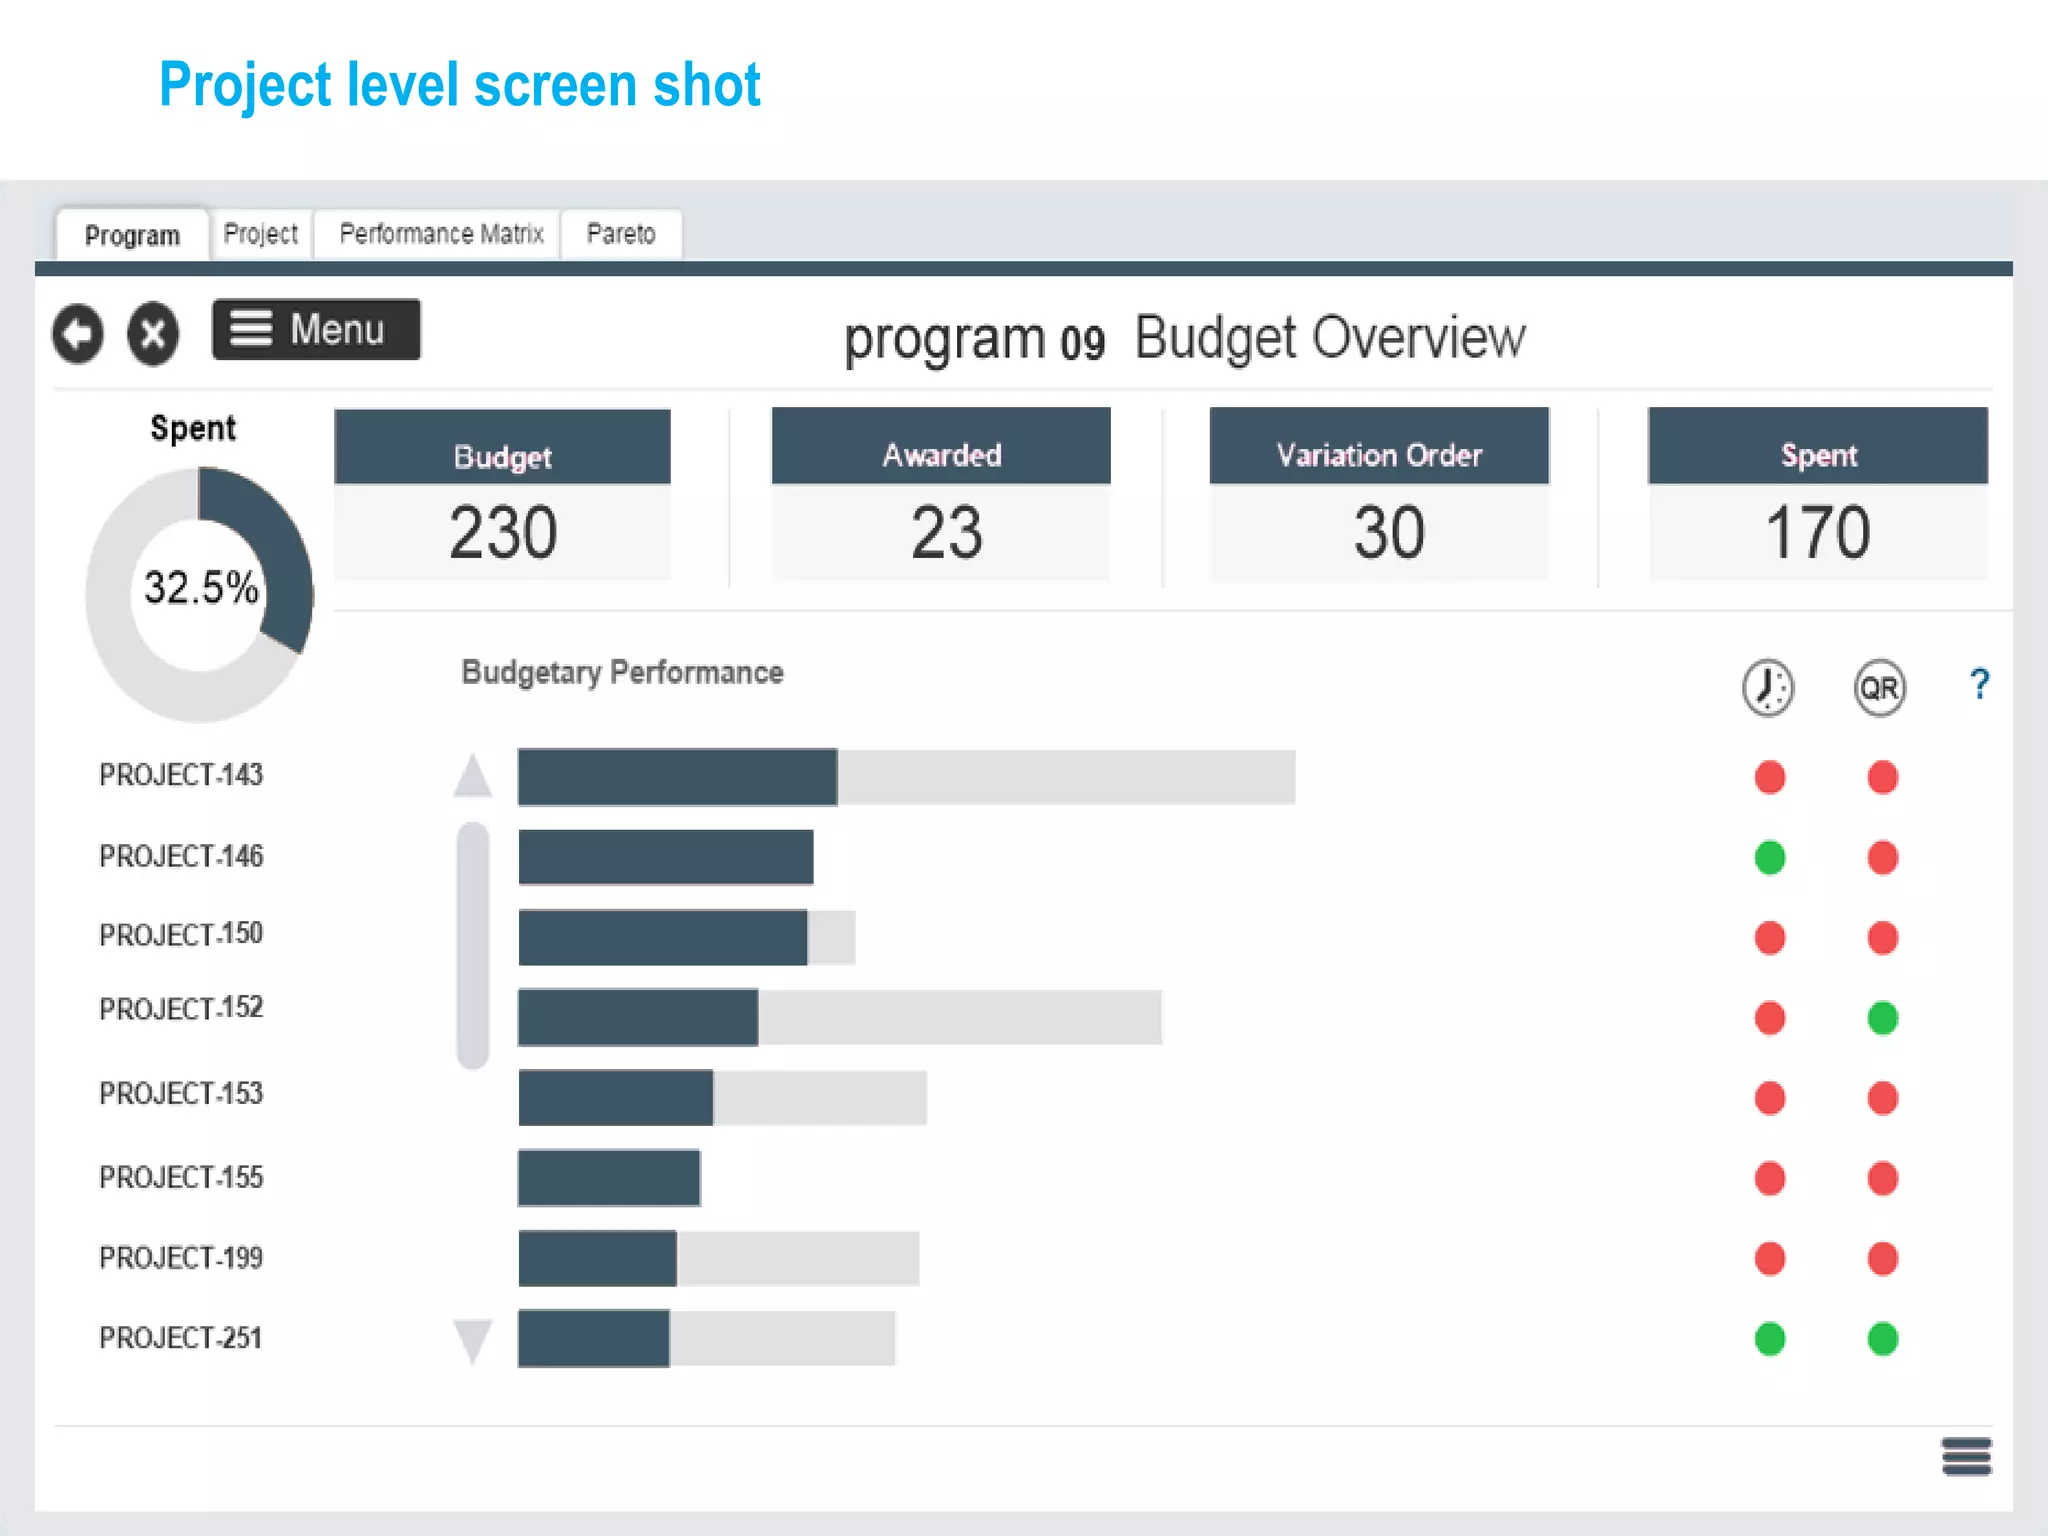
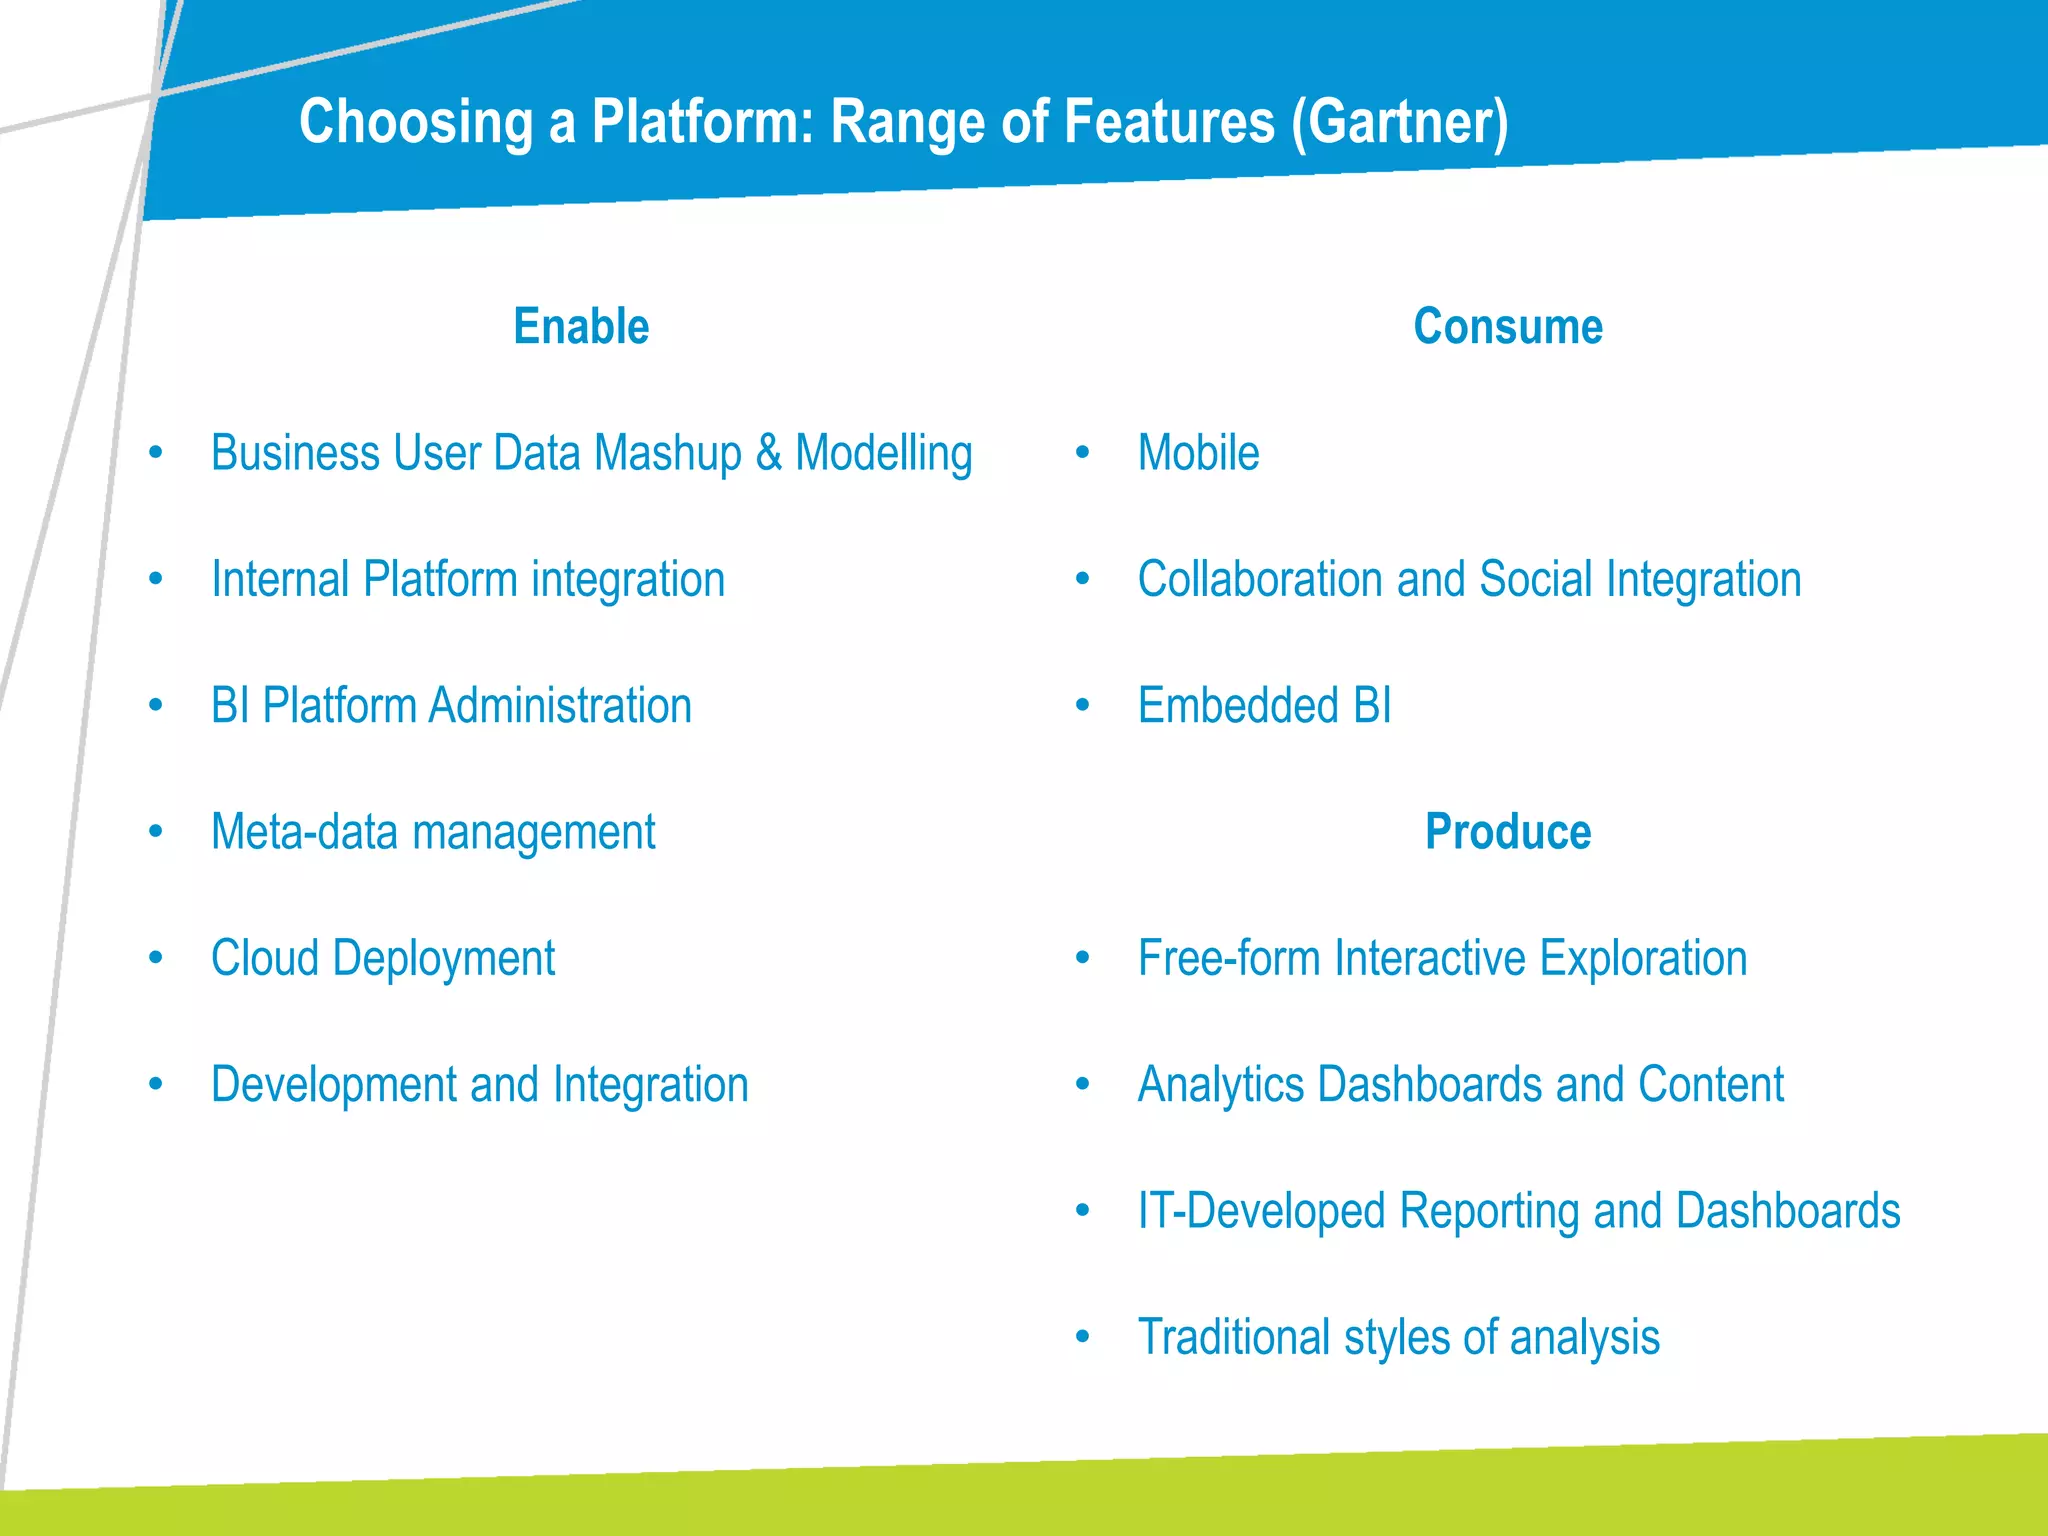
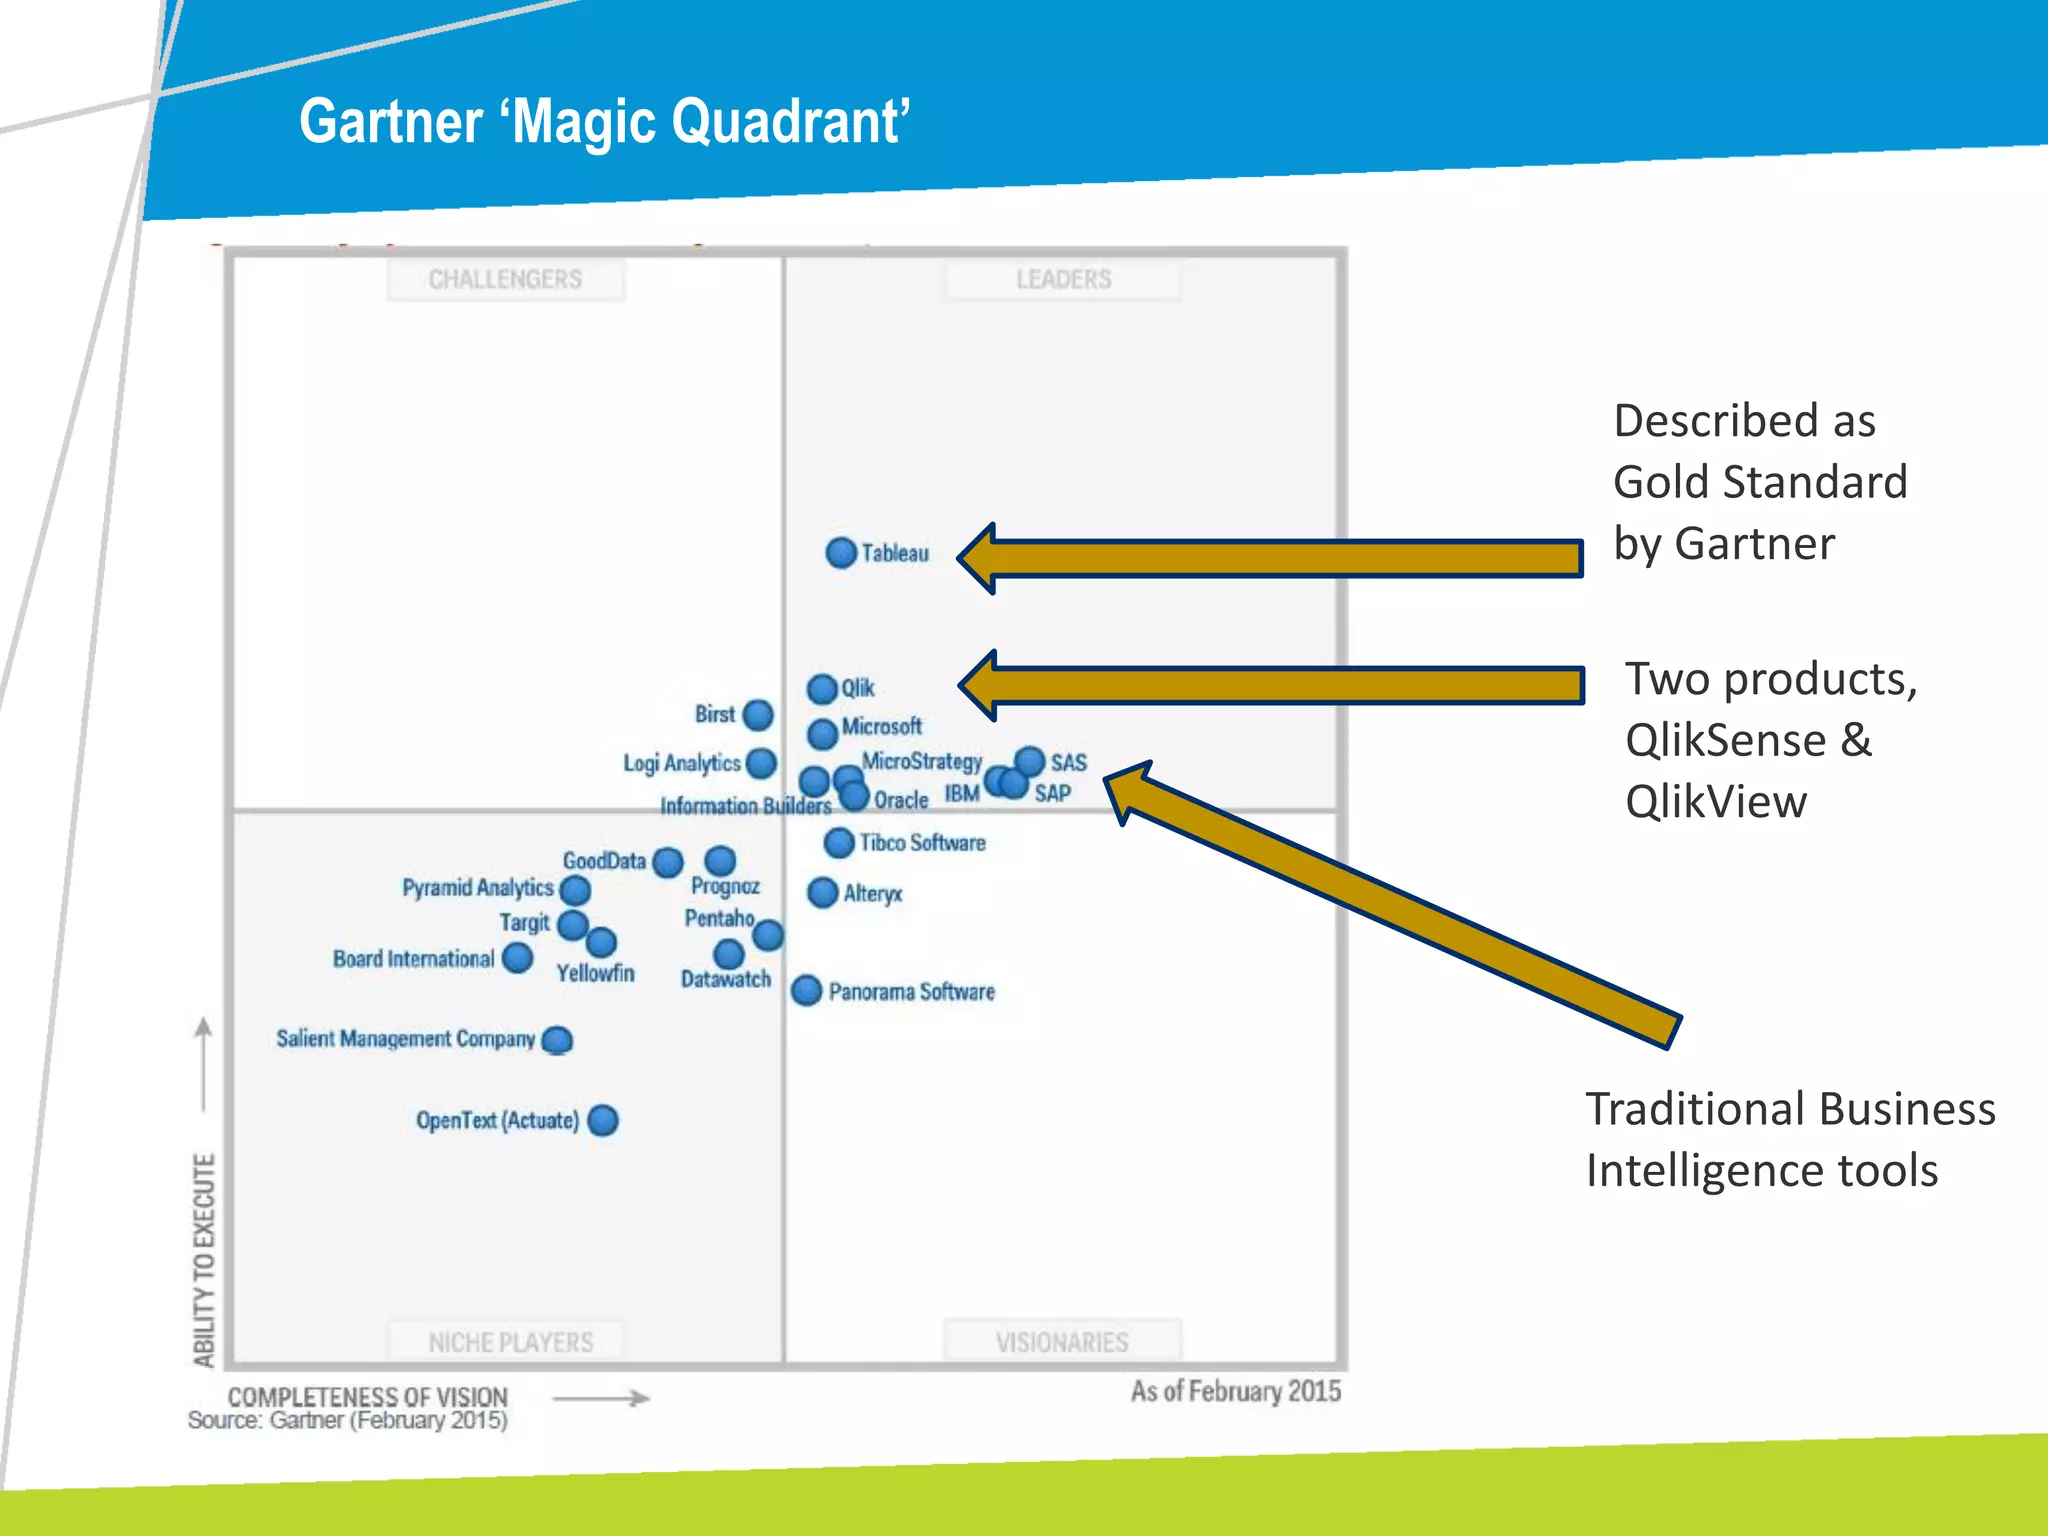
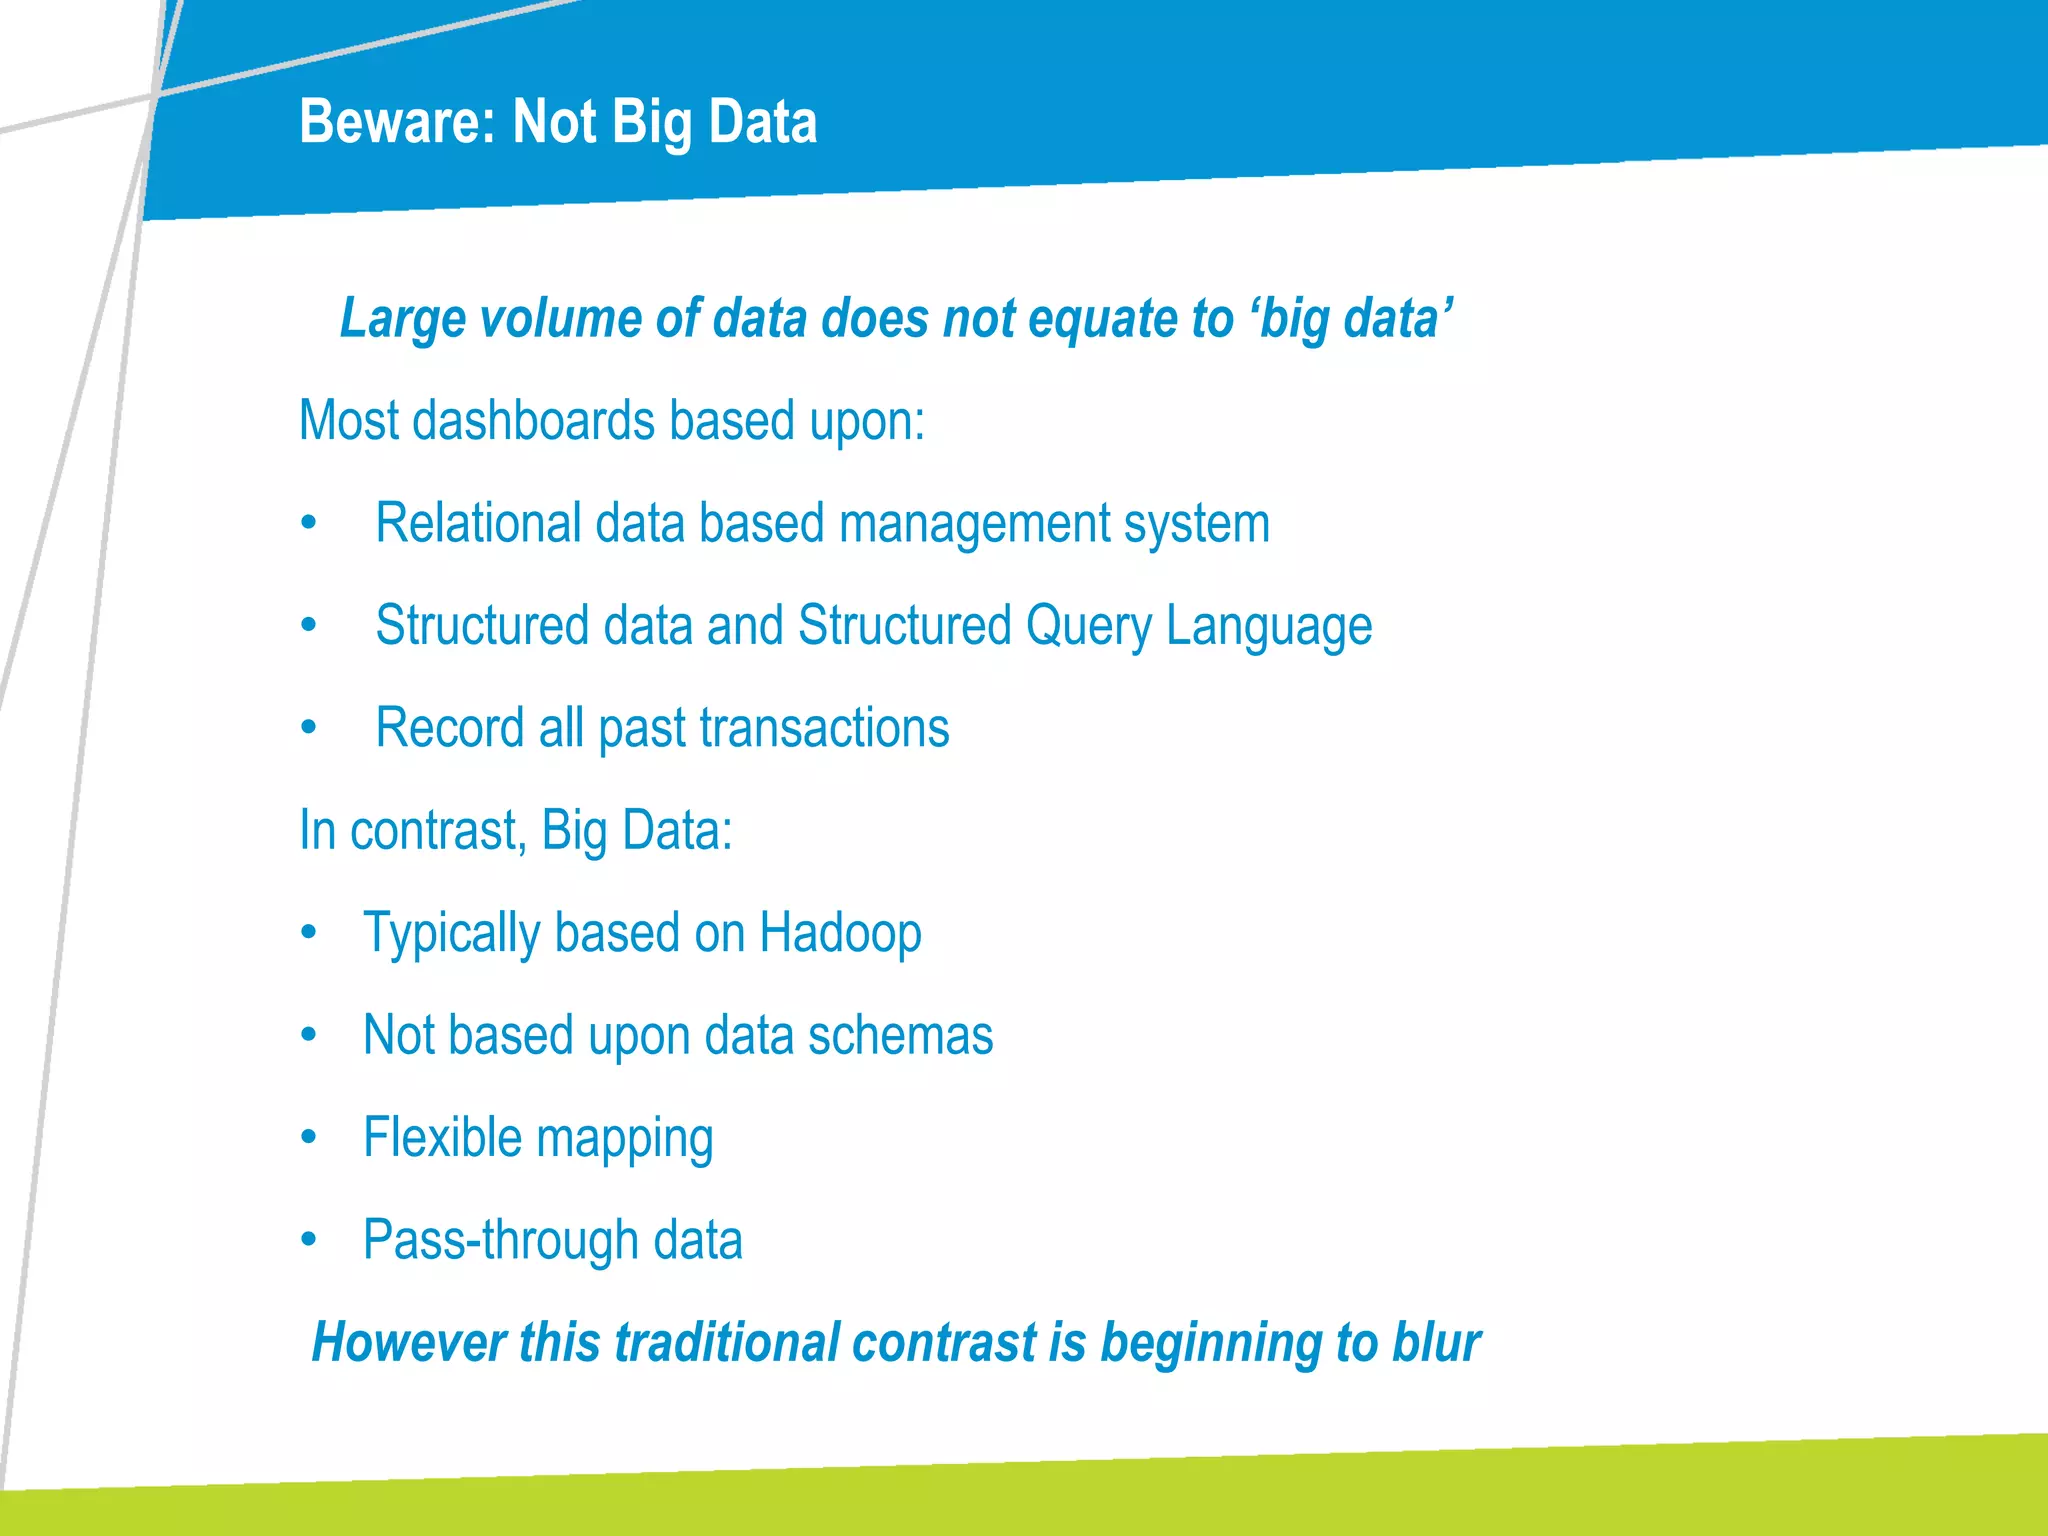
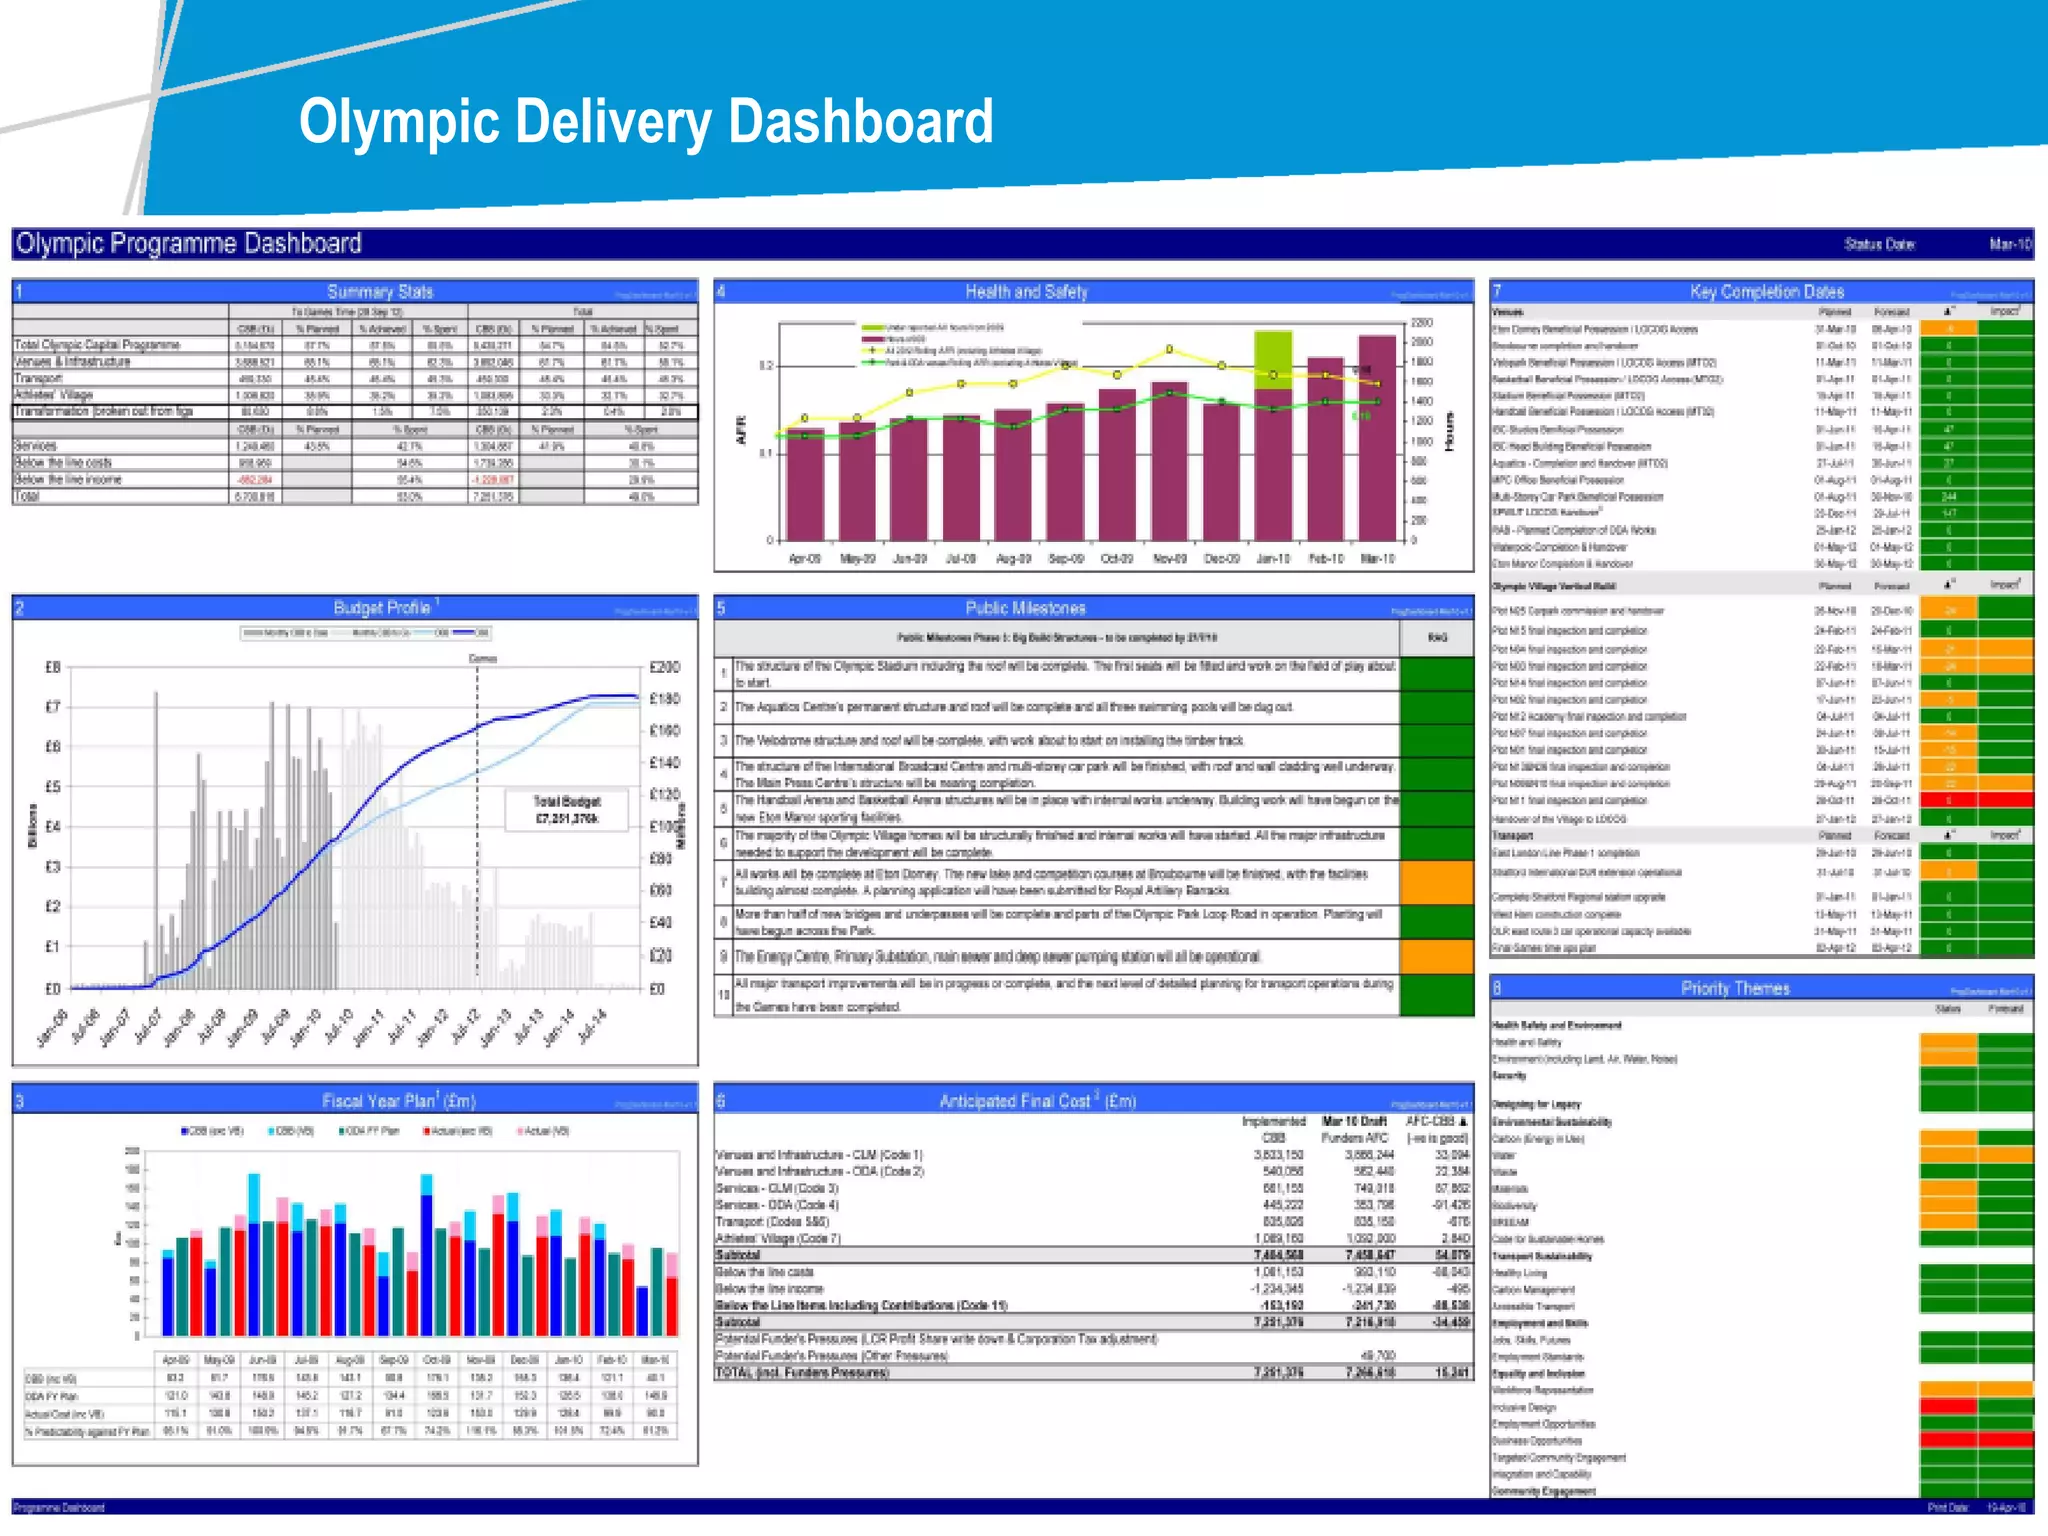
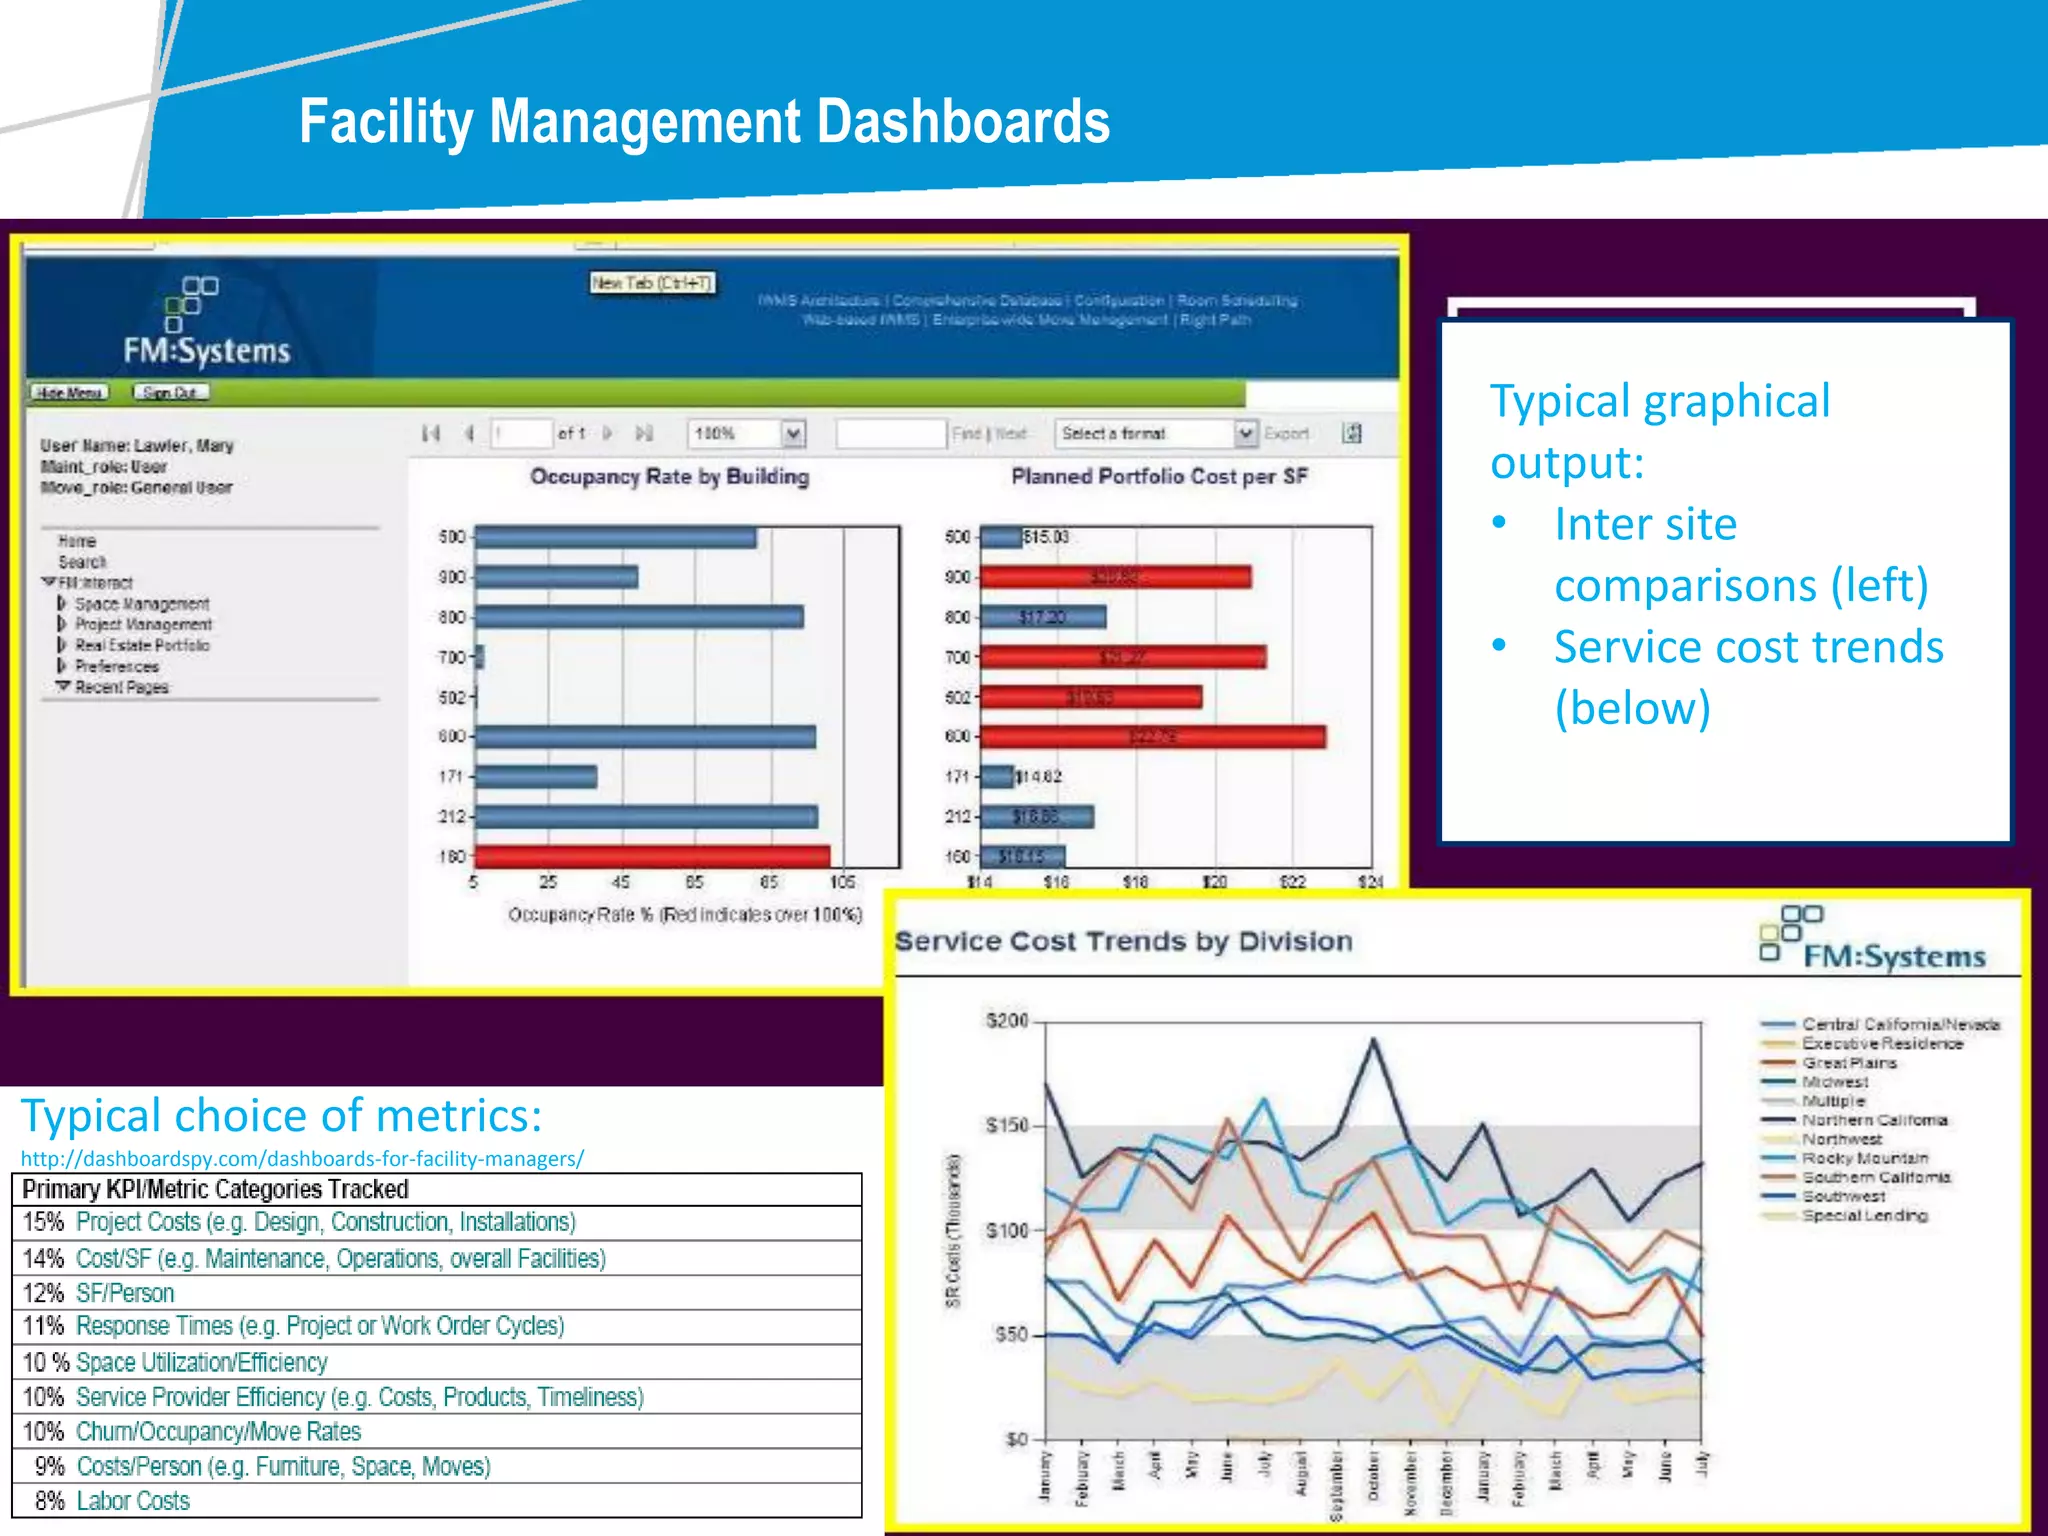
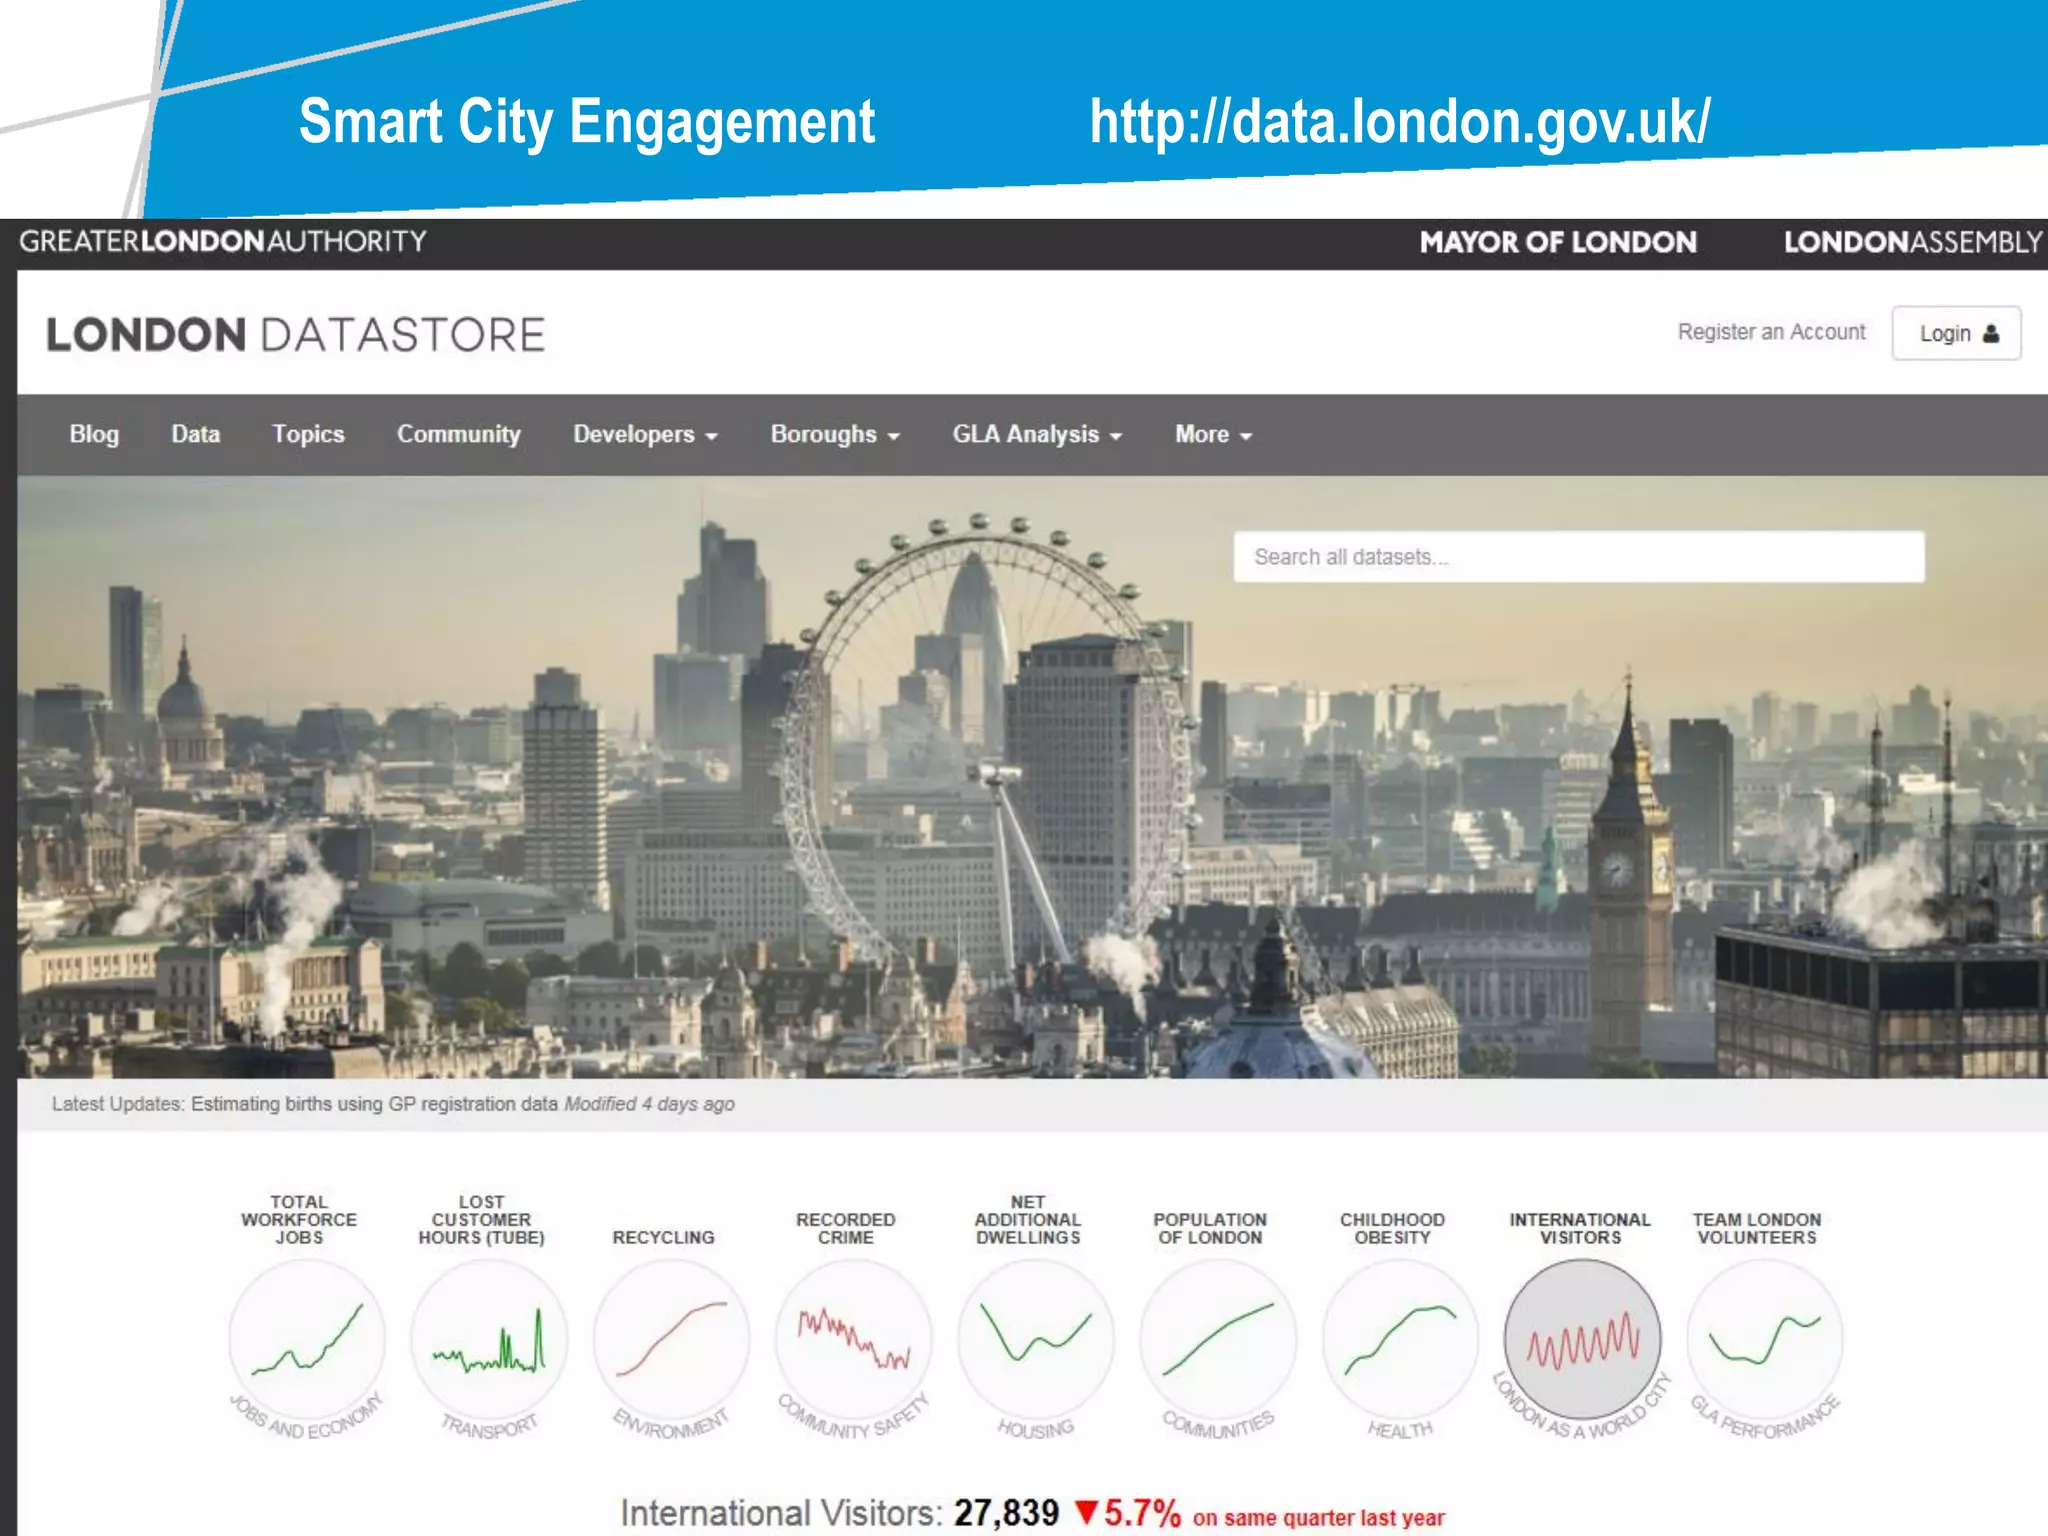
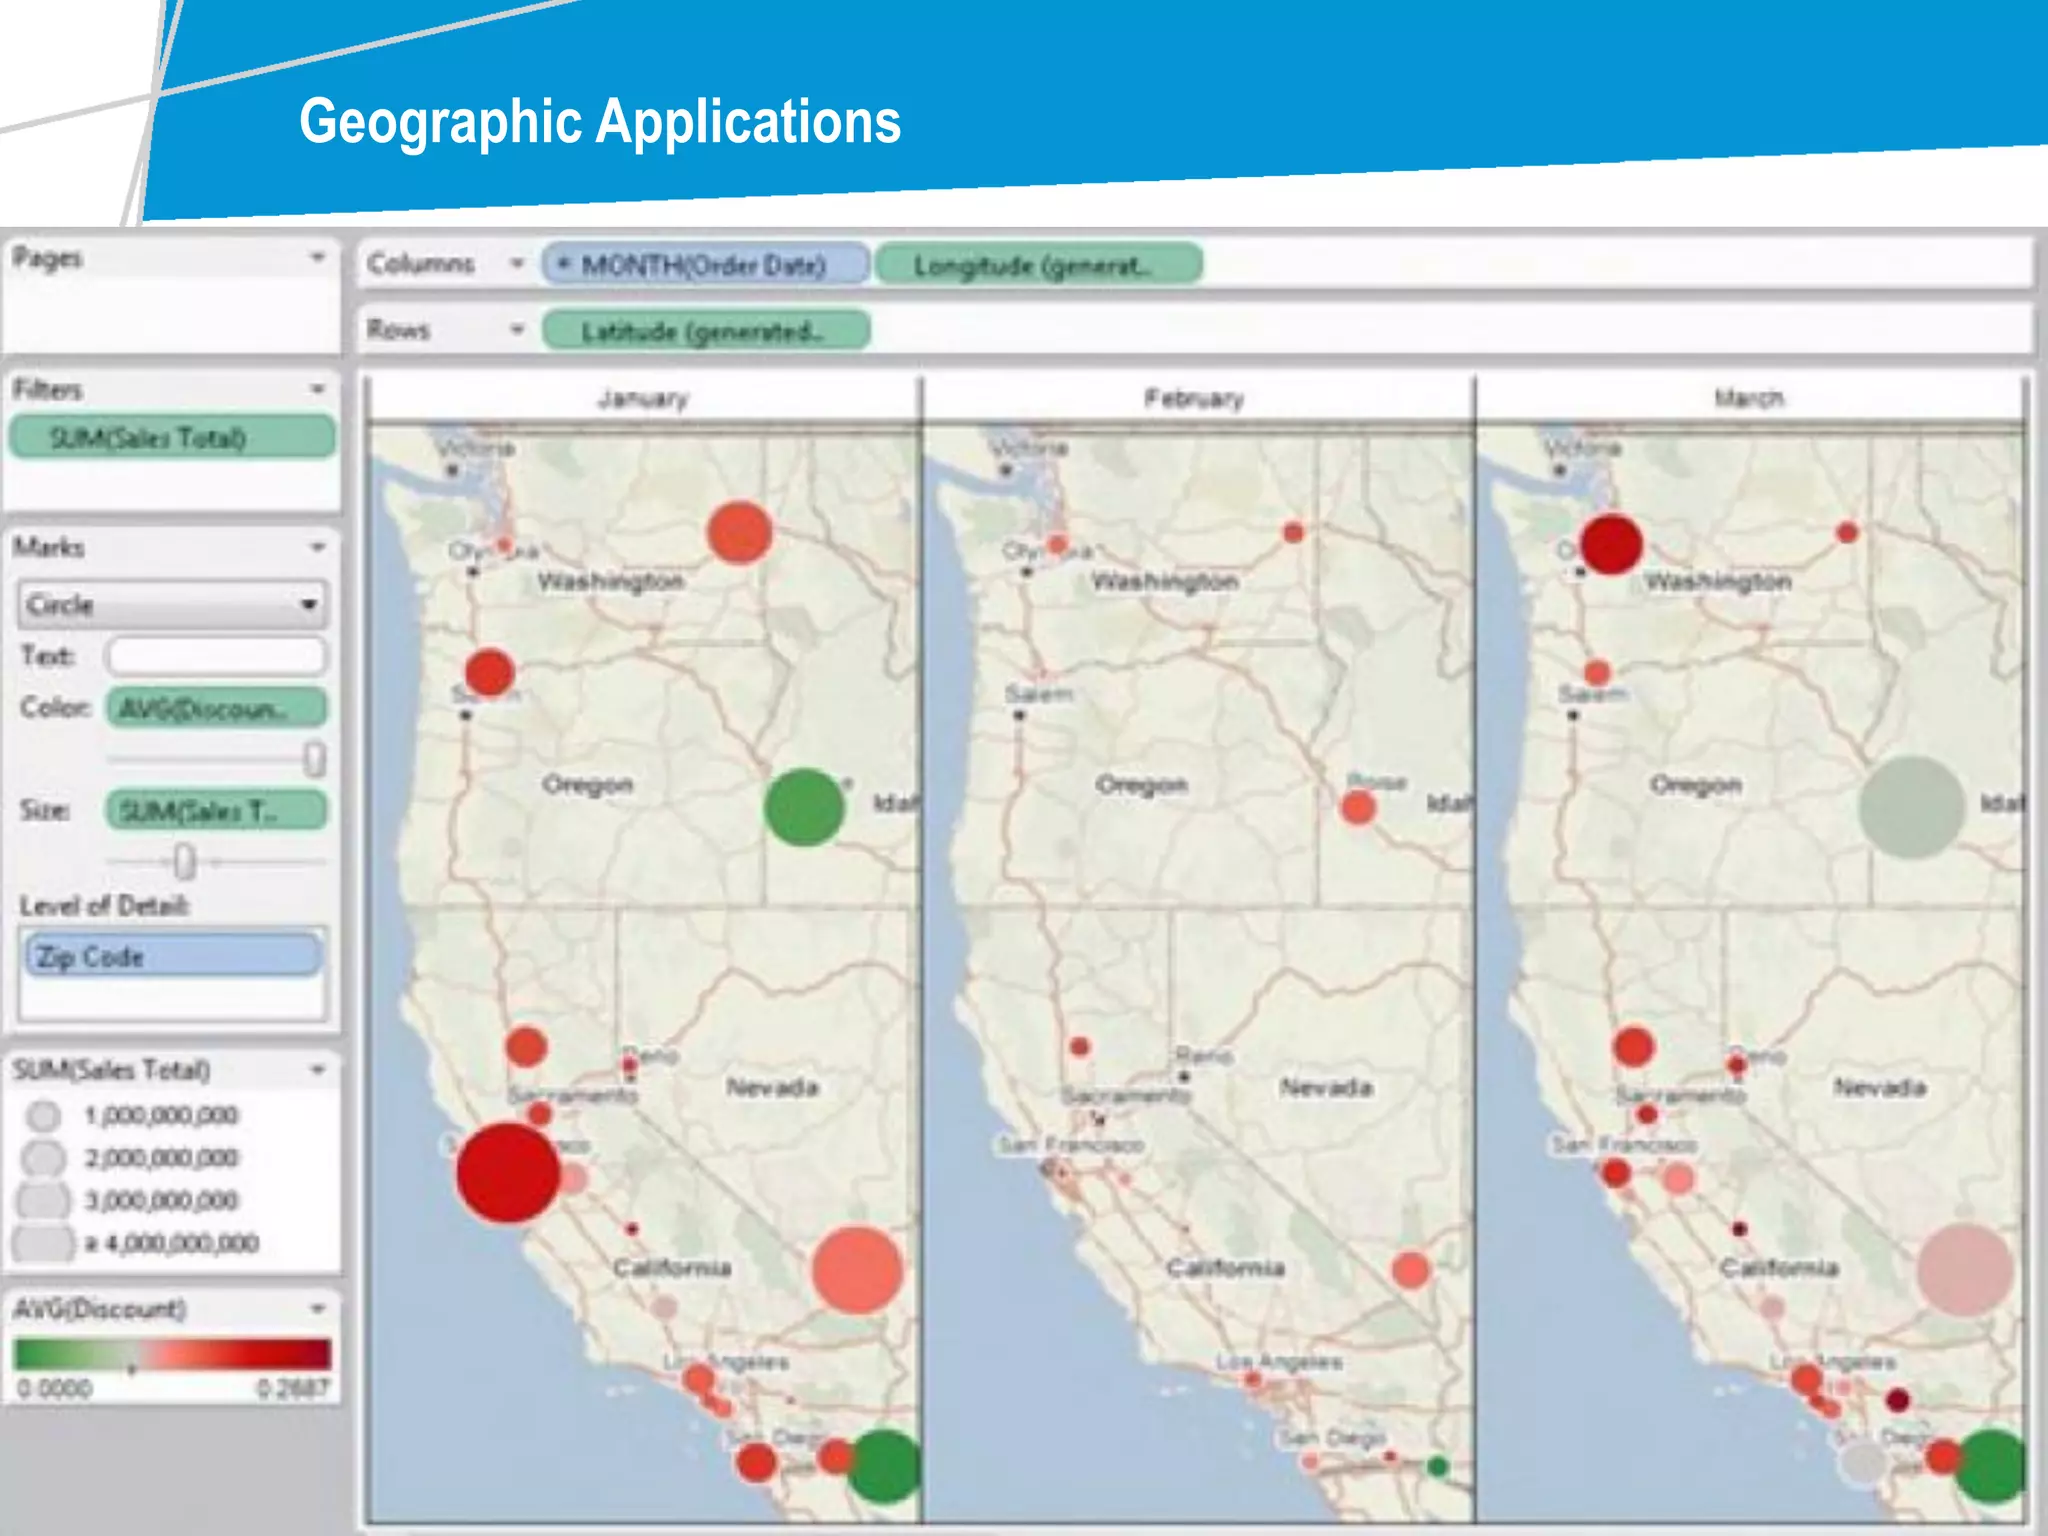
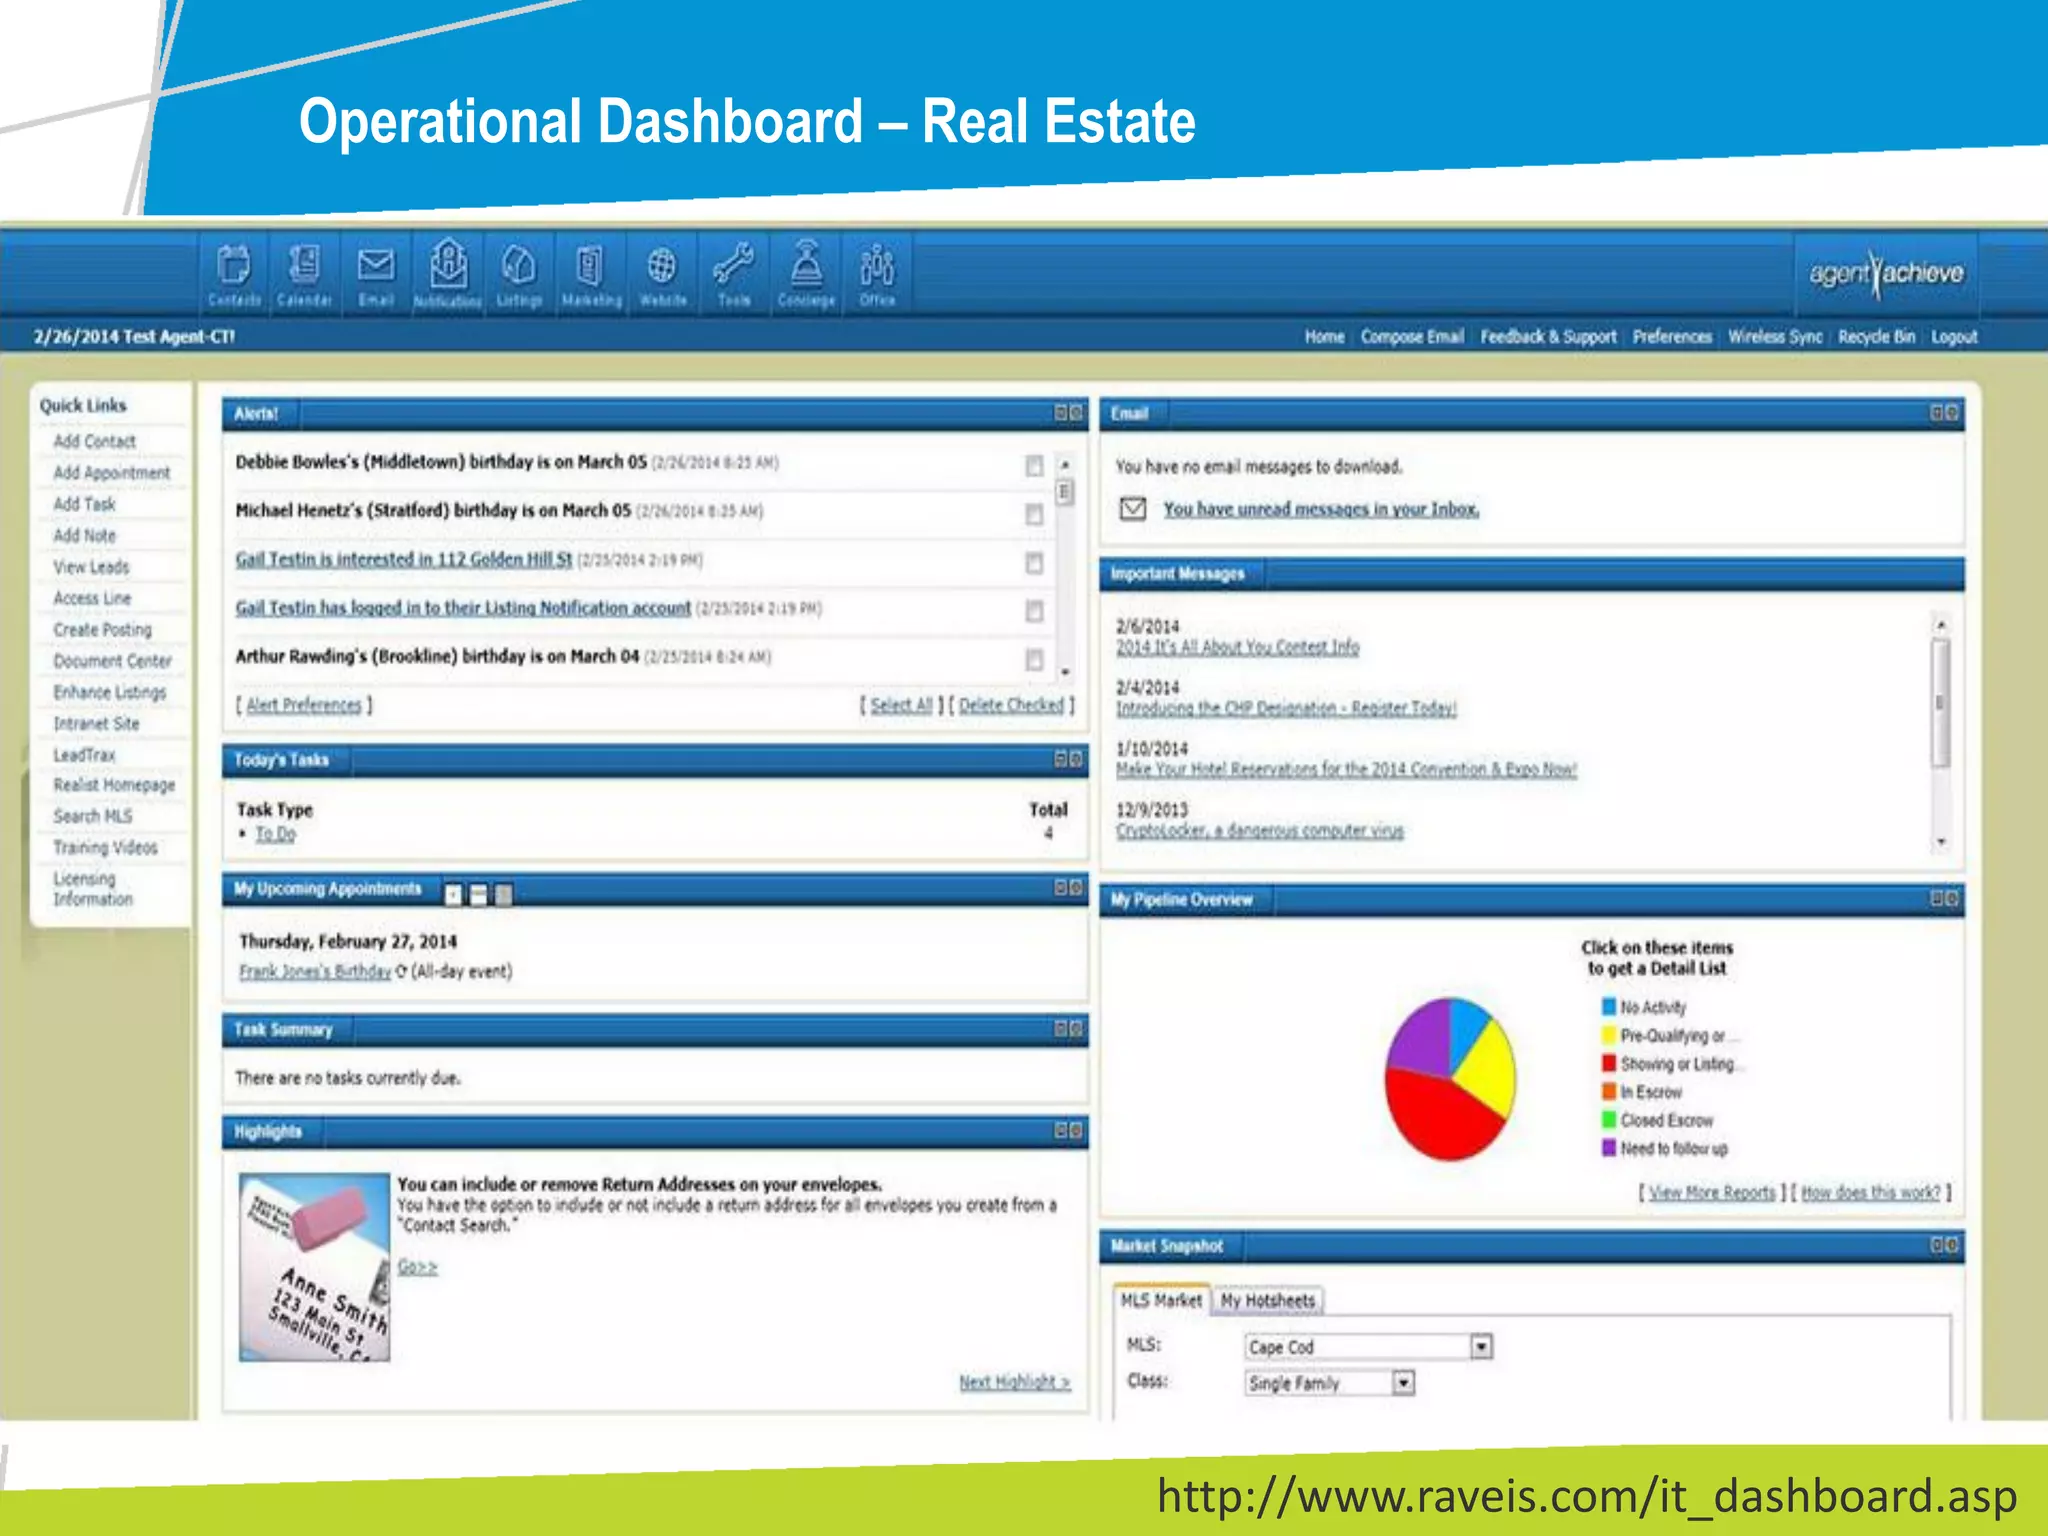
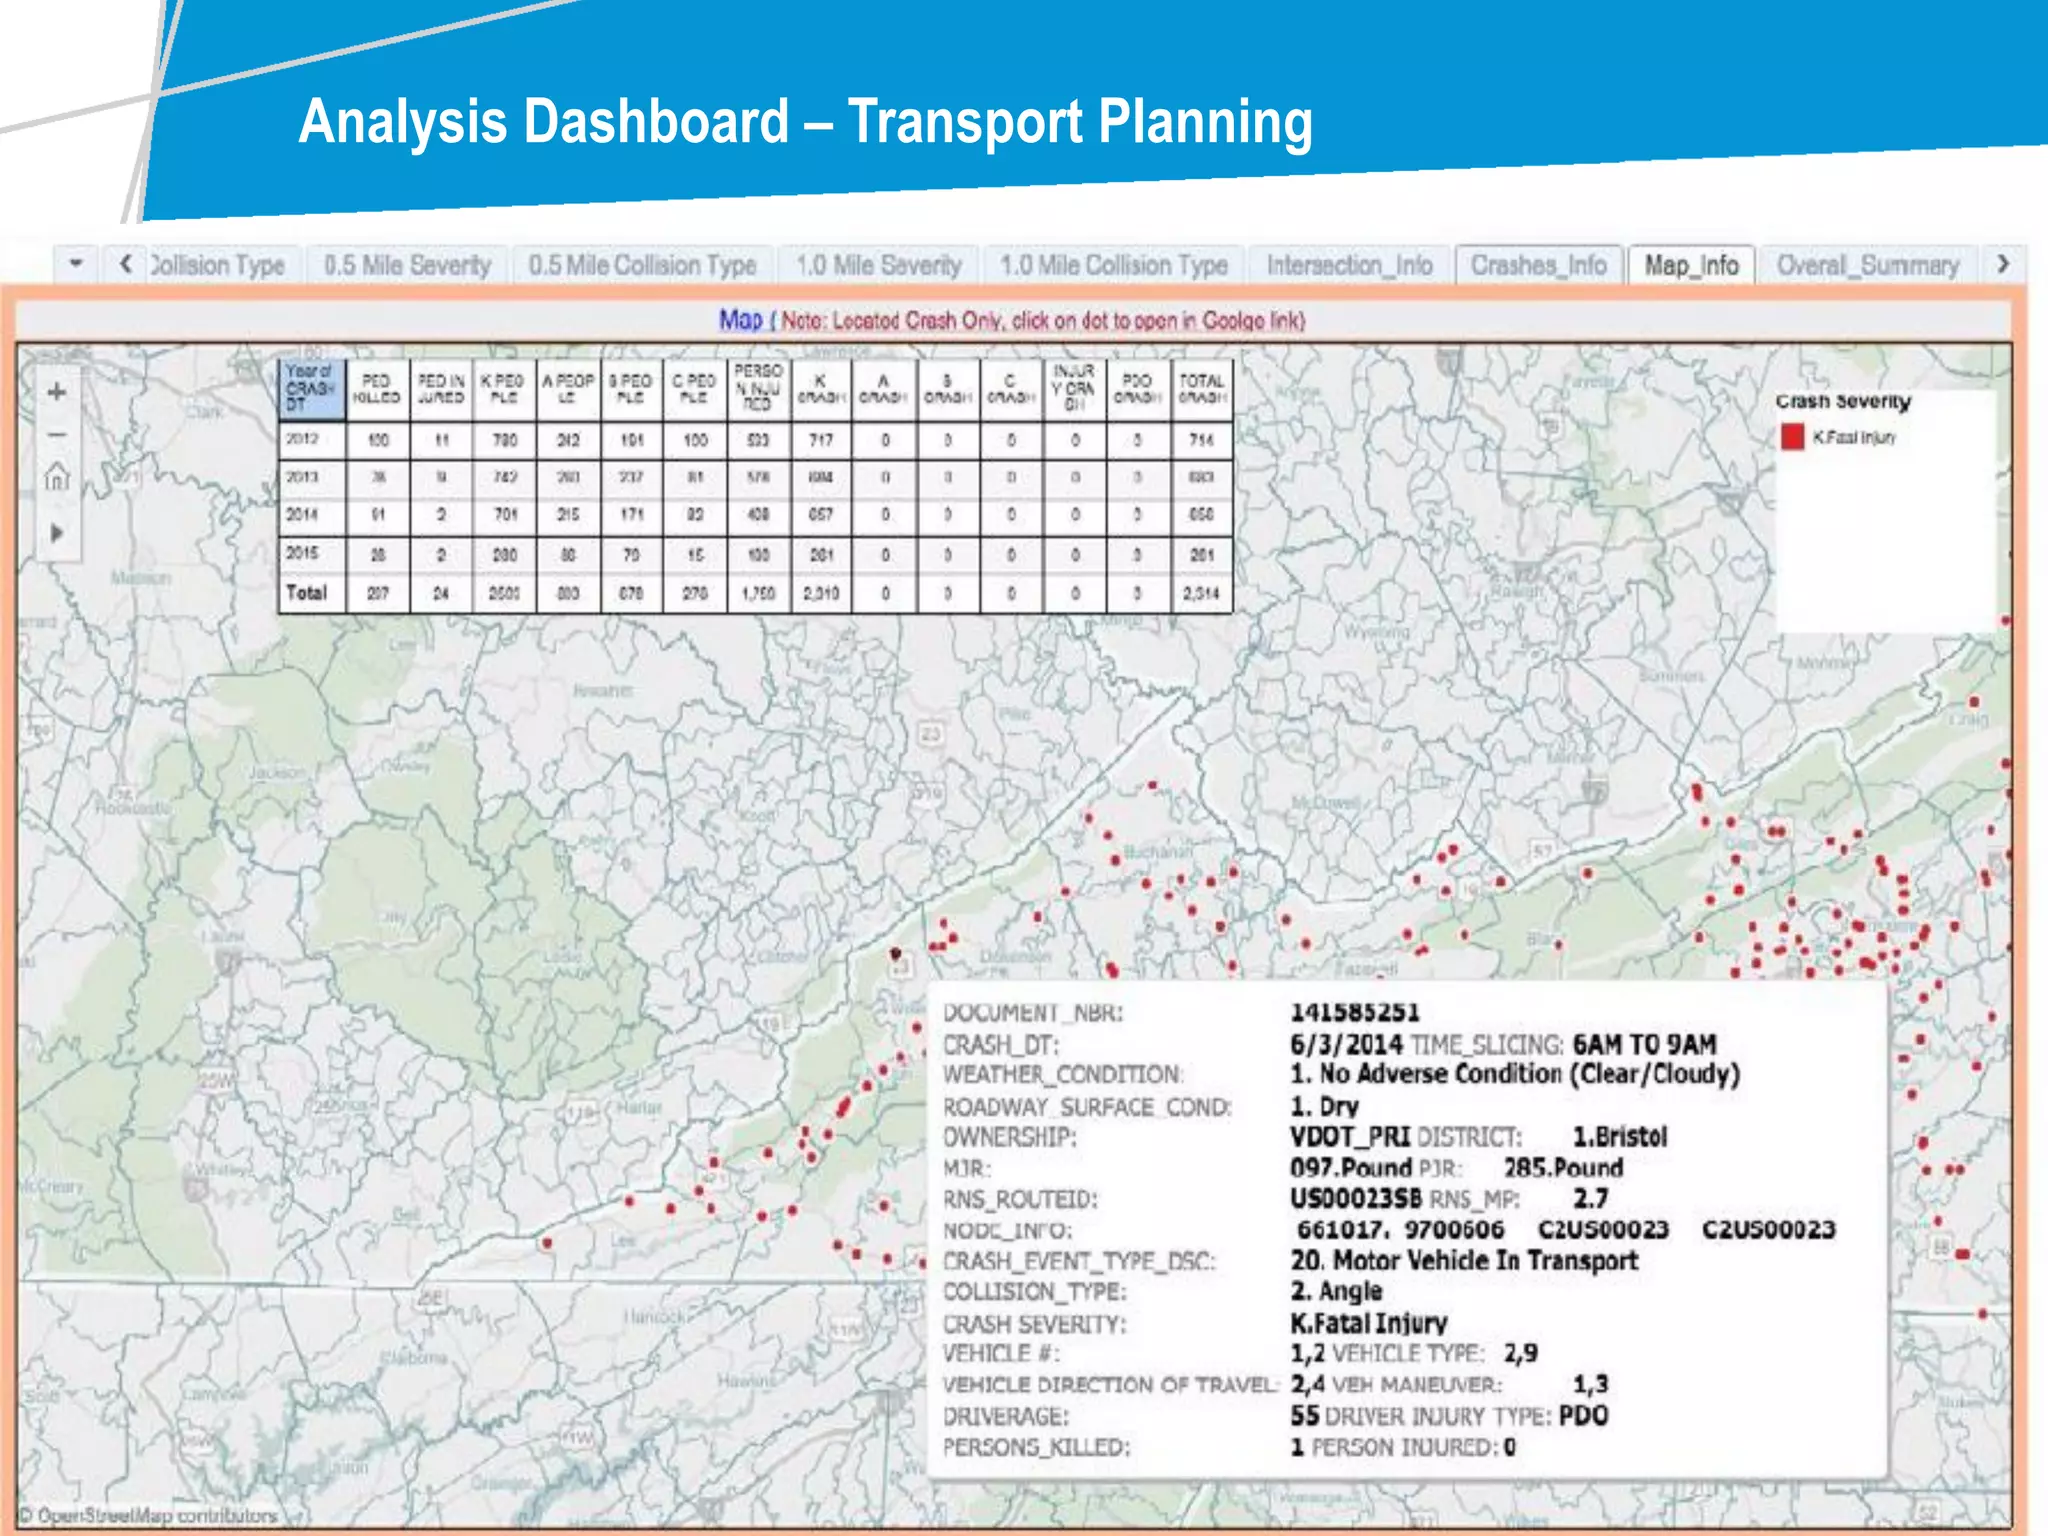

Interactive dashboards allow for more user interaction than simple dashboards through features like navigation, drill-down capabilities, filtering, and different display formats. They are useful for handling large volumes of data and providing insights not obvious before. Effective dashboards are designed based on use cases, group data logically, avoid overload, and consider reporting and decision-making cycles. A case study demonstrated a national project monitoring dashboard that standardized data feeds and had an intuitive interface for different user groups. Choosing the right platform depends on desired features like mobile access, social integration, and traditional or free-form analysis. Dashboards have applications in real estate, transportation, facilities management, and smart cities.


![[DSC Europe 25] Nikolay Burlutskiy - Best Practices for Building Enterprise M...](https://cdn.slidesharecdn.com/ss_thumbnails/uirvaiuvq8y1w8hzd9tx-7-251212103249-2619edb4-thumbnail.jpg?width=640&height=640&fit=bounds)

![[DSC Europe 25] Branko Urosevic -Rethinking Financial Talent: Integrating Cod...](https://cdn.slidesharecdn.com/ss_thumbnails/8jjrus8ttko6qj64f58f-3-251212103250-642c6374-thumbnail.jpg?width=640&height=640&fit=bounds)
![[DSC Europe 25] Hans Kleinsman - The Compliance Gearbox: How Tax Tech Mediate...](https://cdn.slidesharecdn.com/ss_thumbnails/dxdytie1toel0hr90bjs-2-251212103250-174fdbe7-thumbnail.jpg?width=640&height=640&fit=bounds)


![[DSC Europe 25] Dobrica Cosic - From Electrons to Innovation: How Granular Da...](https://cdn.slidesharecdn.com/ss_thumbnails/h4qk69zereaumbceubgr-dobrica-cosic-from-electrons-to-innovation-how-granular-data-and-analytics-are--251218085301-b982fb14-thumbnail.jpg?width=640&height=640&fit=bounds)
![[DSC Europe 25] Uros Pesic - The Reality of AI in Marketing.pdf](https://cdn.slidesharecdn.com/ss_thumbnails/rtkodnmtycovsllvzsyn-9-251215095918-b0c6bfe3-thumbnail.jpg?width=640&height=640&fit=bounds)
![[DSC Europe 25] Velibor Ilic - Autonomous Driving - How AI Shapes Technical ...](https://cdn.slidesharecdn.com/ss_thumbnails/gwu9aqths9ovngsrhidc-3-velibor-ilic-autonomous-driving-how-ai-shapes-technical-challenges-251219150035-7436923a-thumbnail.jpg?width=640&height=640&fit=bounds)

![[DSC Europe 25] Ivan Peric - Intelligence Swarm Logic and Techno-Functional M...](https://cdn.slidesharecdn.com/ss_thumbnails/7my7c97fsduiccadgavw-2-251212103249-5a03f7c6-thumbnail.jpg?width=640&height=640&fit=bounds)

![[DSC Europe 25] Mathias Halkjær Petersen - The AI workforce revolution.pptx](https://cdn.slidesharecdn.com/ss_thumbnails/3xviexv7q5gojhdsyvat-the-ai-workforce-revolution-251218084820-f3c286ed-thumbnail.jpg?width=640&height=640&fit=bounds)


![[DSC Europe 25] Danica Soc - The Science Behind Marketing: Experimentation me...](https://cdn.slidesharecdn.com/ss_thumbnails/c0nofsggs9gw5ucmallr-3-251216103155-56bd64d1-thumbnail.jpg?width=640&height=640&fit=bounds)
