Download to read offline

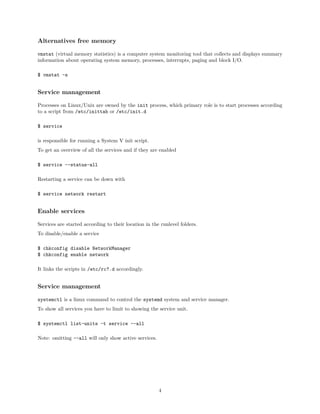
![Service interaction
To look at the details of a specific service
$ systemctl status sshd.service
You can enable and disable with
$ systemctl enable sshd.service
and
$ systemctl disable sshd.service
Service files
The files used by systemd to start a service process are located in /usr/lib/systemd/system.
Below is an example of the neutron-server.service file.
[Unit]
Description=OpenStack Neutron Server
After=syslog.target network.target
[Service]
Type=notify
User=neutron
ExecStart=/usr/bin/neutron-server --config-file /usr/share/neutron/neutron-dist.conf --config-dir /usr/s
PrivateTmp=true
NotifyAccess=all
KillMode=process
[Install]
WantedBy=multi-user.target
Disk commands
• basic commands
• preparation tools
• mapping
• consistency check
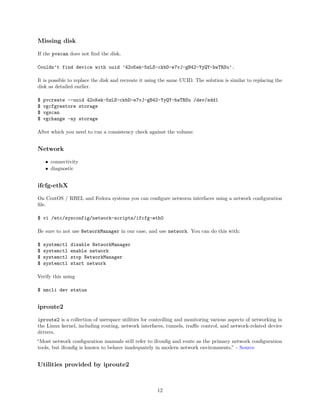
Disk free
df - report file system disk space usage
df (disk free) is a standard Unix command used to display the amount of available disk space for file systems
on which the invoking user has appropriate read access.
$ df -h
makes the output human-readable.
5](https://image.slidesharecdn.com/slides-160428092536/85/Inspection-and-maintenance-tools-Linux-OpenStack-5-320.jpg)
![Disk usage
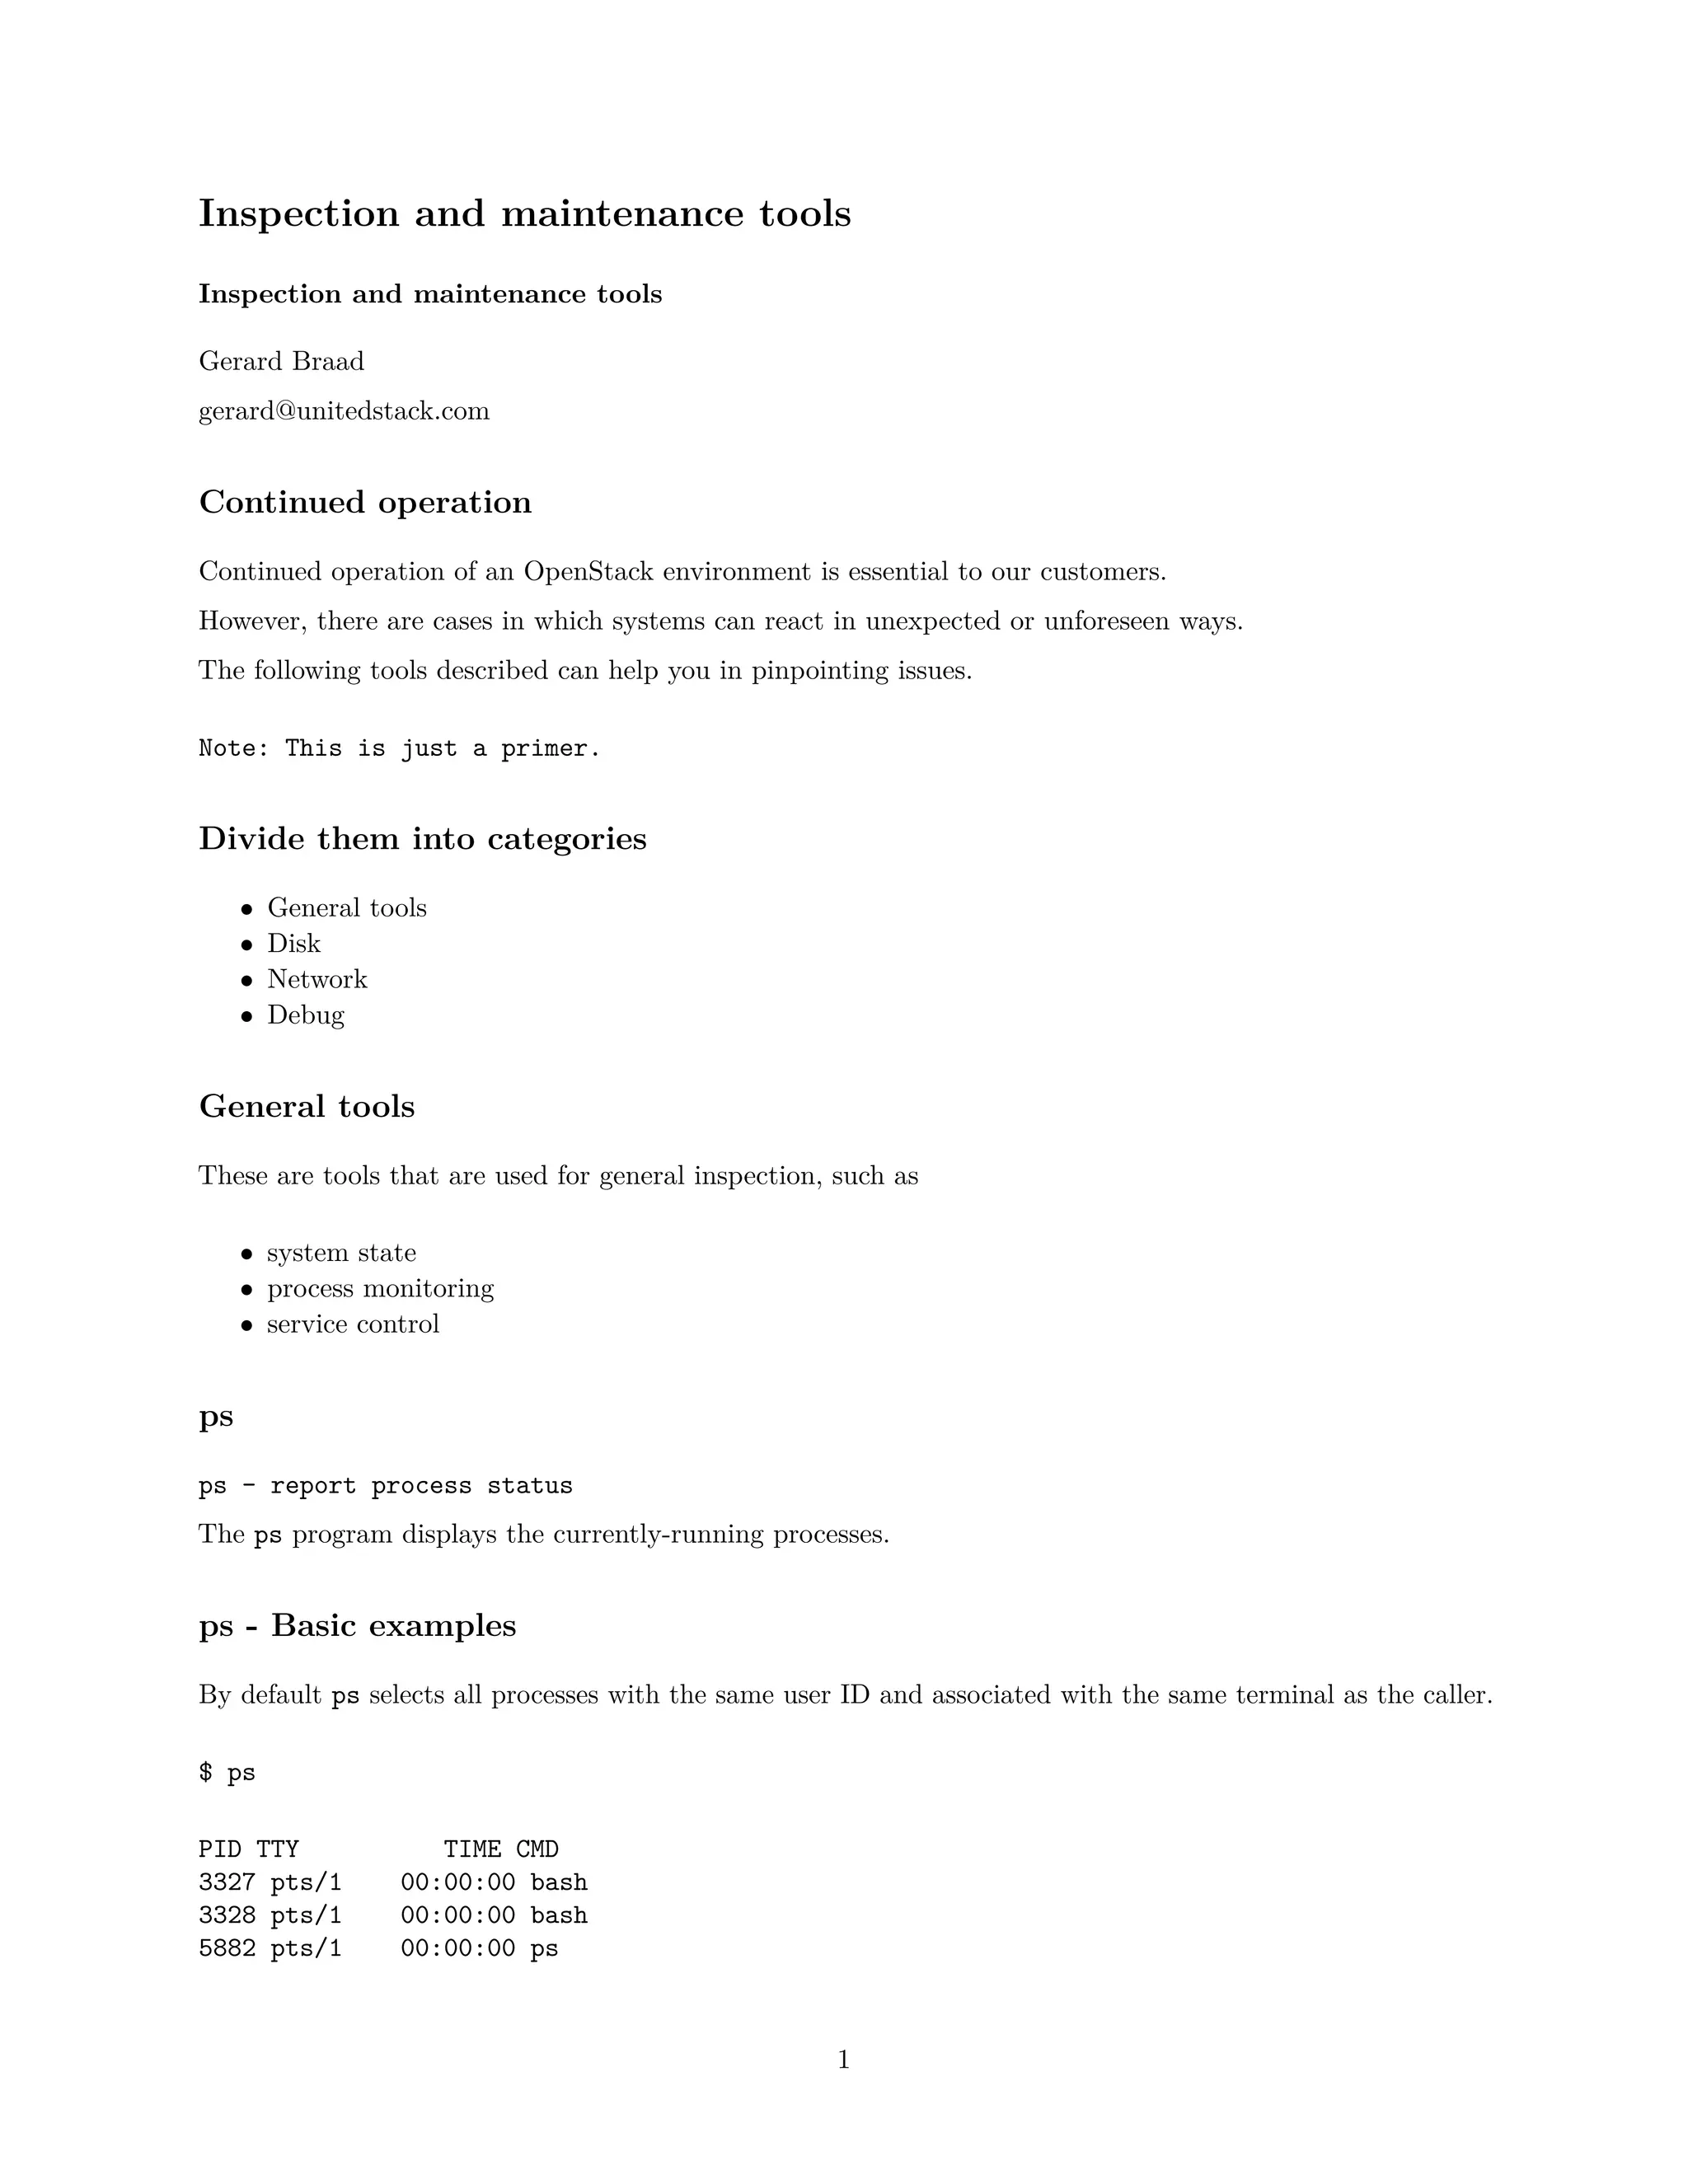
du - estimate file space usage
du (disk usage) is a standard Unix command used to estimate file space usage—space used under a particular
directory or files on a file system.
$ du -h
makes the output human-readable.
Top 10 disk usage
Often just a few files hog your disk, such as log files or a large disk image.
$ du -a /var | sort -n -r | head -n 10
Hunt for hogs with ducks
$ alias ducks=’du -cks * | sort -rn | head’
• -c produces a grand total
• -k same as block-size=1K
• -s summarize, total for each argument
fdisk
Hard disks can be divided into one or more logical disks called partitions. This division is described in the
partition table found in sector 0 of the disk.
fdisk is a command-line utility that provides disk partitioning functions. It doesn’t understand GUID
Partition Table (GPT) and it is not designed for large partitions.
Warning: Don’t delete, modify, or add partitions unless you know what you
are doing. There is a risk of data loss!
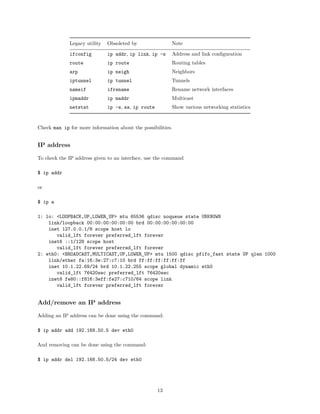
fdisk - Basic usage
With the following command you can list all partitions.
$ fdisk -l
To modify partitions you can use the following command.
$ fdisk [device]
6](https://image.slidesharecdn.com/slides-160428092536/85/Inspection-and-maintenance-tools-Linux-OpenStack-6-320.jpg)

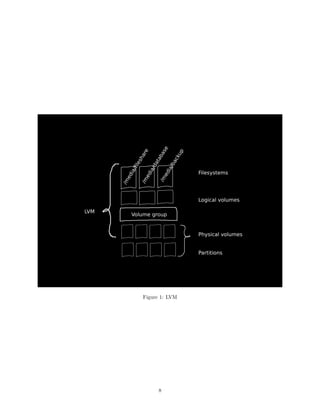
![Partition the disks
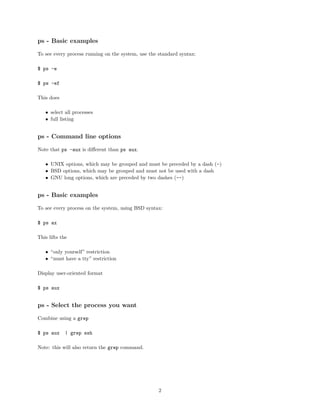
Using fdisk we will create a new primary partition of type ‘8e’. We do this for each disk.
$ fdisk /dev/sdb
$ fdisk /dev/sdc
...
Note: we do not have to create partitions, but this is often what happens.
Create physical volumes
And create the Physical Volumes for the partitions we just created
$ pvcreate /dev/sdb1 /dev/sdc1 /dev/sdd1 /dev/sde1
You can check the creation of the physical volumes using pvdisplay.
Another way to learn about the physical volumes is to issue a pvscan.
Note: pvremove /dev/sdb1 will perform the opposite action.
Create Volume Group
After this is done, we will create the Volume Group
$ vgcreate storage /dev/sd[b-e]1
You can check the creation of the volume group using vgdisplay.
Another way to learn about the volume groups is to issue a vgscan.
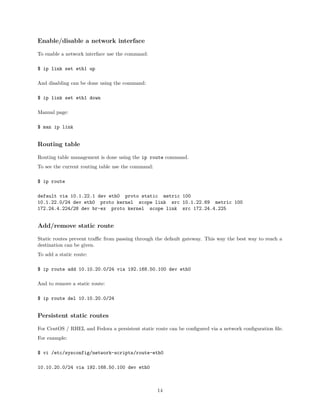
Create Logical Volumes
Now we can create the actual logical volumes that represent the actual storage locations.
$ lvcreate -n fileshare -L +450G storage
$ lvcreate -n database -L +50G storage
$ lvcreate -n backup -L +500G storage
You can check the creation of the logical volumes using lvdisplay.
Another way to learn about the logical volumes is to issue a lvscan.
You will see devices mappings such as /dev/storage/fileshare, etc.
Modify Logical Volumes
Logical volumes can be modified using the following commands
• lvremove
• lvreduce
• lvextend
9](https://image.slidesharecdn.com/slides-160428092536/85/Inspection-and-maintenance-tools-Linux-OpenStack-9-320.jpg)
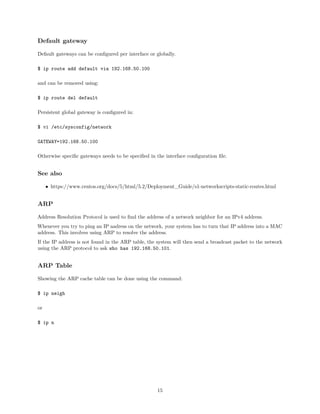
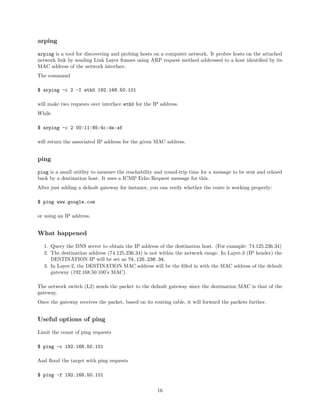
![Useful options of ping
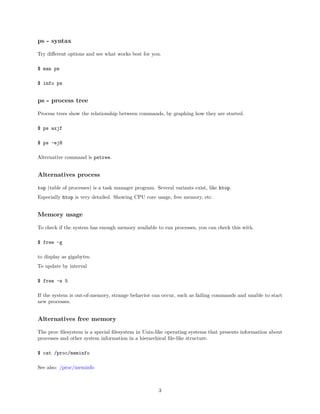
Using -i [number] you can change the interval before sending the next packet.
$ ping -i 10 linux.com
Using -q the command will only print summary statistics:
$ ping -c 4 -q linux.com
The default packetsize is 56, using the -s option you can change the size of the ping packet.
$ ping -s 200 google.com
Pressing CTRL+| will print the statistics summary will the ping is still running.
Route of ping
Using -R you will see the route that is taken for a packet. Many hosts ignore or discard this option.
$ ping -R google.com
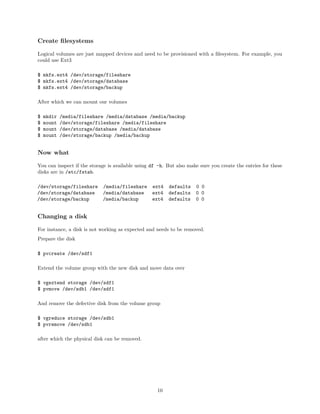
traceroute (tracepath)
traceroute is a network diagnostic tool for displaying the route and measuring transit delays of packets on
an IP network. This can help identify incorrect routing table definitions.
An alternative tool is tracepath. tracepath uses the sockets API, while traceroute manipulates raw
packages for some of its functionality. Because of this, traceroute needs root privileges.
Note: ping only computes the final round-trip times for the destination.
Example use
$ traceroute google.com
traceroute to google.com (216.58.197.206), 30 hops max, 60 byte packets
1 106.187.33.2 (106.187.33.2) 2.604 ms 2.601 ms 2.563 ms
[...]
7 72.14.233.221 (72.14.233.221) 1.969 ms 1.927 ms 1.656 ms
8 nrt13s48-in-f14.1e100.net (216.58.197.206) 2.177 ms 1.787 ms 1.677 ms
The first column shows the TTL of the probe.
17](https://image.slidesharecdn.com/slides-160428092536/85/Inspection-and-maintenance-tools-Linux-OpenStack-17-320.jpg)
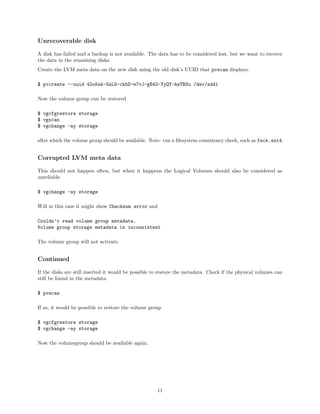
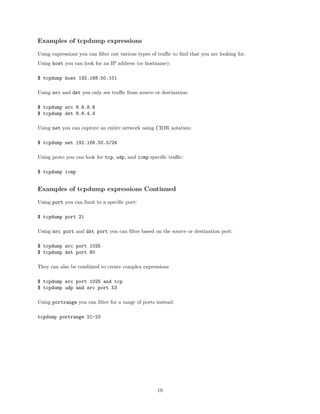
![tcpdump
tcpdump is a common command line packet analyzer. It allows the user to display TCP/IP and other packets
being transmitted or received.
To install
$ yum install -y tcpdump
And run:
$ tcpdump
You will have to terminate with ˆC when you have received enough packets.
Examples of tcpdump
Use the -i parameter to listen on all interfaces
$ tcpdump -i any
or
$ tcpdump -i eth0
to listen on eth0 only.
Examples of tcpdump
In some case you would not want to see resolved hostnames. You can prevent this with -n. Using -nn will
also prevent from resolving port names.
$ tcpdump -nS
Using -S will print absolute sequence numbers.
Examples of tcpdump
To see the content of the packets you can use
$ tcpdump -nnvvXSs 0
And to see specifically ICMP packets, do:
$ tcpdump -nnvvXSs 0 icmp
15:12:21.498049 IP (tos 0x0, ttl 64, id 56897, offset 0, flags [none], proto ICMP (1), length 84)
10.1.22.69 > 104.154.53.169: ICMP echo reply, id 11105, seq 13, length 64
0x0000: 4500 0054 de41 0000 4001 ddde 0a01 1645 E..T.A..@......E
0x0010: 689a 35a9 0000 e191 2b61 000d 5566 2057 h.5.....+a..Uf.W
0x0020: 0000 0000 b66f 0800 0000 0000 1011 1213 .....o..........
0x0030: 1415 1617 1819 1a1b 1c1d 1e1f 2021 2223 .............!"#
0x0040: 2425 2627 2829 2a2b 2c2d 2e2f 3031 3233 $%&’()*+,-./0123
0x0050: 3435 3637 4567
18](https://image.slidesharecdn.com/slides-160428092536/85/Inspection-and-maintenance-tools-Linux-OpenStack-18-320.jpg)

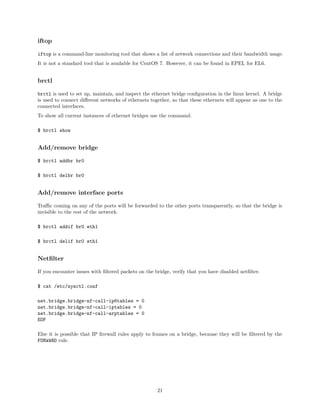

![Network connections using lsof
Using the -i option we can list opened network connections.
$ lsof -i
Including :<n> will show command that have opened a specific port:
$ lsof -i :22
Note: this is very similar to using netstat -nap
And udp or tcp will show connections based on the protocol:
$ lsof -i tcp
$ lsof -i udp
strace
strace - trace system calls and signals
strace is a diagnostic and debugging utility for Linux. It is used to monitor interactions between processes
and the Linux kernel.
This is very helpful when you do not have the source code of the program that has a problem.
Examples strace
The simplest invocation is to use:
$ strace ls
execve("/bin/ls", ["ls"], [/* 72 vars */]) = 0
brk(0) = 0xcb6000
access("/etc/ld.so.nohwcap", F_OK) = -1 ENOENT (No such file or directory)
[...]
write(1, "lib workspacen", 15lib workspace
) = 30
close(1) = 0
munmap(0x7f64c2eab000, 4096) = 0
close(2) = 0
exit_group(0) = ?
+++ exited with 0 +++
which will show all the system calls used by the ls command.
23](https://image.slidesharecdn.com/slides-160428092536/85/Inspection-and-maintenance-tools-Linux-OpenStack-23-320.jpg)
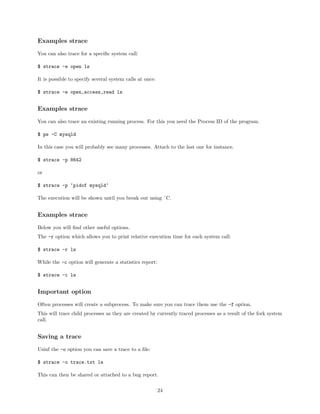
![Combining strace and lsof
Using strace and lsof it is possible to debug process hangs.
There are several ways a proces can be blocked, for instance:
• it is blocked waiting for a resource that isn’t available
• or is in an infinite loop
file-descriptors
When you strace a running application, you might see
select(1, [0], NULL, [0], NULL
Which is a system call
select() and pselect() allow a program to monitor multiple file descriptors,
waiting until one or more of the file descriptors become "ready"
If you want to know what this file is, run:
$ lsof -p <PID> -ad 1
Debugging
Debugging is a the process of finding and resolving defects that prevent correct operation of a computer
process.
Many different techniques exist and deserve a presentation in itself.
• synchronous
• asynchronous (concurrency)
pdb
pdb is an interactive source code debugger for Python programs, offered as a module.
• breakpoints
• single stepping
• inspection of stack frames
• source code listing
• evaluation of code
Run pdb
To run the python debugger you can call it on your scriptfile
$ pdb [scriptfile]
or
$ python -m pdb [scriptfile]
25](https://image.slidesharecdn.com/slides-160428092536/85/Inspection-and-maintenance-tools-Linux-OpenStack-25-320.jpg)
![Commands
Below are several pdb commands to deal with the inspection and execution of the scriptfile.
Command Shorthand Description
break b Set a breakpoint.
continue c Continue with program execution.
exit q Abort the program.
help h Print list of commands or help for a given command.
list l Show source code around current line.
return r Continue execution until the current function returns.
step s Continue and break on next instruction.
next n Similar to step, but does not enter function call)
p Evaluate expression and print the result
Note: print will be evaluated by the interpreter. pp is pretty print.
Breakpoints
There are different ways to specify a breakpoint
• break [scriptfile]:[linenumber]
• break [module].[functionname]
• break [location], [condition]
You can enable and disable beakpoints using their identifier. ignore will ignore the breakpoint at the next
crossing, while clear will remove a breakpoint entirely.
More advanced options
You can also use commands to execute commands at the breakpoint and jump to change the execution flow.
For more information: pdb
Add pdb
A good way to start the debugger is to start the debugging session from the script itself. For this you need to
add a call to set_trace().
Anywhere in your code you could do:
import pdb; pdb.set_trace()
and start the execution of the script from a terminal. You might have to check the service file to see which
command is started.
26](https://image.slidesharecdn.com/slides-160428092536/85/Inspection-and-maintenance-tools-Linux-OpenStack-26-320.jpg)
![gdb
GNU Debugger. The standard debugger for the GNU operating system.
• help
• run
• step
• break [file]:[linenumber], [function]
• continue
• next (will not enter function call)
• print
• watch
• backtrace
• . . .
Attach to running process
$ gdb attach <PID>
Kernel debugging can be done using the ‘crash‘ tool.
Note
If one thread stops for a breakpoint, or for some other reason, and another thread is blocked in a system call,
then the system call may return prematurely.
Another useful tool
ss - another utility to investigate sockets
It dump socket statistics. It allows showing information similar to netstat.
• -l show listening sockets
• -p show process using socket
• -e show exteneded information
27](https://image.slidesharecdn.com/slides-160428092536/85/Inspection-and-maintenance-tools-Linux-OpenStack-27-320.jpg)

The document outlines essential inspection and maintenance tools for managing an OpenStack environment, categorized into general tools, disk commands, and network diagnostics. It provides detailed usage instructions for various commands like 'ps', 'df', 'lvm', and 'iproute2' to monitor system performance, manage disk partitions, and configure network interfaces. Additionally, it discusses common operational scenarios such as service management, disk failures, and network troubleshooting.