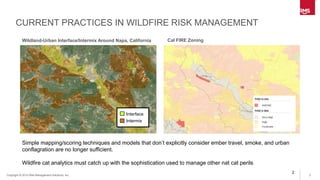
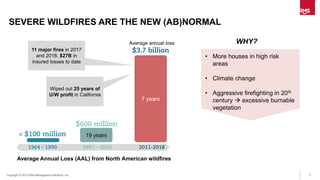
1Copyright © 2015 Risk Management Solutions, Inc.
CALIFORNIA WILDFIRE RISK MODELLING
Robert Muir-Wood
OECD Paris
Jan 16th 2020
2Copyright © 2015 Risk Management Solutions, Inc..
CURRENT PRACTICES IN WILDFIRE RISK MANAGEMENT
Wildland-Urban Interface/Intermix Around Napa, California
Interface
Intermix
Cal FIRE Zoning
Simple mapping/scoring techniques and models that don’t explicitly consider ember travel, smoke, and urban
conflagration are no longer sufficient.
Wildfire cat analytics must catch up with the sophistication used to manage other nat cat perils.
2
3Copyright © 2015 Risk Management Solutions, Inc..
SEVERE WILDFIRES ARE THE NEW (AB)NORMAL
19 years
7 years
Average annual loss
Average Annual Loss (AAL) from North American wildfires
• More houses in high risk
areas
• Climate change
• Aggressive firefighting in 20th
century  excessive burnable
vegetation
11 major fires in 2017
and 2018. $27B in
insured losses to date
WHY?
Wiped out 25 years of
U/W profit in California
4Copyright © 2015 Risk Management Solutions, Inc..
RMS North America Wildfire model –
Most comprehensive view of wildfire risk
Key Features
• Probabilistic Wildfire simulations:
50,000 years
• Coverage: United States
• Realistic fire, smoke, and ember
footprints at 50 m resolution
• Underwriting Data:
• Wildfire Hazard Data products
(Distance to Vegetation / Fuel Type)
• Risk Score Data products
Key differentiators
• Explicit ember and smoke
simulations to detail impacts beyond
the historical fire perimeters
• Urban Conflagration model captures
extreme tail risk events (like 2017
Wine Country)
• Robust set of Secondary Modifiers to
capture building / community
Mitigation and Fire Suppression
5Copyright © 2015 Risk Management Solutions, Inc..
WILDFIRE HAZARD MODELING FRAMEWORK
Landscape
& Fire
Behavior
Parameters
Fire
Weather
Simulati
ons
Fire
Ignitions
Fire
Spread
Ember
Intensity
Urban
Conflagr
ation
Smoke
Spread
6Copyright © 2015 Risk Management Solutions, Inc..
CONTRIBUTIONS FROM EMBERS
 Without the presence of a flaming fire front,
embers still attack and ignite structures.
 No radiant heat component
http://www.yakimaherald.com/photos_and_videos/news_photos/aerial-views-show-the-damage-caused-by-wenatchee-fire/
collection_8c7e082e-1eb4-11e5-b423-af0885fd85cb.html
Ember attack beyond flaming front
https://s3-us-west-2.amazonaws.com/assets.www.wenatcheeworld.com/
media/img/photo/2015/06/29/a031652068-fire-spreads.jpg.960x720_q80.jpg
Copyright © 2015 Risk Management Solutions, Inc.
Initiation of urban
conflagration
Urban Conflagration
Modeled
conflagration extent
7
Function of:
• Population/Structure
Density
• Extreme Weather
• Fuels
• Suppression
assumptions
8Copyright © 2015 Risk Management Solutions, Inc..
OCTOBER 2017 TUBBS FIRE: WILDFIRE TRANSITIONS INTO
URBAN CONFLAGRATION IN COFFEY PARK, SANTA ROSA
High land values mean buildings cover almost the whole plot,
reducing building separation and raising the conflagration risk.
9Copyright © 2015 Risk Management Solutions, Inc..
FIRE-FOLLOWING WINDSTORM LOGIC TREE
High wind
Breeze
Calm
IgnitionsWeather Spread
Multiple
Rapid
Suppression
Out of control
Under control
Slow
Single0.05
0.05
0.9
Single
Slow
Under control
Impact
10Copyright © 2015 Risk Management Solutions, Inc..Copyright © 2015 Risk Management Solutions, Inc..
Cumulative Smoke Footprints
SMOKE
MODELING
• Additional 20% of
Wildfire losses can
be from smoke &
evacuation
• Numerous low
severity claims for
clean-up due to
health concerns
• Can turn Smoke
on/off in model
Highly Damageable Smoke
Moderate Damageable Smoke
2003 Cedar Fire
11Copyright © 2015 Risk Management Solutions, Inc..
WILDFIRE RISK SCORE & LOSS COST (1Q 2020)
Key Features:
• Heat, Ember, Smoke damage included
• High resolution wildfire underwriting product.
API Inputs:
Address or Coordinates
Construction
Occupancy
Distance to Vegetation
TIV*
Deductible*
Loss Cost:
1) AAL for Building (Ground up + Gross)
2) AAL for Contents (Ground up + Gross)
3) AAL for BI/ALE (Ground up + Gross)
12Copyright © 2015 Risk Management Solutions, Inc..
WILDFIRE VULNERABILITY FRAMEWORK
Site Hazard Data *
Slope
Distance to
Vegetation
Fuel Type
Primary Modifiers
Occupancy
Construction
Number of Stories
Year Built
Floor Areas
Secondary Modifiers
Roof Characteristics
Ember Accumulators
Cladding/Deck
Infrastructure
Accessibility
Conditions
* Users can override model defaults
13Copyright © 2015 Risk Management Solutions, Inc..
NUMBER V AREA OF CALIFORNIA FIRES
Source: Short, Karen C. 2017. Spatial wildfire occurrence data for the
United States, 1992-2015, USDA Forest Service, Missoula Fire
Science Laboratory
-
2,000
4,000
6,000
8,000
10,000
12,000
0
50
100
150
200
250
1991 1993 1995 1997 1999 2001 2003 2005 2007 2009 2011 2013 2015
Averageburnedareaperfire(acre)
Annulanumberoffires
California number of fires > 300 ac)
Number of fires
Average Annual Acres Burned (1992-2015)
Average Acres burned Per Fire
Linear (Number of fires)
Linear (Average Acres burned Per Fire)
14Copyright © 2015 Risk Management Solutions, Inc..
0.95
(0.71)
(1.08)
(0.89)
1.84
(0.05)
1.911.93
1.48
(2.50)
(2.00)
(1.50)
(1.00)
(0.50)
-
0.50
1.00
1.50
2.00
2.50
(3.00) (2.00) (1.00) - 1.00 2.00 3.00
May-Septemperatureanomalies(degreeF)
May-Oct precipitation anomalies (in)
California Wet, HotDry, Hot
Dry, Cold Wet, Cold
YEARS WITH LOSS > $1B (MAY-OCT) (ANOMALIES VS 1980-2018)
1991,1993,1999, 2003, 2007, 2008, 2013, 2017, 2018
1991
2007
19931999
2003
2015
2017
2018
2008
15Copyright © 2015 Risk Management Solutions, Inc..
NATURE CLIMATE CHANGE | VOL 8 |
MAY 2018 | 427–433
16Copyright © 2015 Risk Management Solutions, Inc..
CLIMATE CHANGE AND WILDFIRE – THE ACCELERANTS
Winter rainfall
vegetation
Hot Summer
temperatures
Reduced
Autumn rainfall
Outbreaks of
hot easterly
winds
Legacy of past
droughts in
dead trees
Fuel Load
Extended fire
season
Fire starts and
spread
Fuel
Conditioning
Published Climate Change signature
17Copyright © 2015 Risk Management Solutions, Inc..
Building code
Vegetation clearance
Neighbouring properties?
Utility equipment hardening?
Wind forecast power cuts?
Exploring mitigation options using the risk model
18Copyright © 2015 Risk Management Solutions, Inc..
Built to 2008 Code
Fire resistant roofs, sidings and
other clearances
In 2018 Camp Fire 51% houses built since
2008 undamaged but only 18% pre-2008
Unless zoned ‘fire prone’ code is not
mandated (eg Coffey Park rebuilds).
19Copyright © 2015 Risk Management Solutions, Inc..
‘It’s not the fires advancing towards the exposure
but the exposure expanding into the fires’

Wildfire-Workshop-Presentation-Robert-Muir-Wood

  • 1.
    1Copyright © 2015Risk Management Solutions, Inc. CALIFORNIA WILDFIRE RISK MODELLING Robert Muir-Wood OECD Paris Jan 16th 2020
  • 2.
    2Copyright © 2015Risk Management Solutions, Inc.. CURRENT PRACTICES IN WILDFIRE RISK MANAGEMENT Wildland-Urban Interface/Intermix Around Napa, California Interface Intermix Cal FIRE Zoning Simple mapping/scoring techniques and models that don’t explicitly consider ember travel, smoke, and urban conflagration are no longer sufficient. Wildfire cat analytics must catch up with the sophistication used to manage other nat cat perils. 2
  • 3.
    3Copyright © 2015Risk Management Solutions, Inc.. SEVERE WILDFIRES ARE THE NEW (AB)NORMAL 19 years 7 years Average annual loss Average Annual Loss (AAL) from North American wildfires • More houses in high risk areas • Climate change • Aggressive firefighting in 20th century  excessive burnable vegetation 11 major fires in 2017 and 2018. $27B in insured losses to date WHY? Wiped out 25 years of U/W profit in California
  • 4.
    4Copyright © 2015Risk Management Solutions, Inc.. RMS North America Wildfire model – Most comprehensive view of wildfire risk Key Features • Probabilistic Wildfire simulations: 50,000 years • Coverage: United States • Realistic fire, smoke, and ember footprints at 50 m resolution • Underwriting Data: • Wildfire Hazard Data products (Distance to Vegetation / Fuel Type) • Risk Score Data products Key differentiators • Explicit ember and smoke simulations to detail impacts beyond the historical fire perimeters • Urban Conflagration model captures extreme tail risk events (like 2017 Wine Country) • Robust set of Secondary Modifiers to capture building / community Mitigation and Fire Suppression
  • 5.
    5Copyright © 2015Risk Management Solutions, Inc.. WILDFIRE HAZARD MODELING FRAMEWORK Landscape & Fire Behavior Parameters Fire Weather Simulati ons Fire Ignitions Fire Spread Ember Intensity Urban Conflagr ation Smoke Spread
  • 6.
    6Copyright © 2015Risk Management Solutions, Inc.. CONTRIBUTIONS FROM EMBERS  Without the presence of a flaming fire front, embers still attack and ignite structures.  No radiant heat component http://www.yakimaherald.com/photos_and_videos/news_photos/aerial-views-show-the-damage-caused-by-wenatchee-fire/ collection_8c7e082e-1eb4-11e5-b423-af0885fd85cb.html Ember attack beyond flaming front https://s3-us-west-2.amazonaws.com/assets.www.wenatcheeworld.com/ media/img/photo/2015/06/29/a031652068-fire-spreads.jpg.960x720_q80.jpg
  • 7.
    Copyright © 2015Risk Management Solutions, Inc. Initiation of urban conflagration Urban Conflagration Modeled conflagration extent 7 Function of: • Population/Structure Density • Extreme Weather • Fuels • Suppression assumptions
  • 8.
    8Copyright © 2015Risk Management Solutions, Inc.. OCTOBER 2017 TUBBS FIRE: WILDFIRE TRANSITIONS INTO URBAN CONFLAGRATION IN COFFEY PARK, SANTA ROSA High land values mean buildings cover almost the whole plot, reducing building separation and raising the conflagration risk.
  • 9.
    9Copyright © 2015Risk Management Solutions, Inc.. FIRE-FOLLOWING WINDSTORM LOGIC TREE High wind Breeze Calm IgnitionsWeather Spread Multiple Rapid Suppression Out of control Under control Slow Single0.05 0.05 0.9 Single Slow Under control Impact
  • 10.
    10Copyright © 2015Risk Management Solutions, Inc..Copyright © 2015 Risk Management Solutions, Inc.. Cumulative Smoke Footprints SMOKE MODELING • Additional 20% of Wildfire losses can be from smoke & evacuation • Numerous low severity claims for clean-up due to health concerns • Can turn Smoke on/off in model Highly Damageable Smoke Moderate Damageable Smoke 2003 Cedar Fire
  • 11.
    11Copyright © 2015Risk Management Solutions, Inc.. WILDFIRE RISK SCORE & LOSS COST (1Q 2020) Key Features: • Heat, Ember, Smoke damage included • High resolution wildfire underwriting product. API Inputs: Address or Coordinates Construction Occupancy Distance to Vegetation TIV* Deductible* Loss Cost: 1) AAL for Building (Ground up + Gross) 2) AAL for Contents (Ground up + Gross) 3) AAL for BI/ALE (Ground up + Gross)
  • 12.
    12Copyright © 2015Risk Management Solutions, Inc.. WILDFIRE VULNERABILITY FRAMEWORK Site Hazard Data * Slope Distance to Vegetation Fuel Type Primary Modifiers Occupancy Construction Number of Stories Year Built Floor Areas Secondary Modifiers Roof Characteristics Ember Accumulators Cladding/Deck Infrastructure Accessibility Conditions * Users can override model defaults
  • 13.
    13Copyright © 2015Risk Management Solutions, Inc.. NUMBER V AREA OF CALIFORNIA FIRES Source: Short, Karen C. 2017. Spatial wildfire occurrence data for the United States, 1992-2015, USDA Forest Service, Missoula Fire Science Laboratory - 2,000 4,000 6,000 8,000 10,000 12,000 0 50 100 150 200 250 1991 1993 1995 1997 1999 2001 2003 2005 2007 2009 2011 2013 2015 Averageburnedareaperfire(acre) Annulanumberoffires California number of fires > 300 ac) Number of fires Average Annual Acres Burned (1992-2015) Average Acres burned Per Fire Linear (Number of fires) Linear (Average Acres burned Per Fire)
  • 14.
    14Copyright © 2015Risk Management Solutions, Inc.. 0.95 (0.71) (1.08) (0.89) 1.84 (0.05) 1.911.93 1.48 (2.50) (2.00) (1.50) (1.00) (0.50) - 0.50 1.00 1.50 2.00 2.50 (3.00) (2.00) (1.00) - 1.00 2.00 3.00 May-Septemperatureanomalies(degreeF) May-Oct precipitation anomalies (in) California Wet, HotDry, Hot Dry, Cold Wet, Cold YEARS WITH LOSS > $1B (MAY-OCT) (ANOMALIES VS 1980-2018) 1991,1993,1999, 2003, 2007, 2008, 2013, 2017, 2018 1991 2007 19931999 2003 2015 2017 2018 2008
  • 15.
    15Copyright © 2015Risk Management Solutions, Inc.. NATURE CLIMATE CHANGE | VOL 8 | MAY 2018 | 427–433
  • 16.
    16Copyright © 2015Risk Management Solutions, Inc.. CLIMATE CHANGE AND WILDFIRE – THE ACCELERANTS Winter rainfall vegetation Hot Summer temperatures Reduced Autumn rainfall Outbreaks of hot easterly winds Legacy of past droughts in dead trees Fuel Load Extended fire season Fire starts and spread Fuel Conditioning Published Climate Change signature
  • 17.
    17Copyright © 2015Risk Management Solutions, Inc.. Building code Vegetation clearance Neighbouring properties? Utility equipment hardening? Wind forecast power cuts? Exploring mitigation options using the risk model
  • 18.
    18Copyright © 2015Risk Management Solutions, Inc.. Built to 2008 Code Fire resistant roofs, sidings and other clearances In 2018 Camp Fire 51% houses built since 2008 undamaged but only 18% pre-2008 Unless zoned ‘fire prone’ code is not mandated (eg Coffey Park rebuilds).
  • 19.
    19Copyright © 2015Risk Management Solutions, Inc.. ‘It’s not the fires advancing towards the exposure but the exposure expanding into the fires’