Download as PDF, PPTX
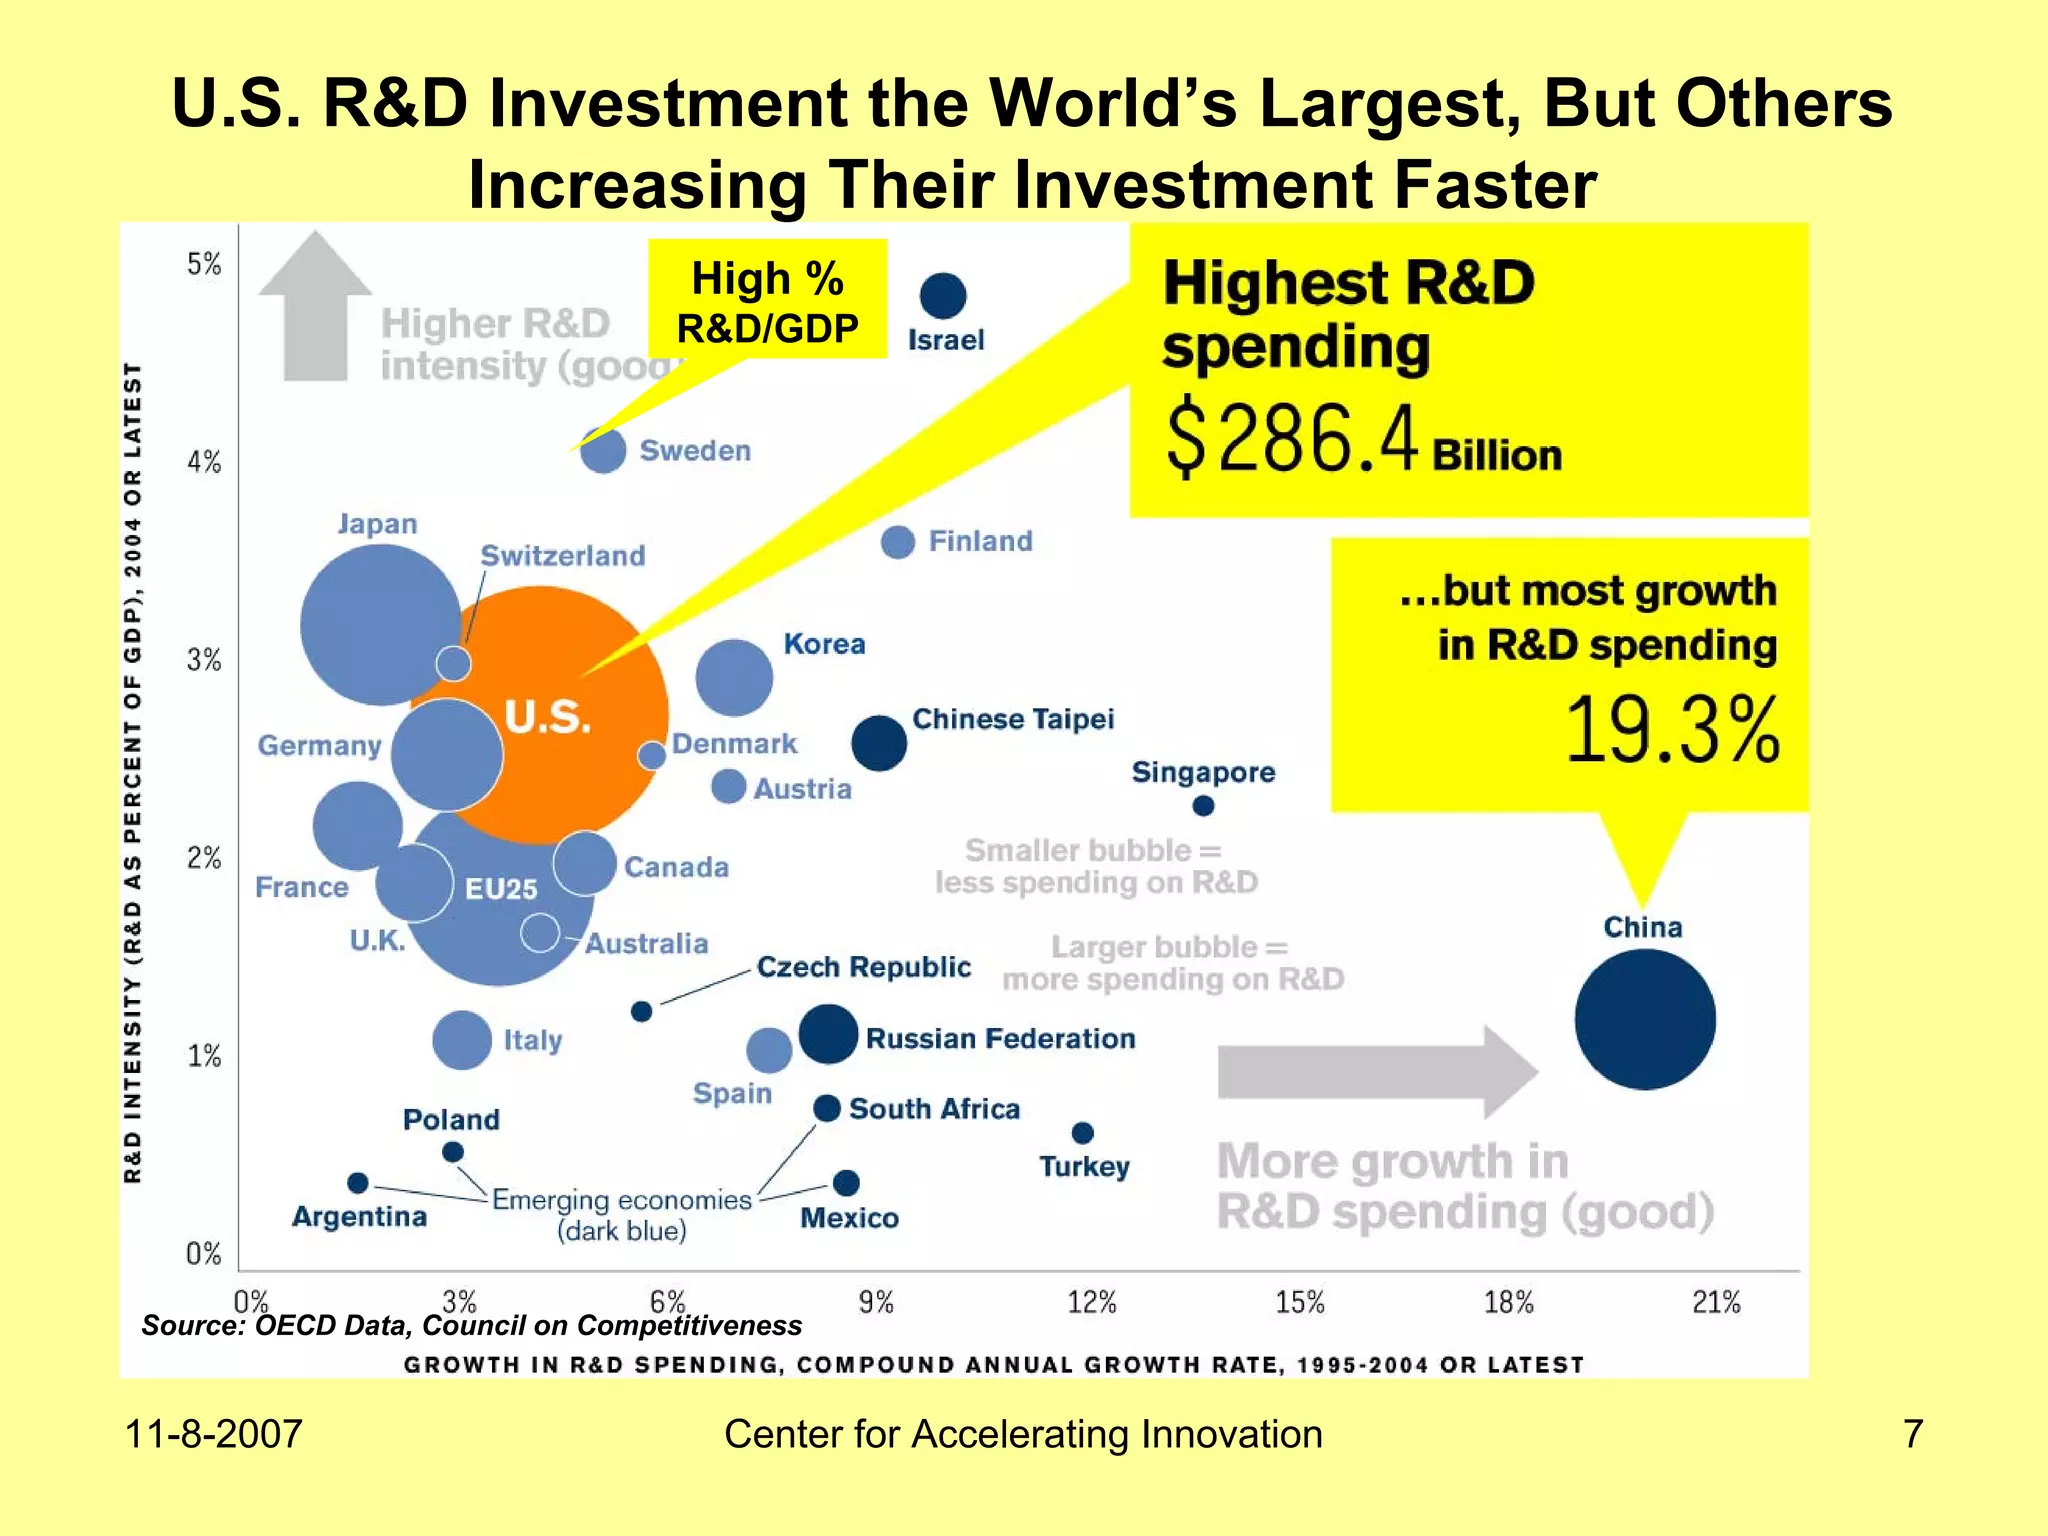
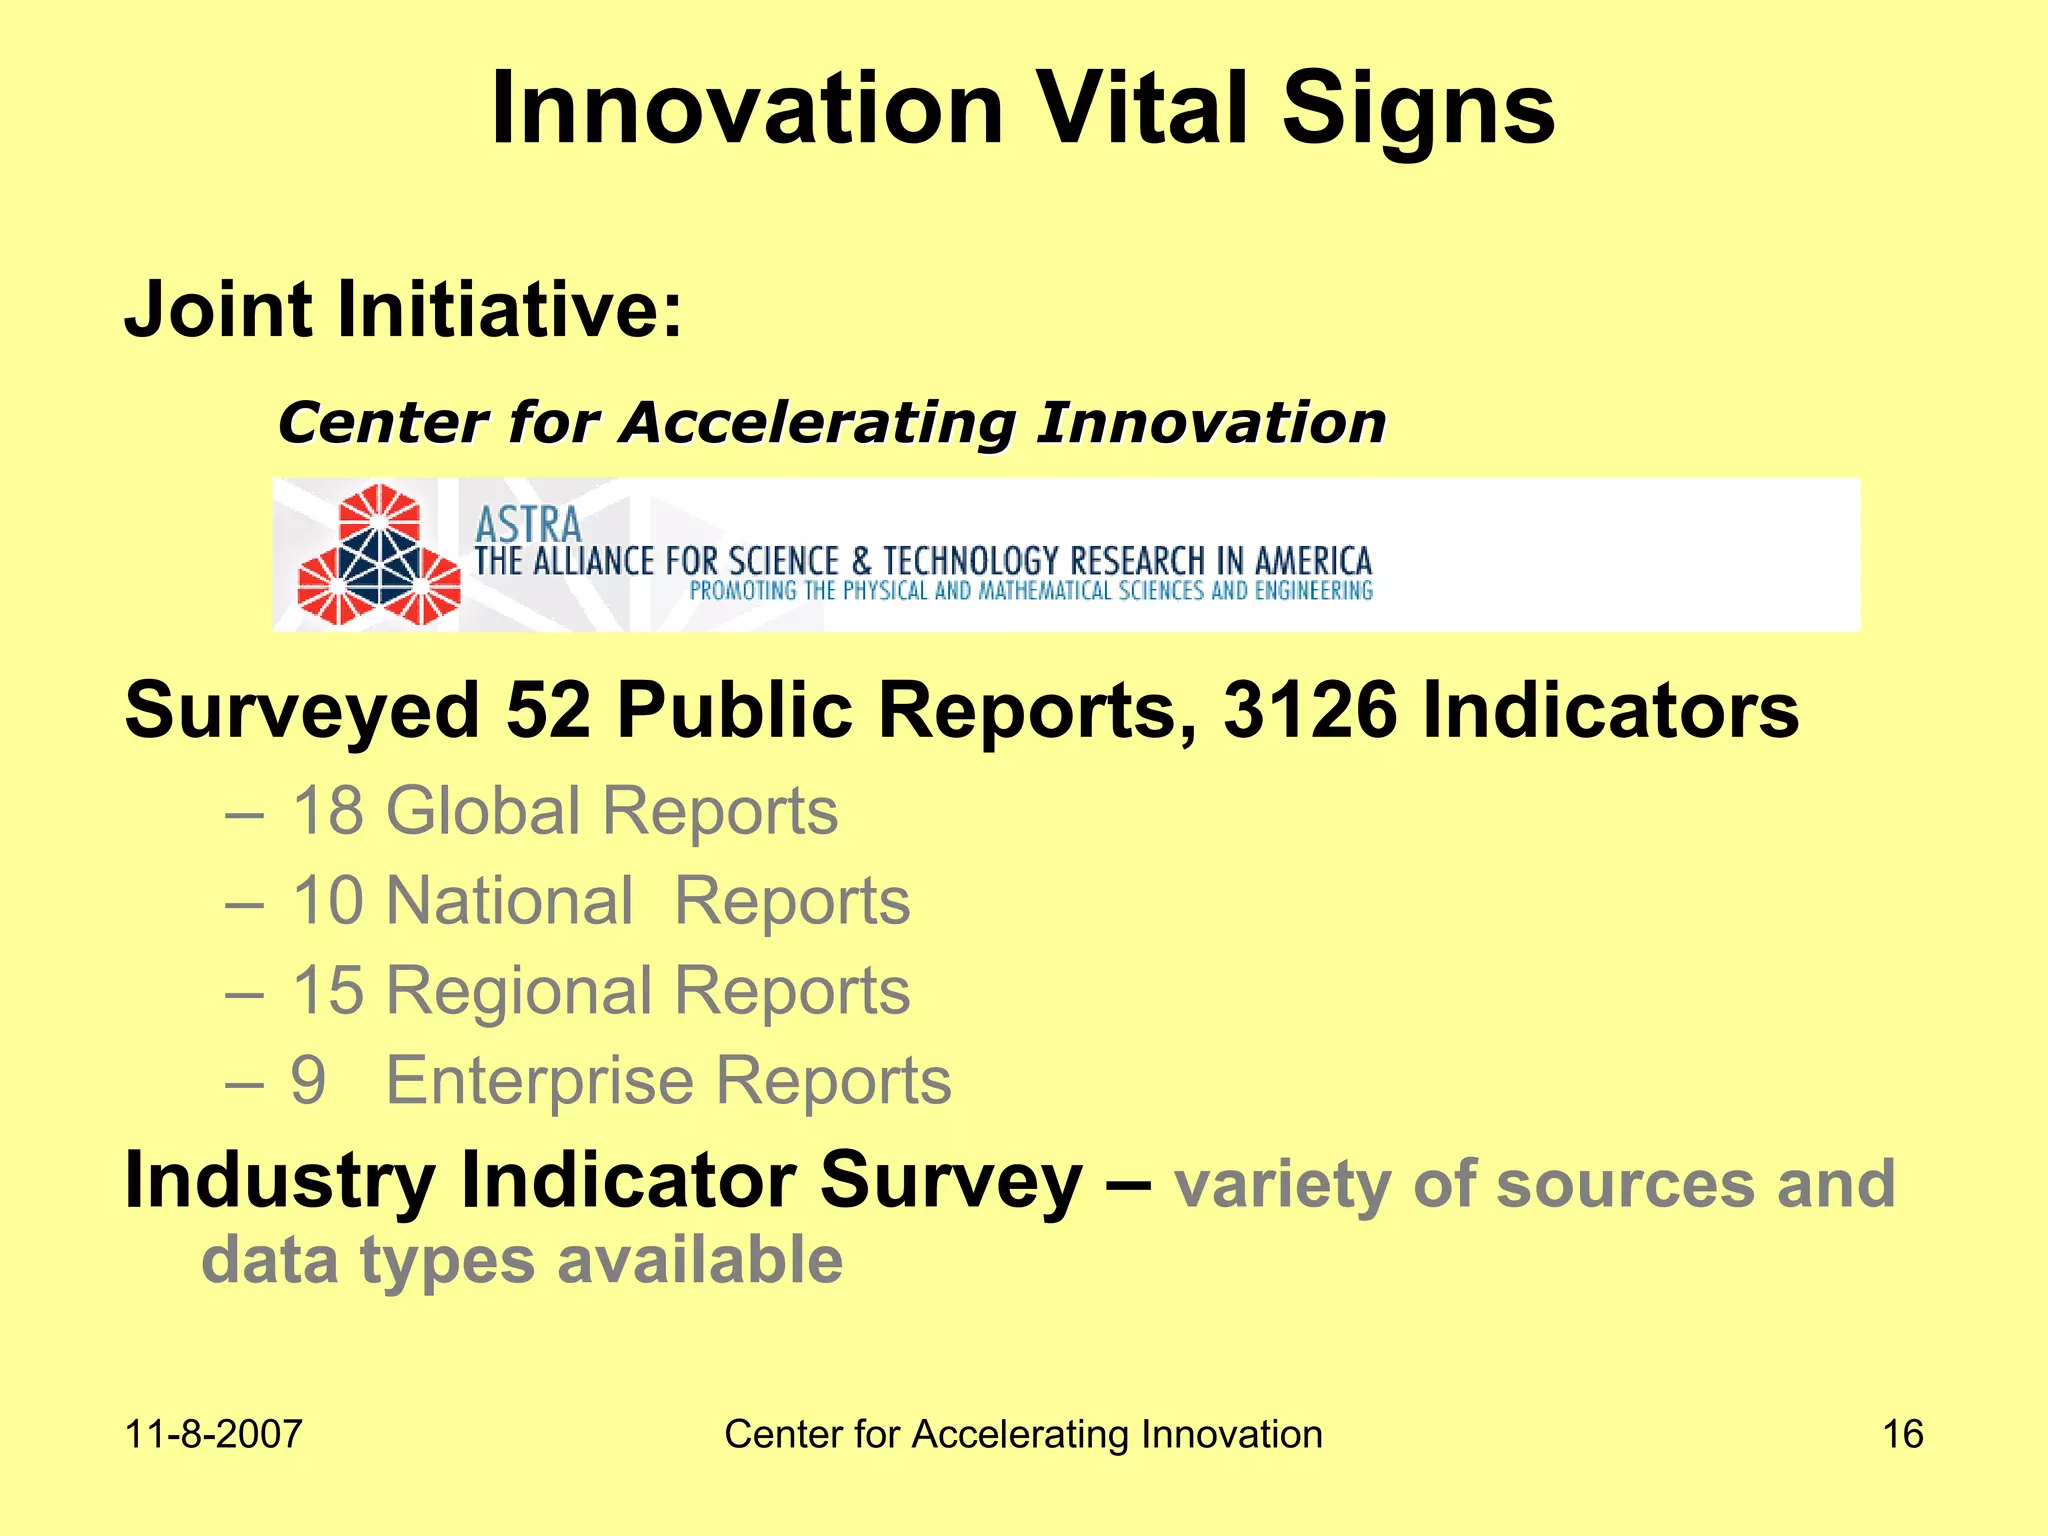
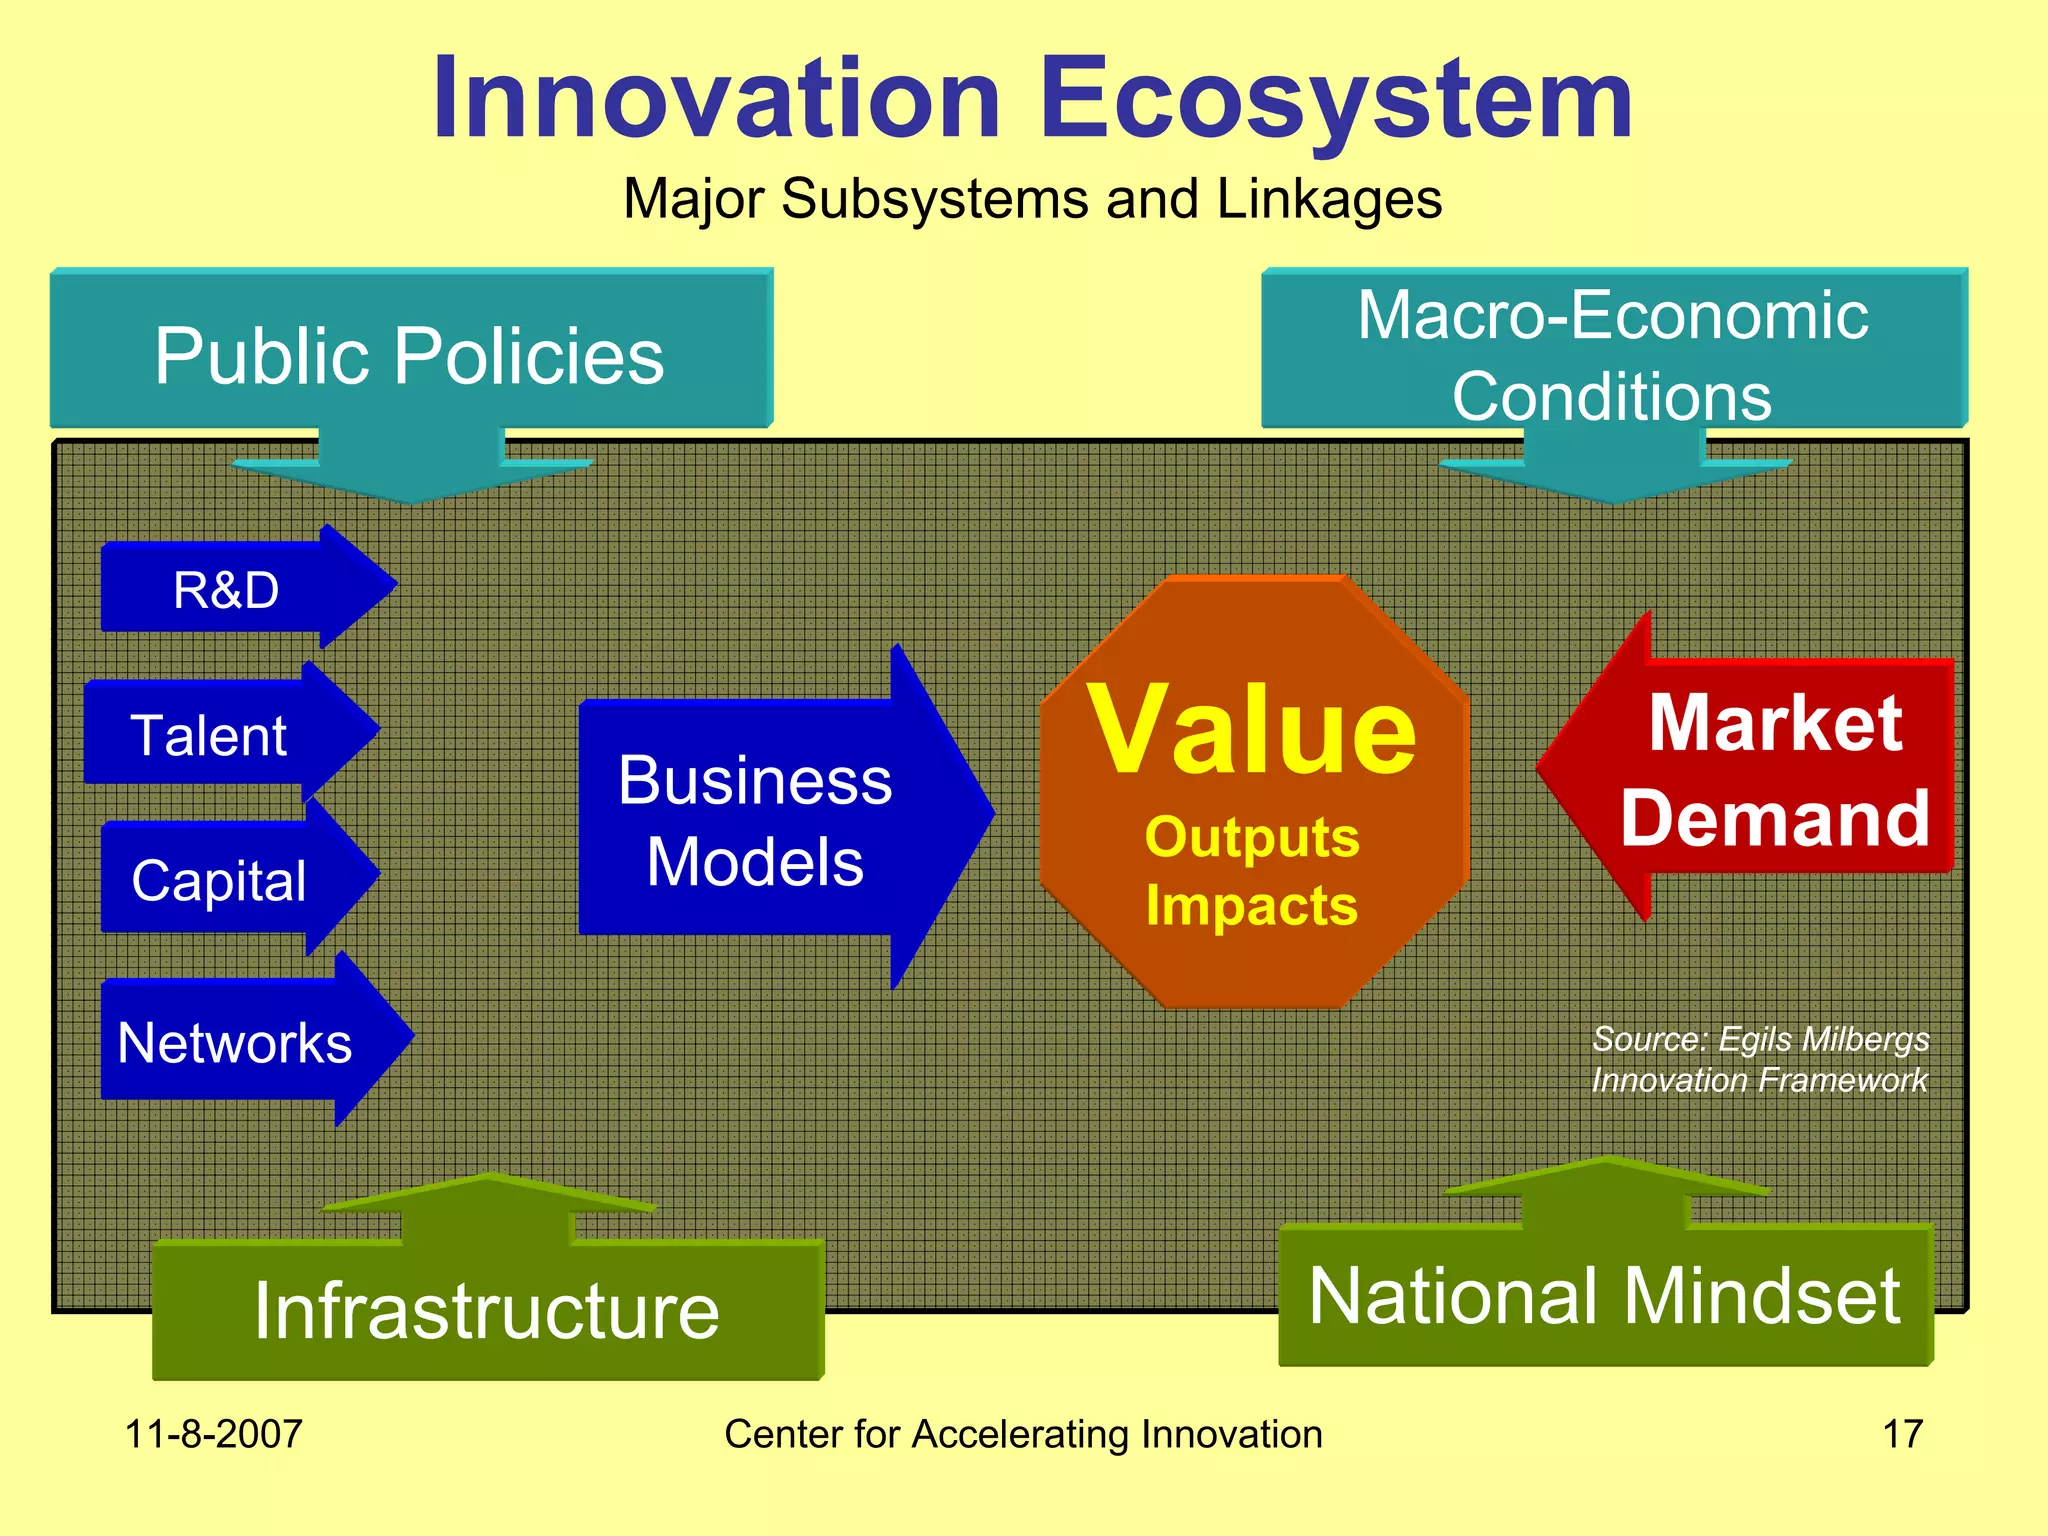
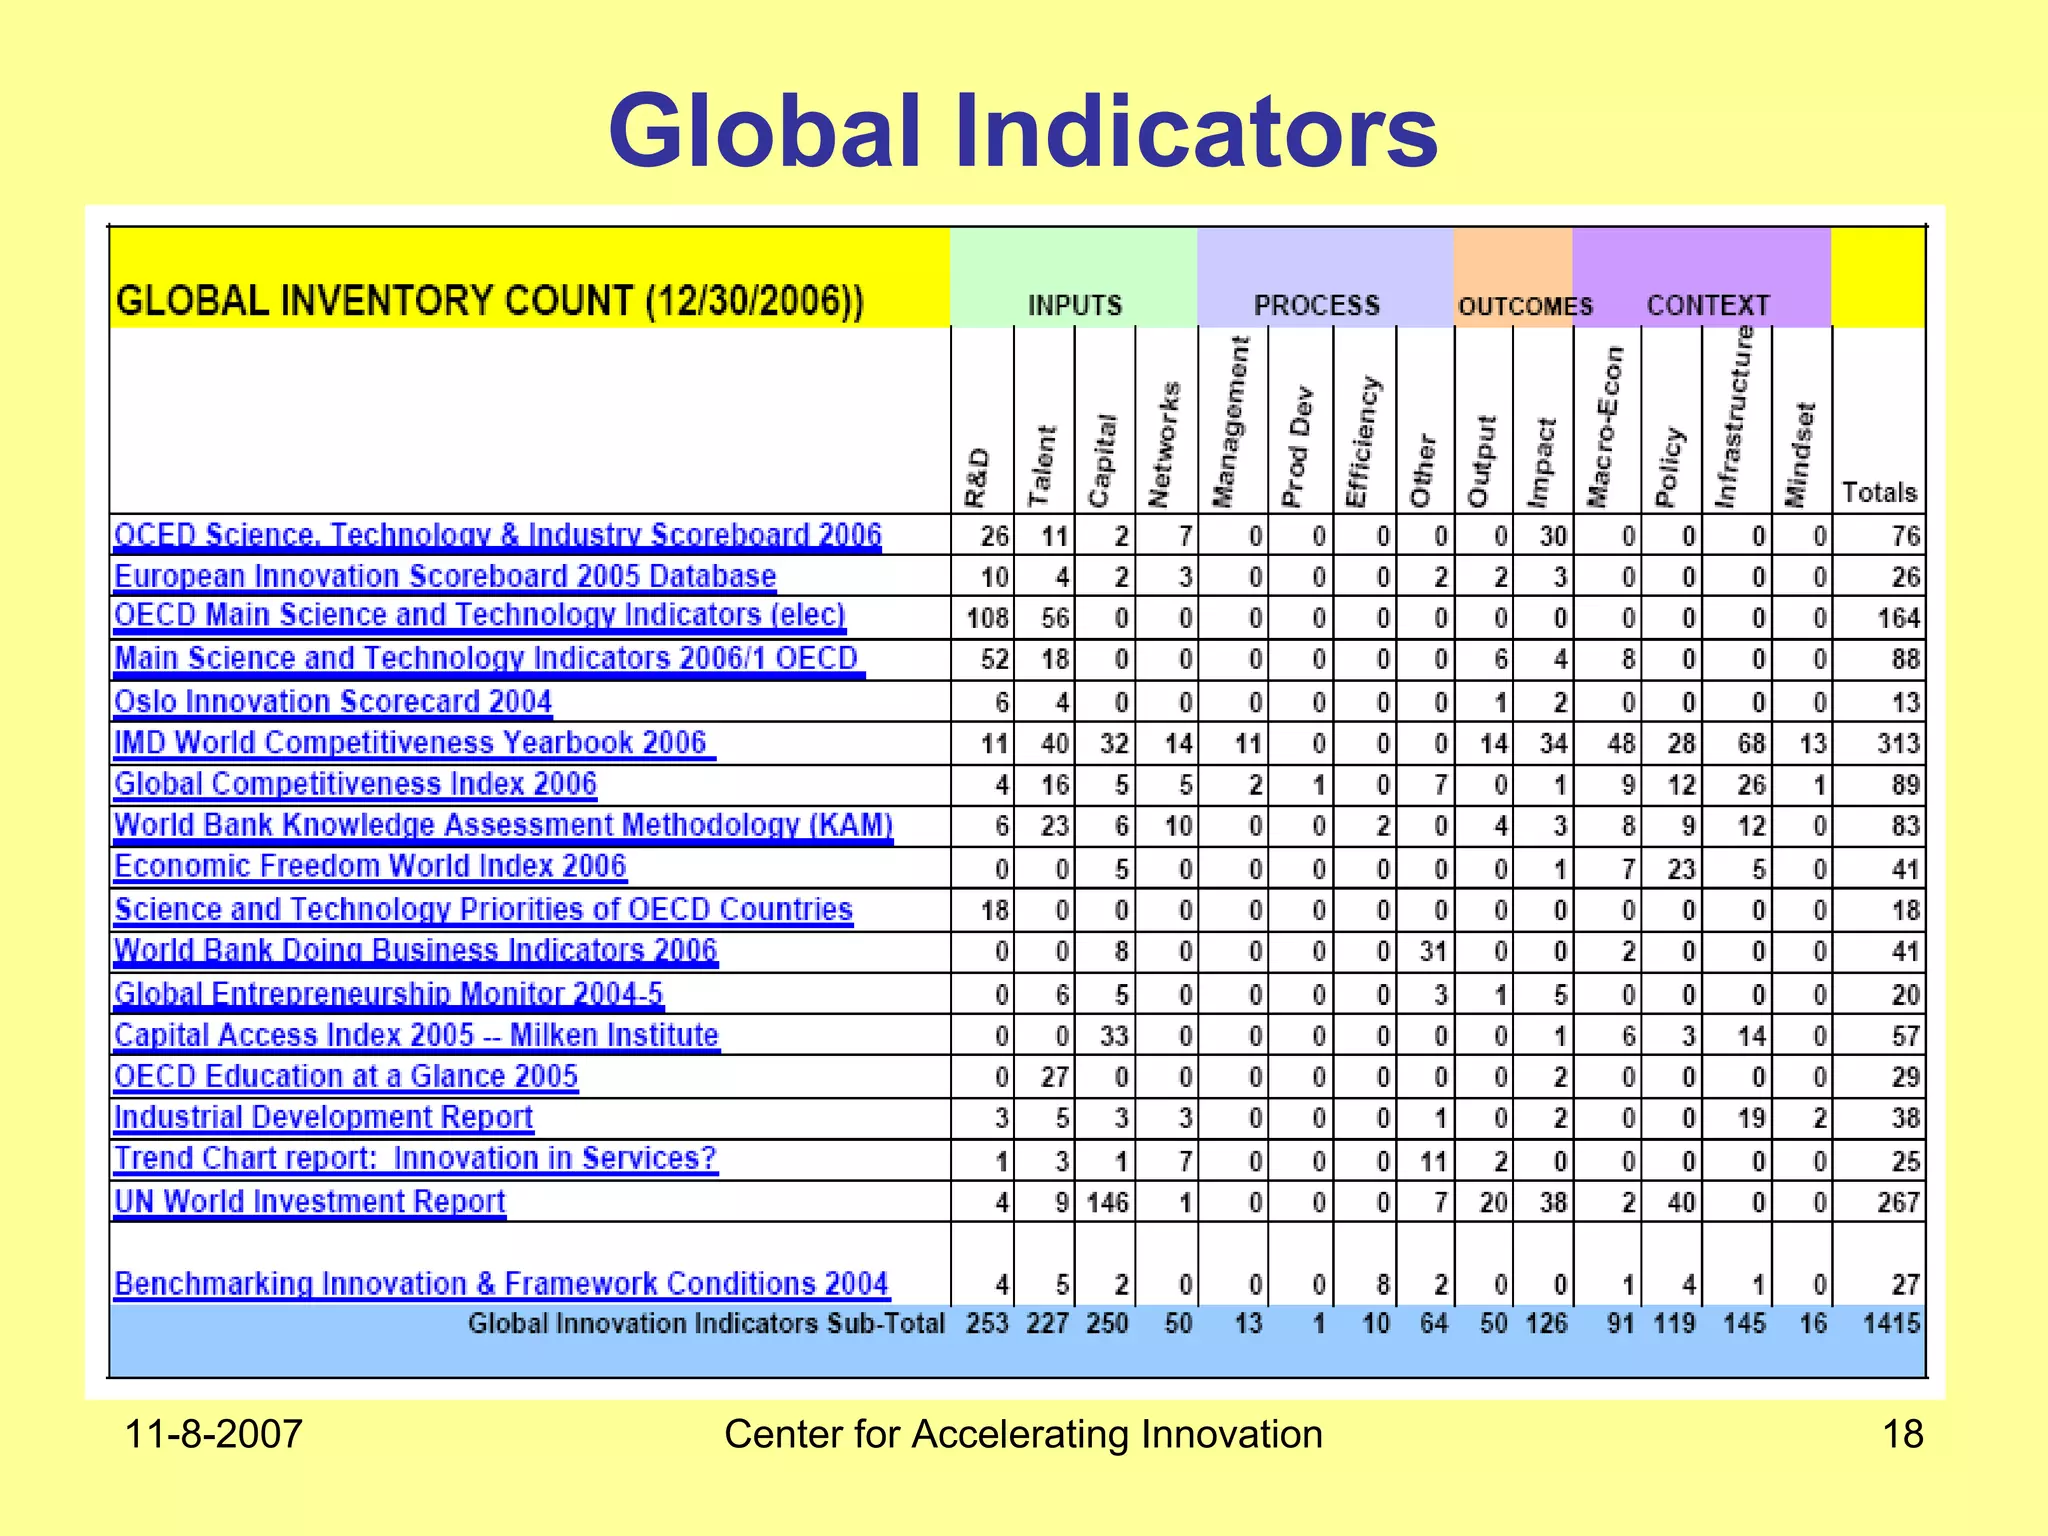
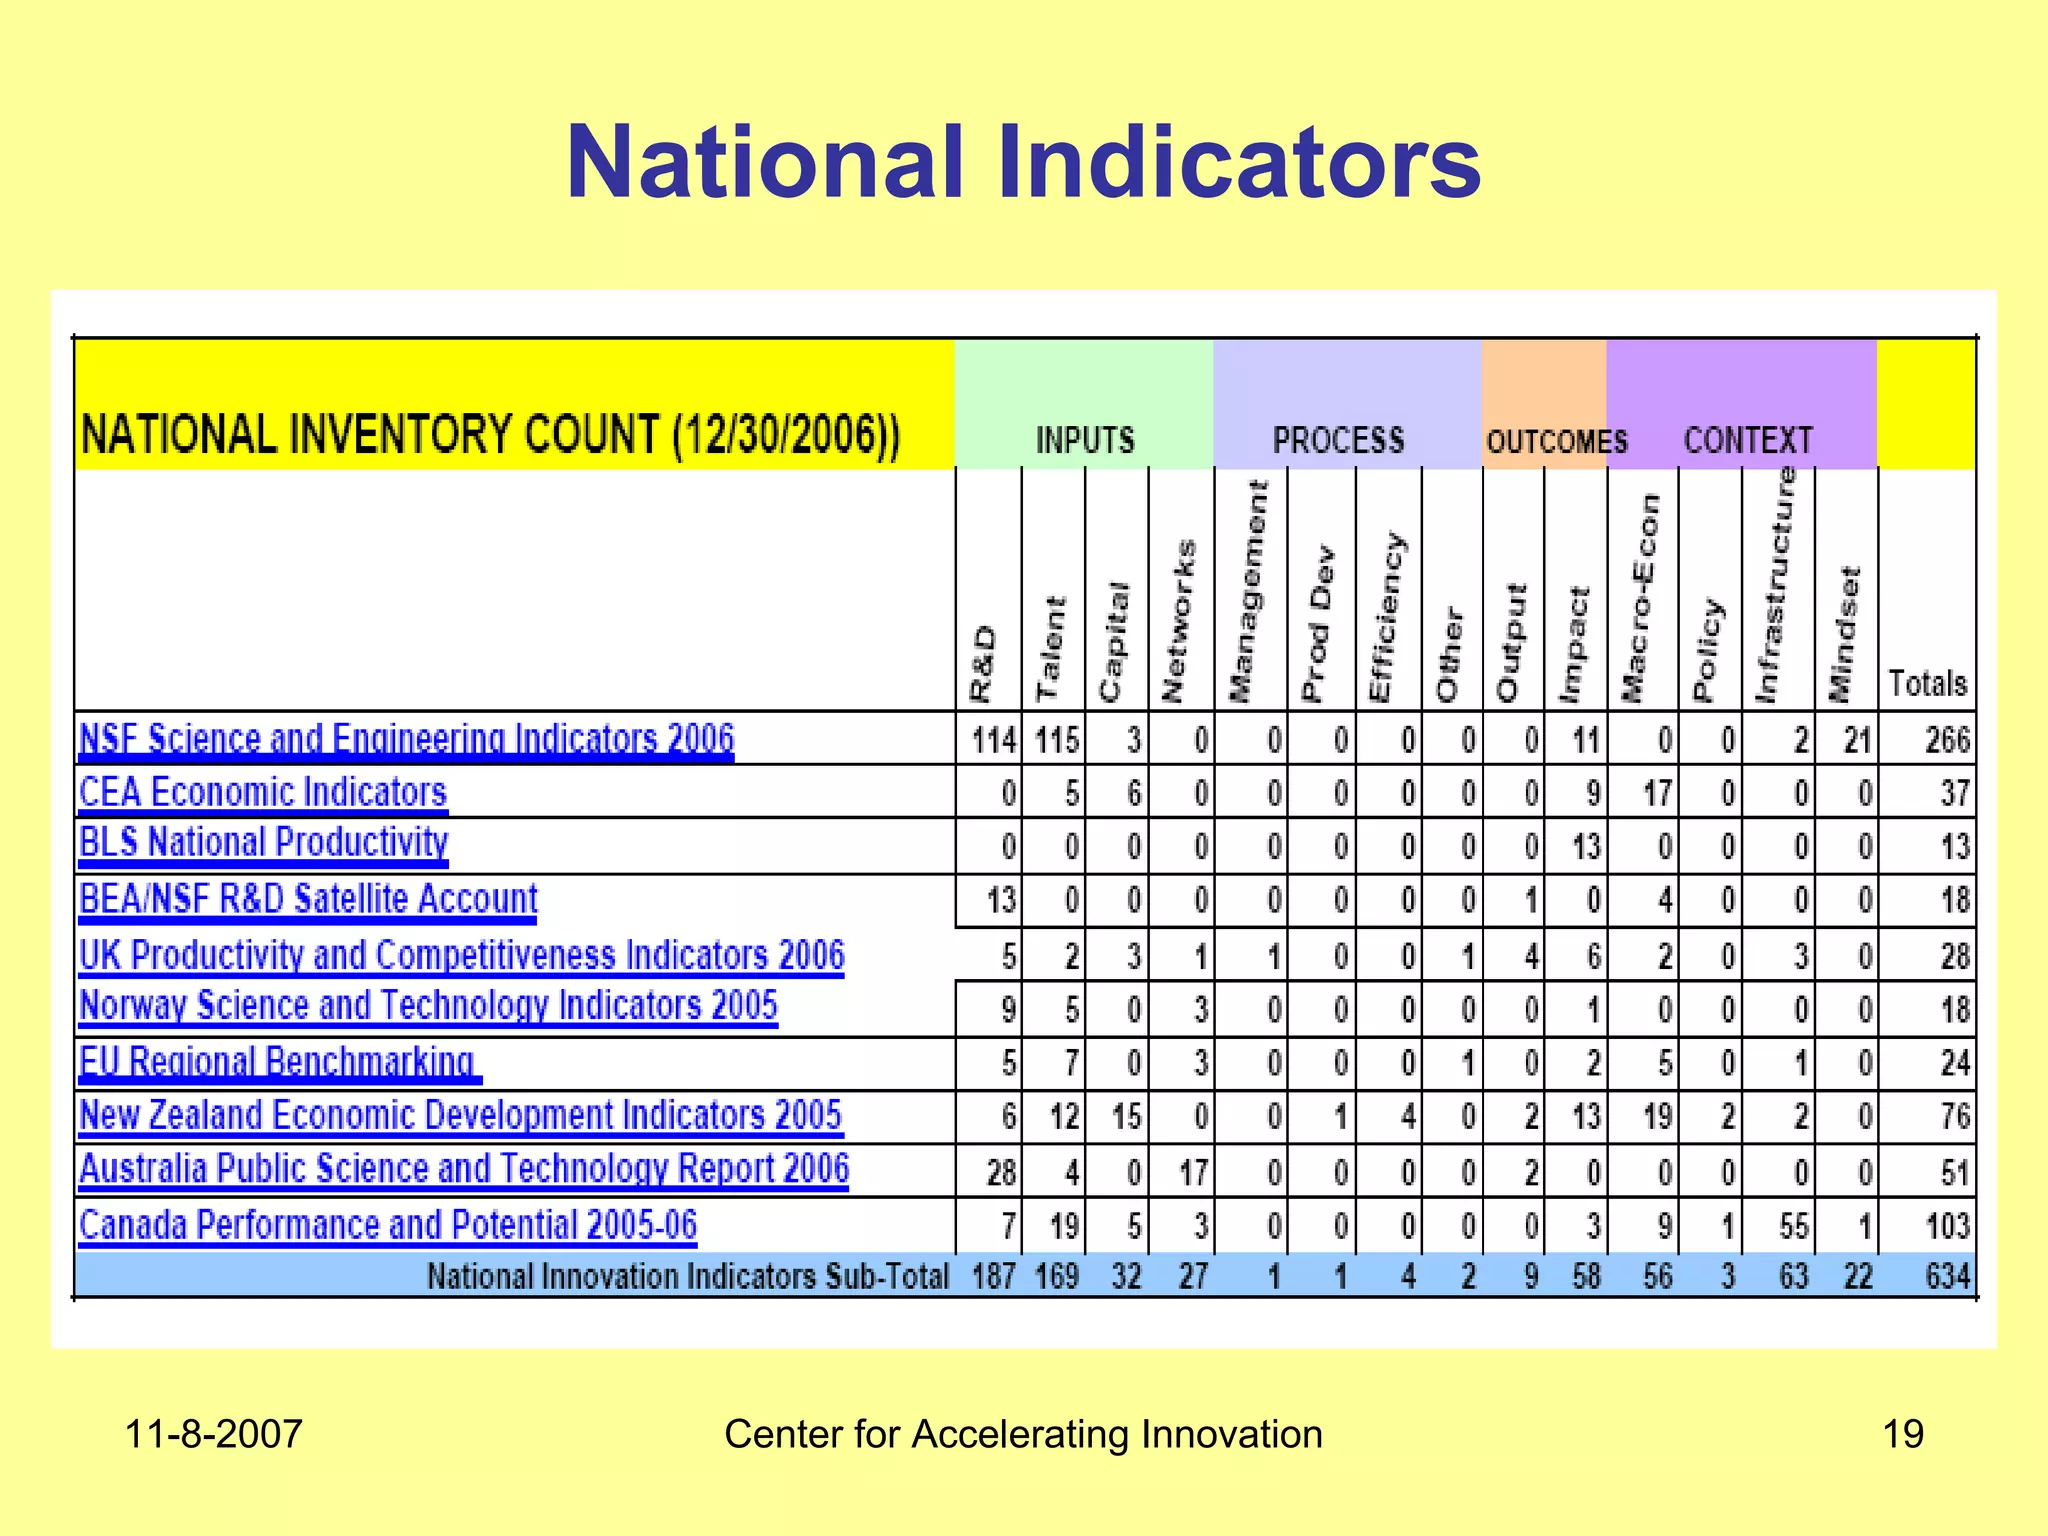
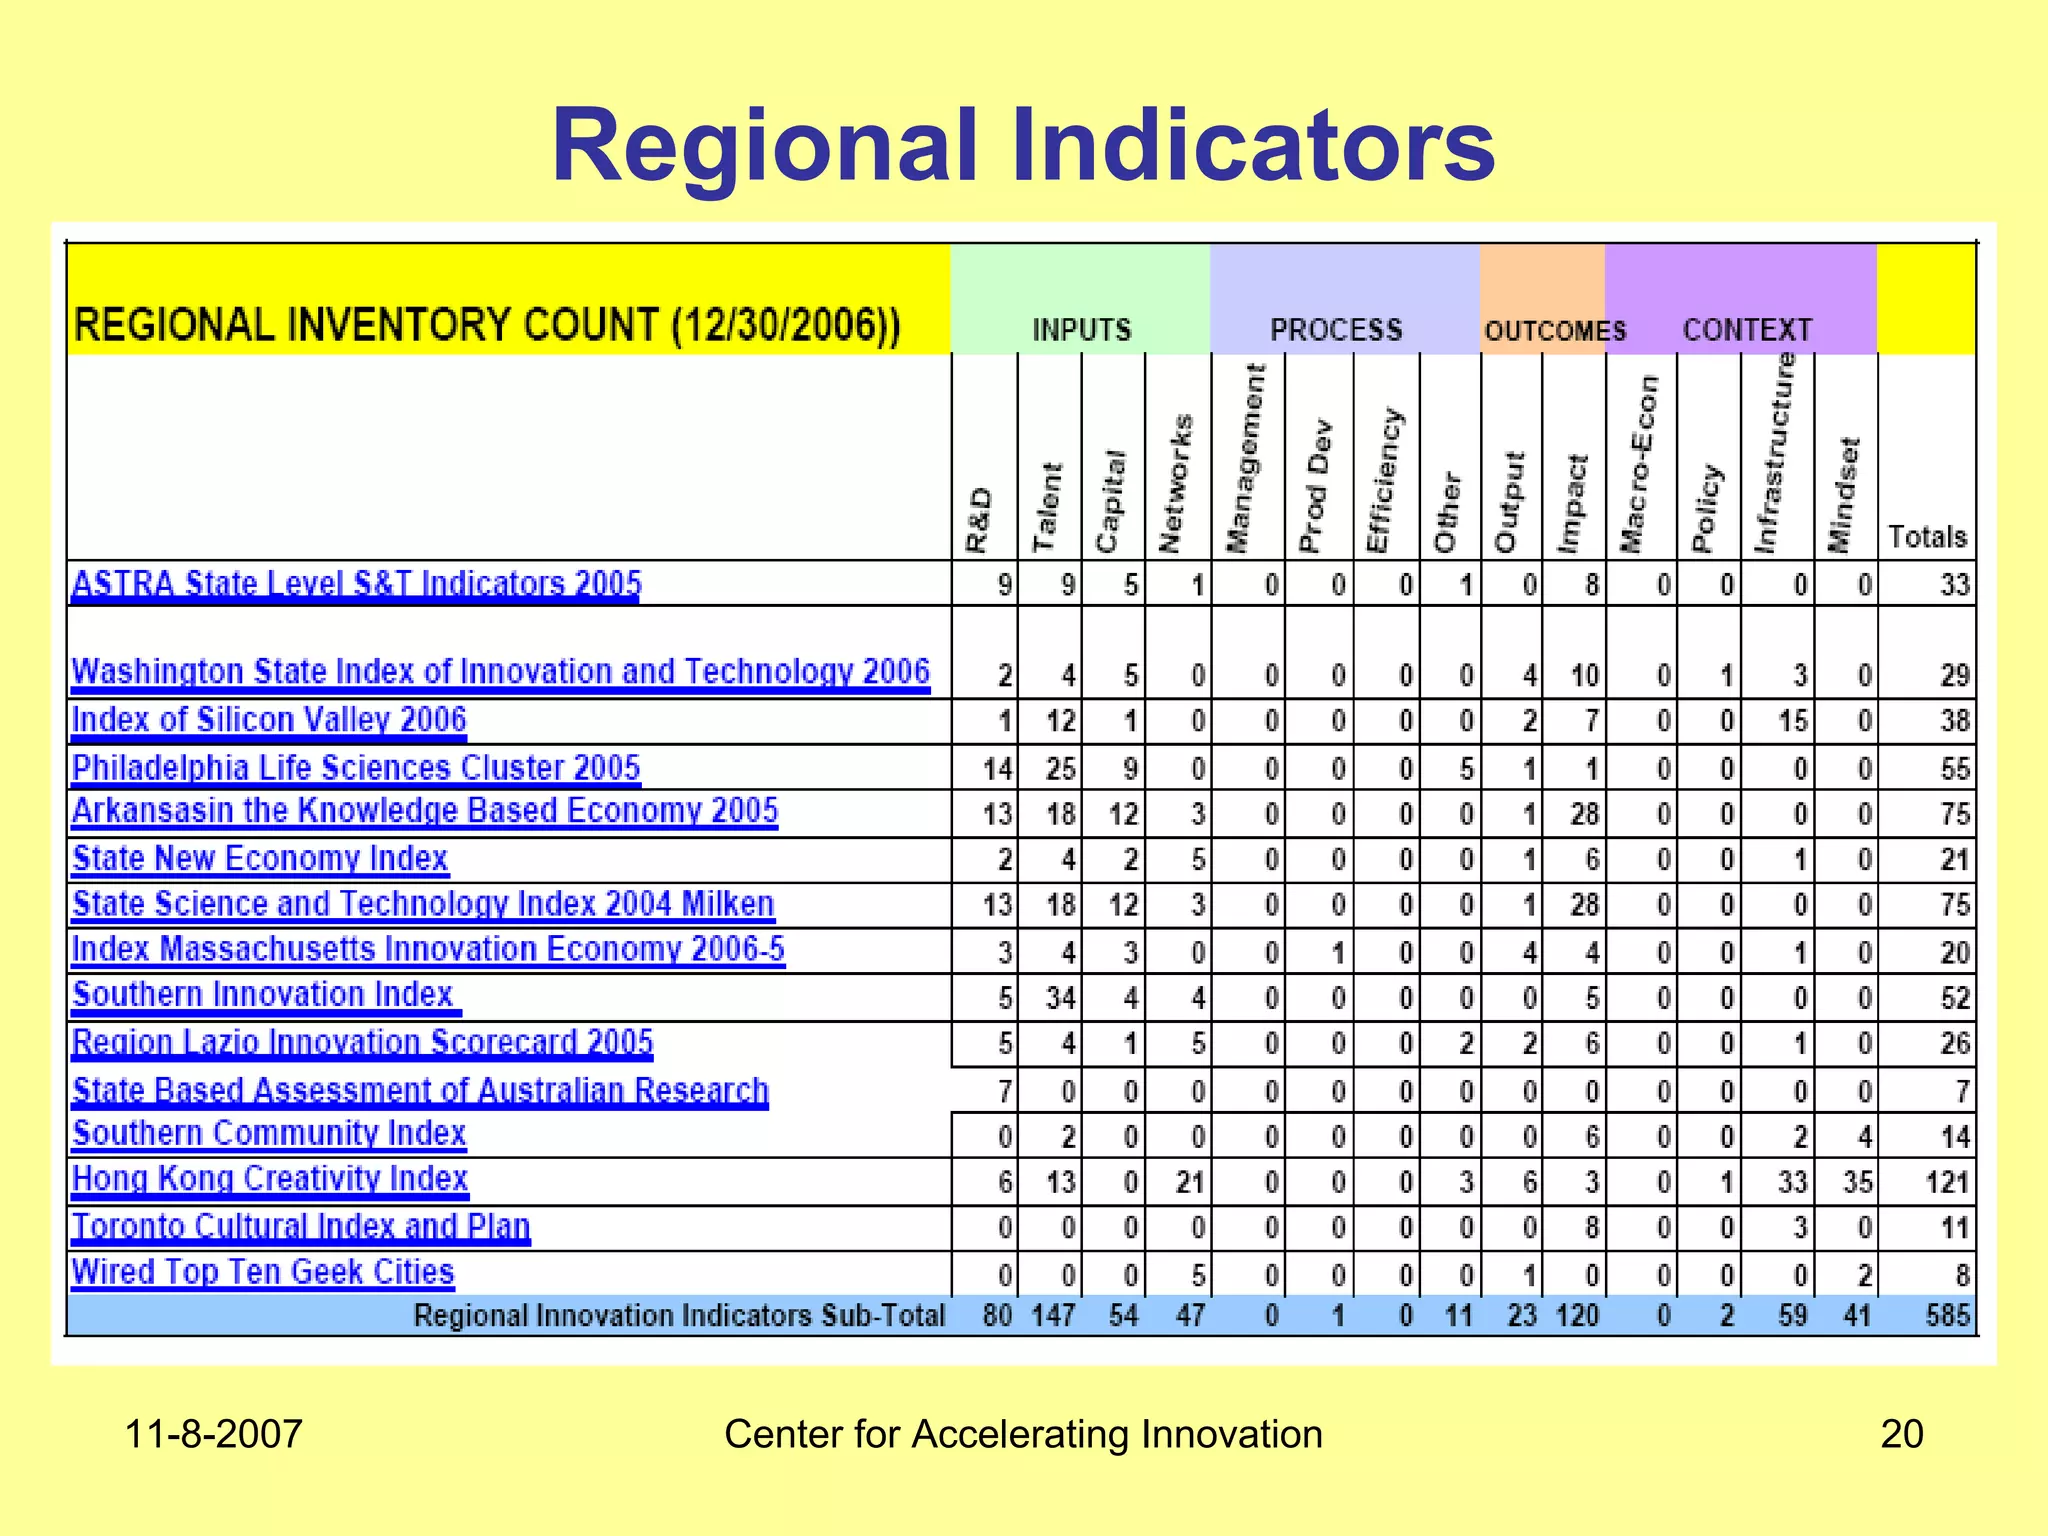
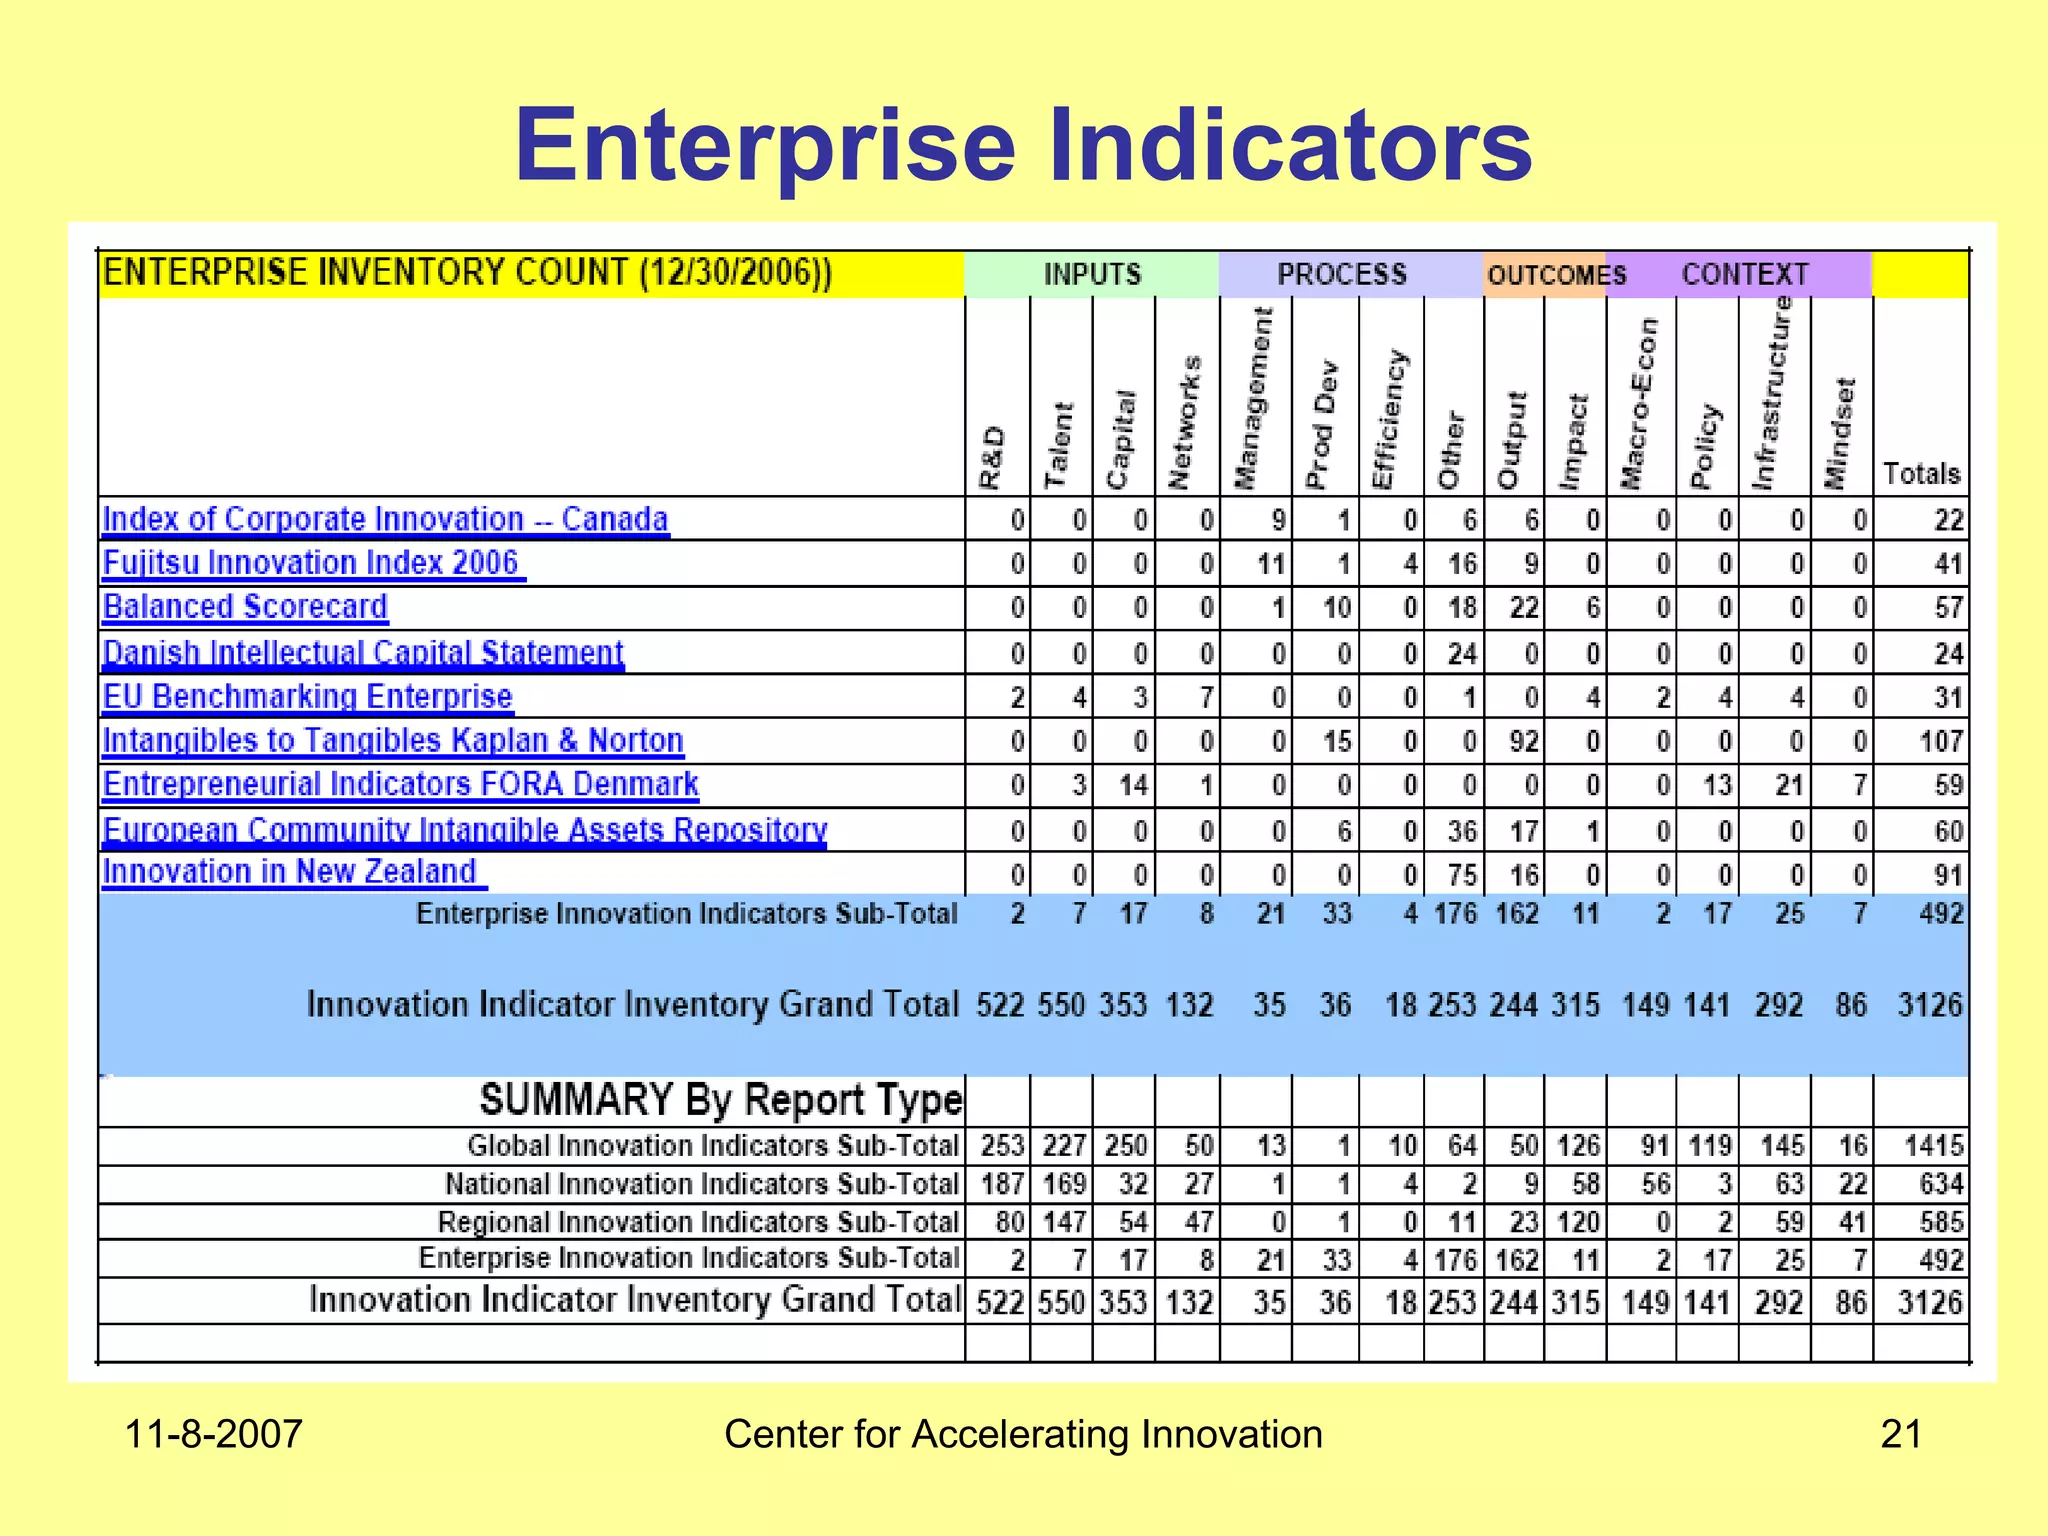
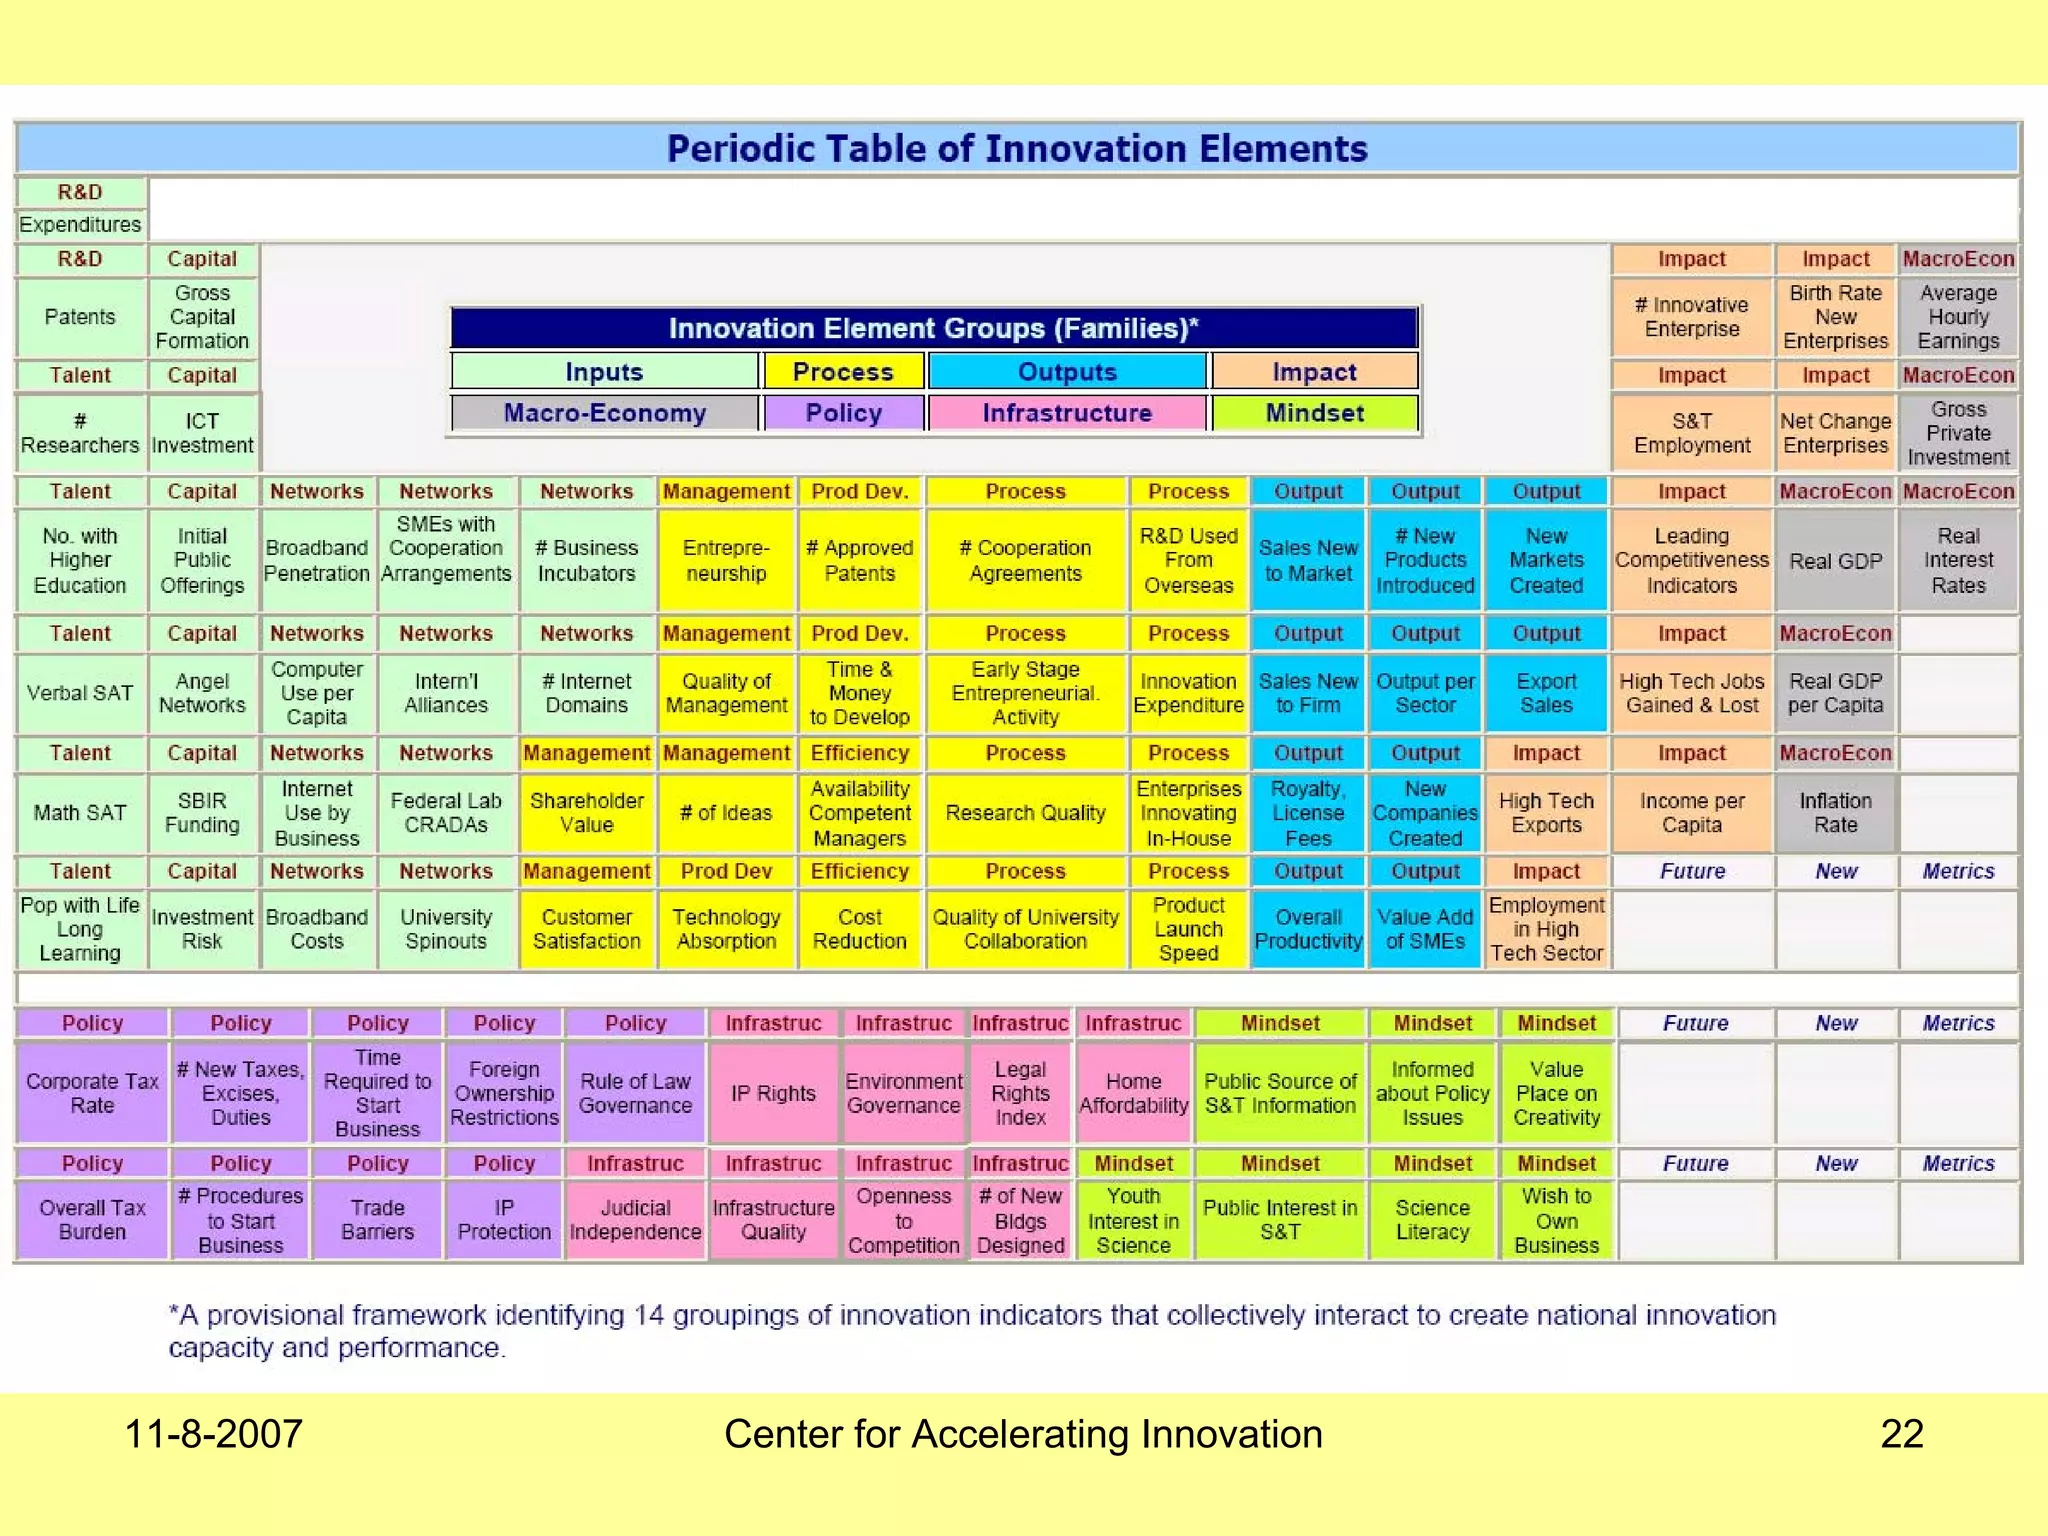
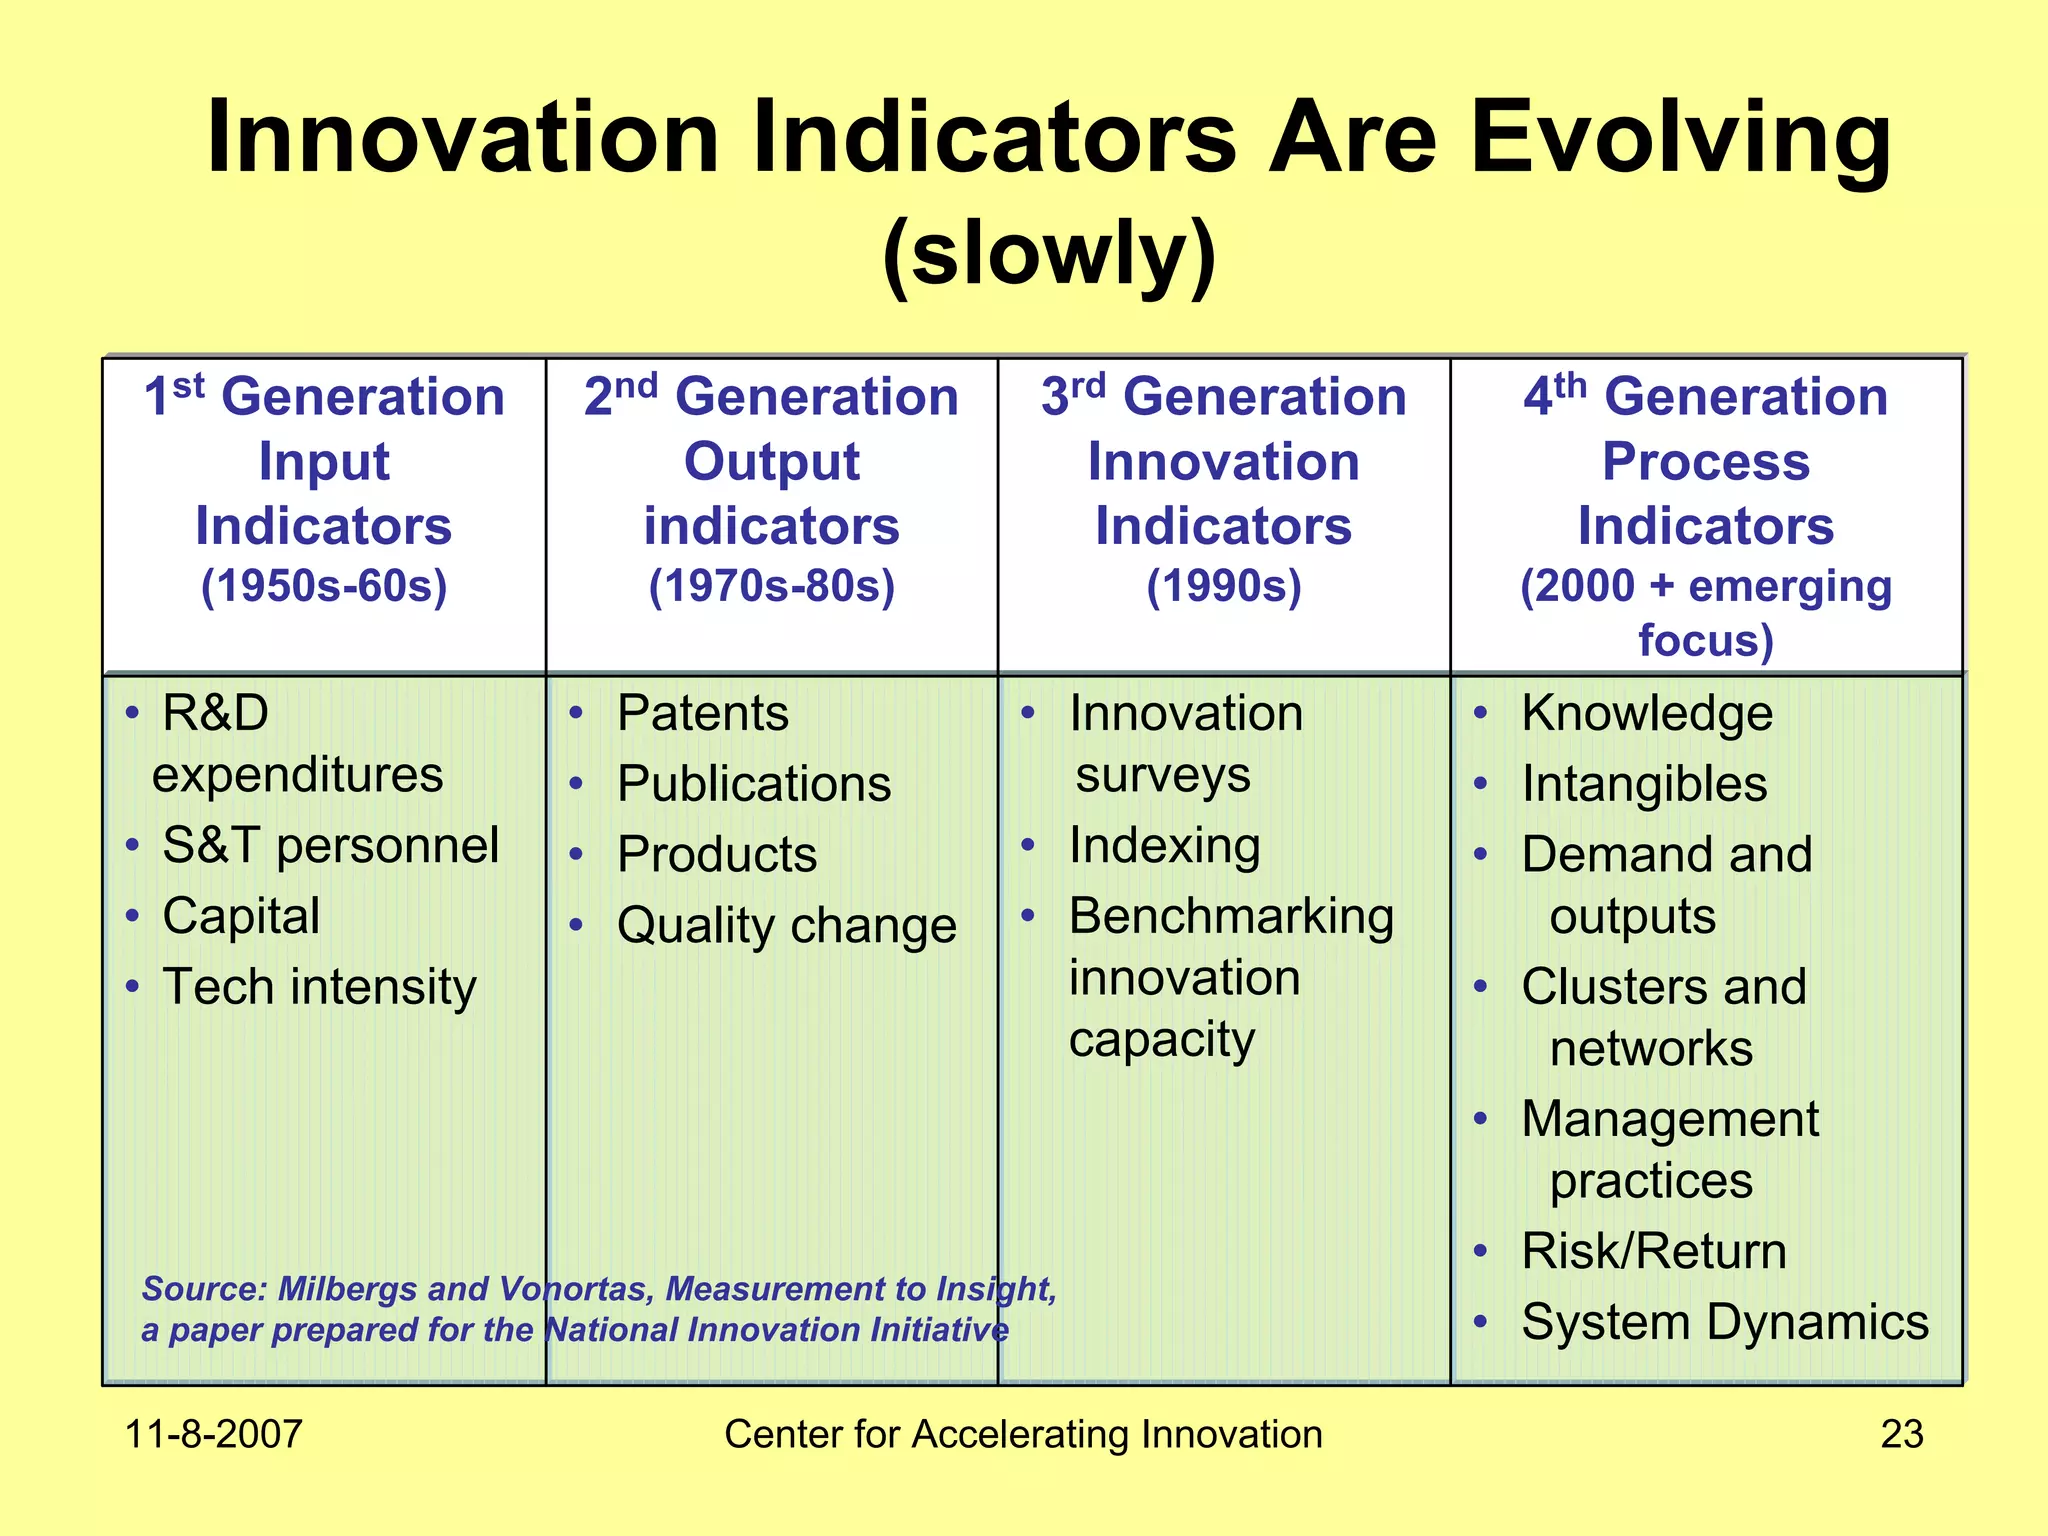
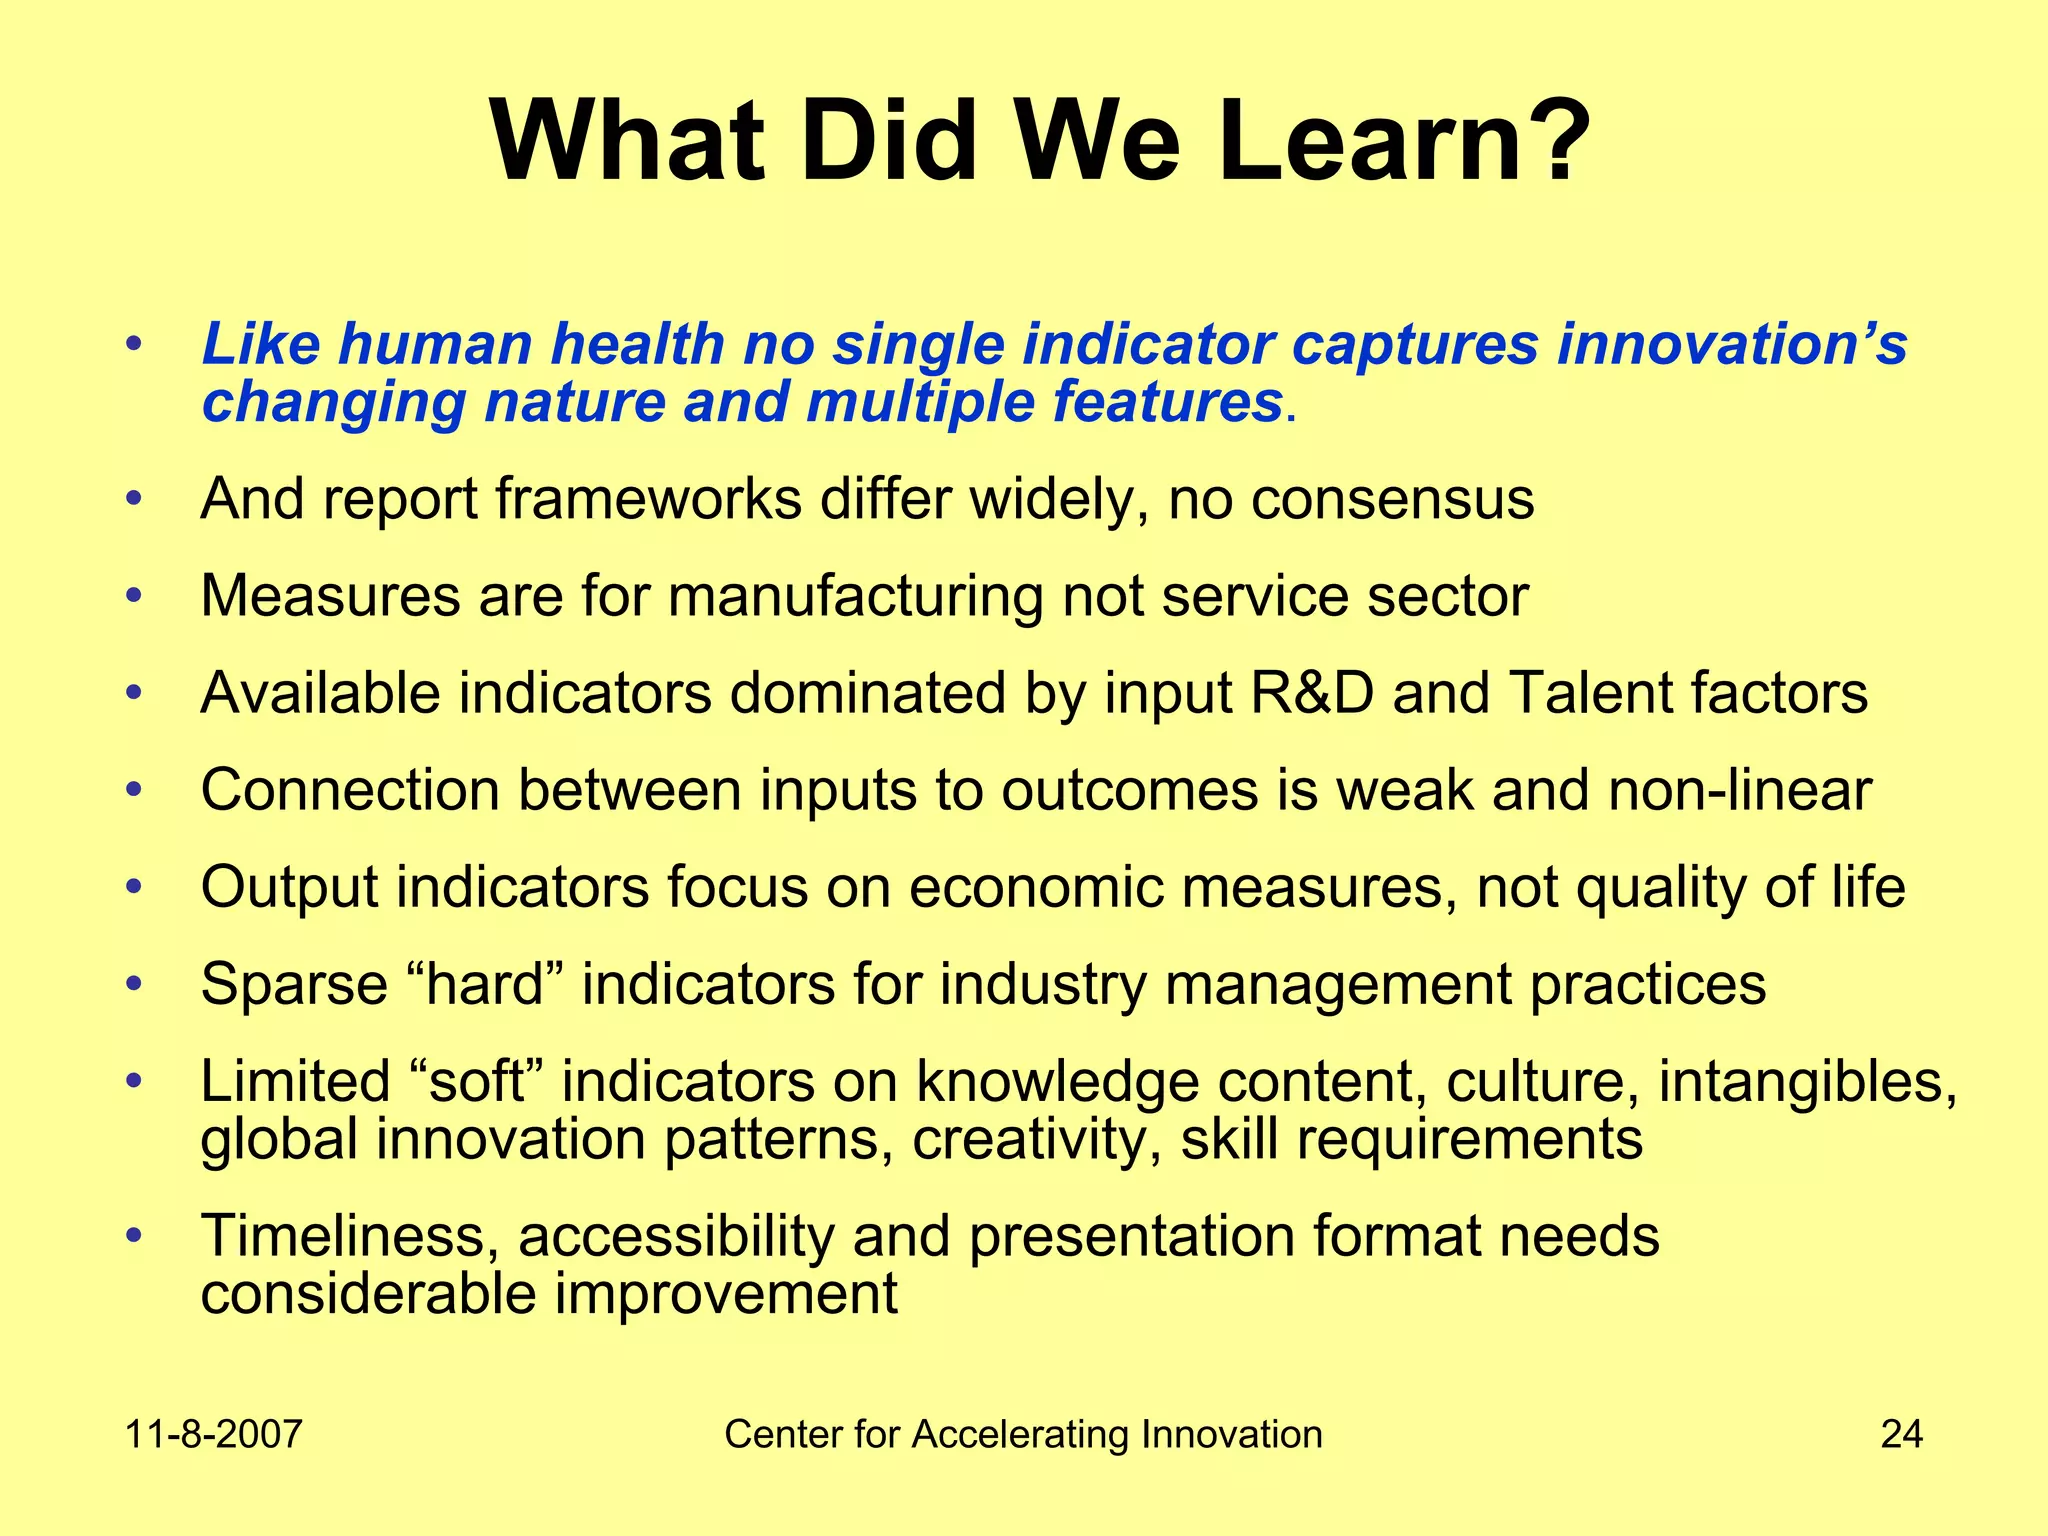

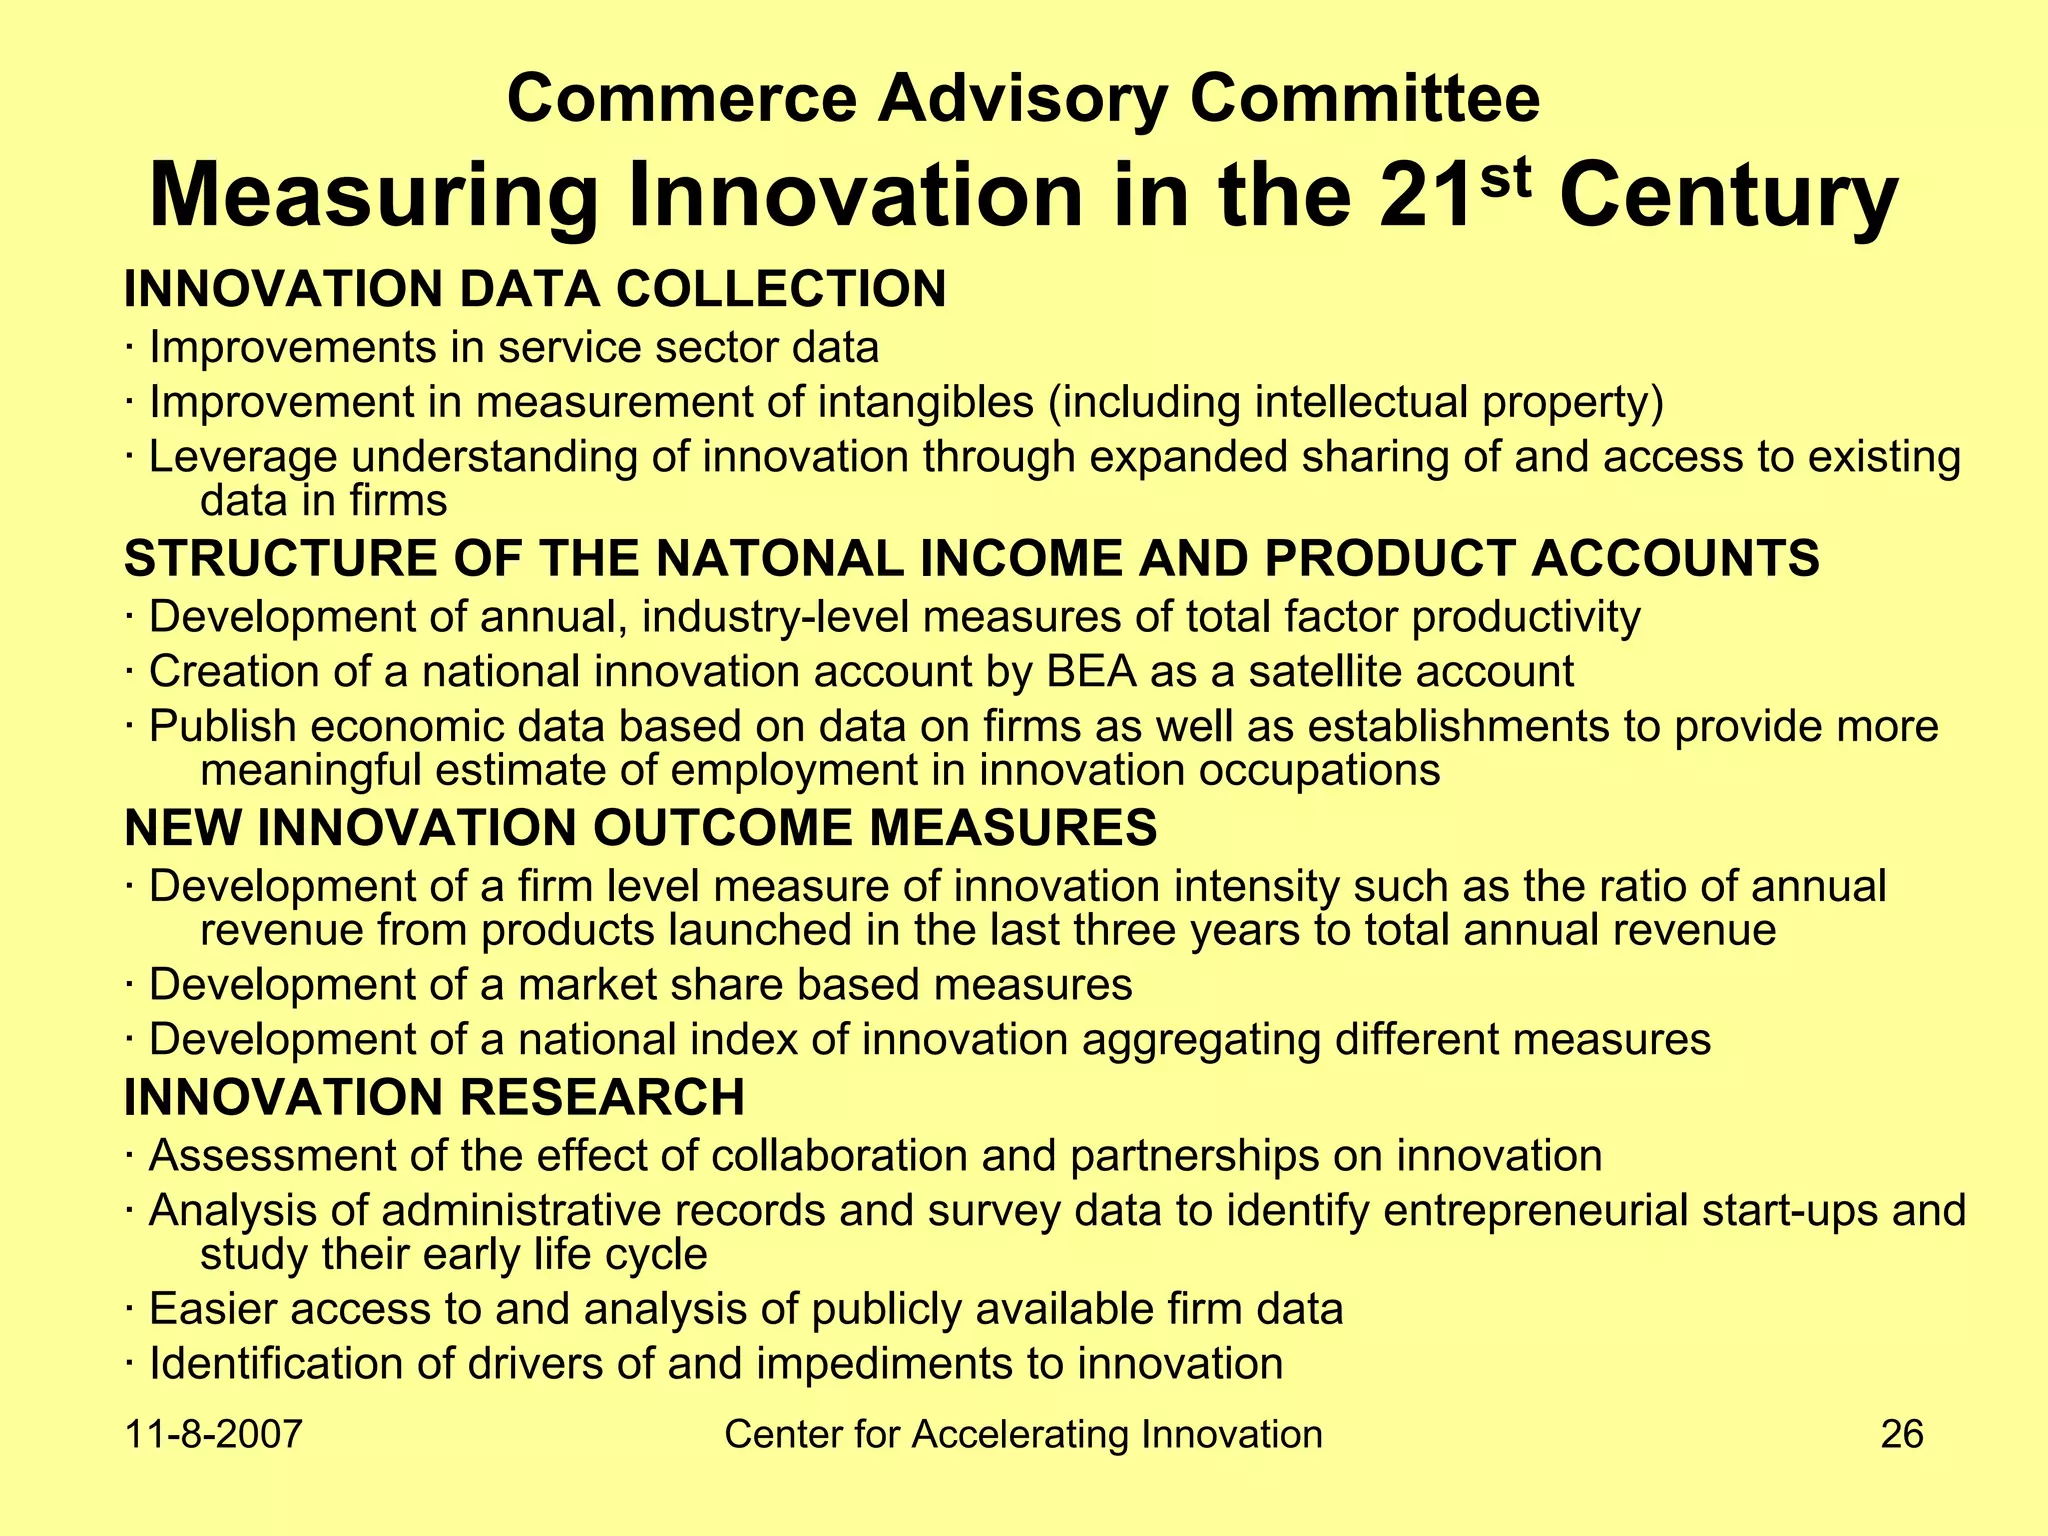

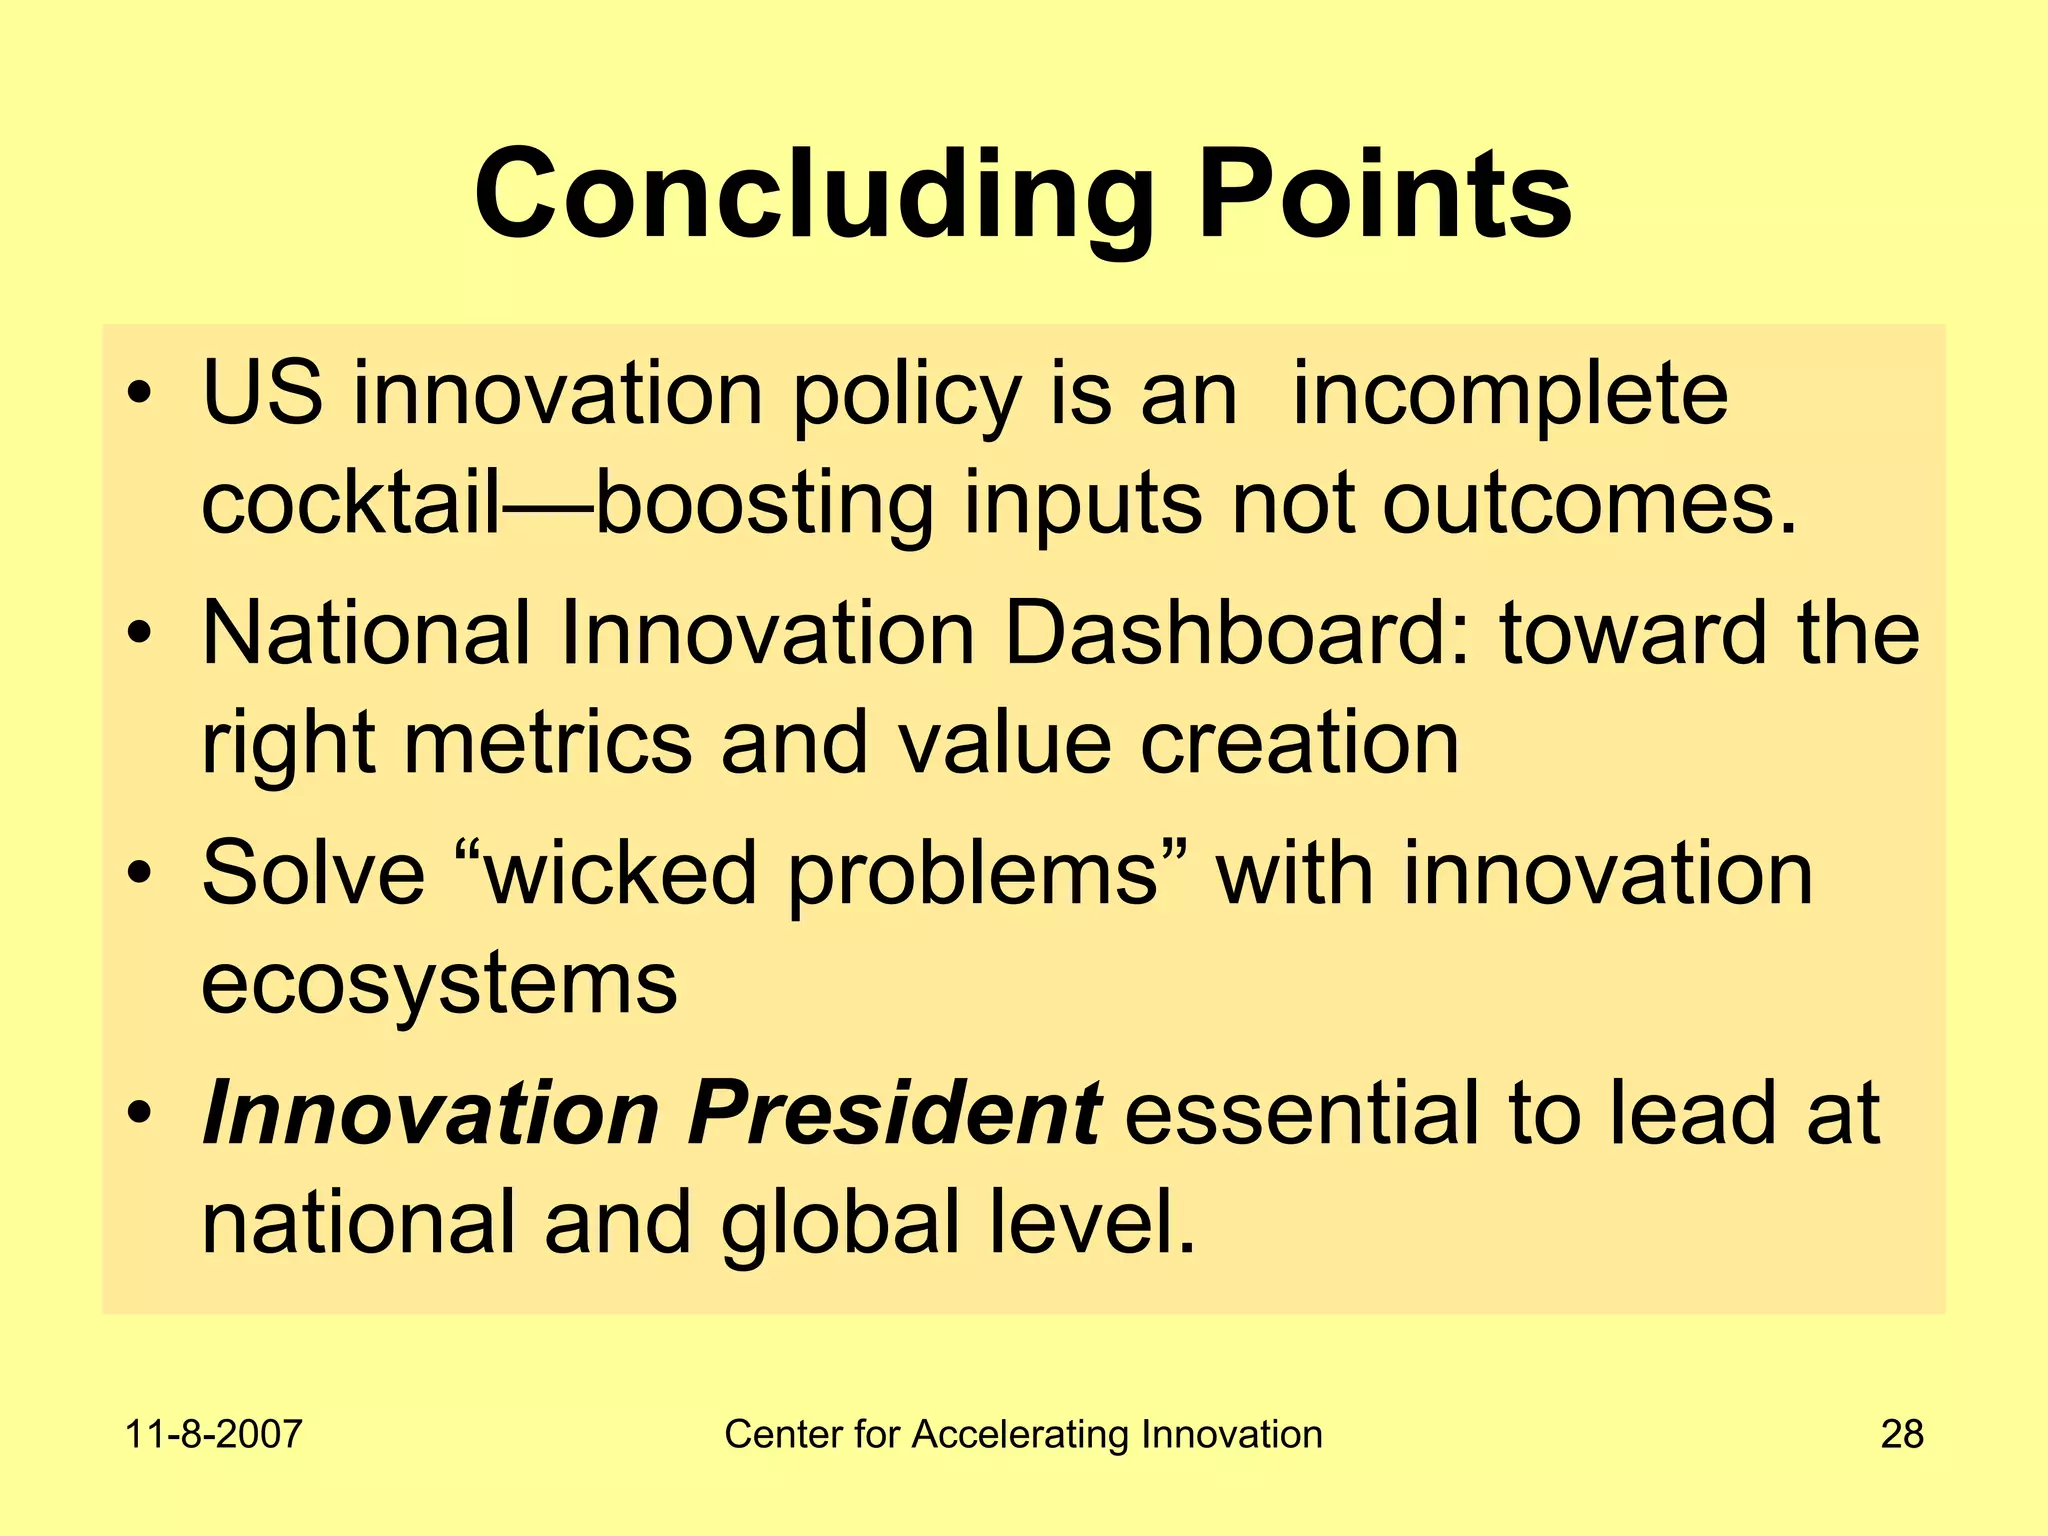


The document discusses innovation indicators and metrics. It notes that currently available indicators are limited and focus mainly on inputs like R&D spending rather than outcomes. It calls for the development of better measures that capture factors like knowledge, intangibles, management practices, and the service sector. The document also advocates using indicators to inform policy and creating a national innovation dashboard to track metrics and the overall innovation ecosystem.


