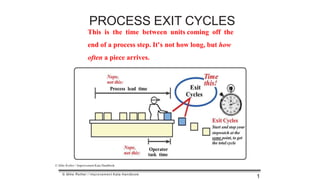
The document discusses process exit cycles, which refers to the time between units completing a process step. It is not how long the time is between each unit, but rather how frequently a new unit arrives after the previous one has exited the process step. Process exit cycles measure the flow of units through different stages of a process.
Automating TRRC T4 with FME and GeocortexSafe Software
Texas pipeline operators are required to submit operating permits called T4s to the Texas Railroad Commission (TRRC) annually. For any given operator, there could be anywhere between 50 to 100 permits that would require a GIS personnel to manually compare what was submitted and consideration for any changes to the assets since the last submission. Leveraging FME this effort can be made more efficient and accurate. Therefore enabling GIS staff to review FME outputs through a graphical interface such as a Geocortex HTML Viewer or webmap. The FME created package bundles the cover page, a paper map, and a digital export which is ready to be filed with the TRRC. This tool will help to cut down the processing time, deliver a consistent result each time, and allow the GIS staff to accomplish more in the same time period.
Improving predictability by managing flowPeter Pito
Improve predictability of software development. Focus on managing the flow by monitoring three key metrics: cycle time, throughput and work in progress. Visualise, analyse, act. Forecast using Monte Carlo simulations.
Building a modern monitoring environment is more than just using the latest awesome tools, collecting all of the data, displaying numerous graphs and knowing when things go wrong. A modern monitoring environment is more than tools and infrastructure. It's a service. A service you provide to your whole team: developers, operations, security, and the business. This talk is about how you can build monitoring environments (or extend your existing environment) that are customer-focussed rather than infrastructure focussed. We'll see how you can treat your needs and the needs of your organization as customer requirements and build monitoring that is consumable and configurable on demand.
Building a modern monitoring environment is more than just using the latest awesome tools, collecting all of the data, displaying numerous graphs and knowing when things go wrong. A modern monitoring environment is more than tools and infrastructure. It's a service. A service you provide to your whole team: developers, operations, security, and the business. This talk is about how you can build monitoring environments (or extend your existing environment) that are customer-focussed rather than infrastructure focussed. We'll see how you can treat your needs and the needs of your organization as customer requirements and build monitoring that is consumable and configurable on demand.
Estimates are always wrong. Why?
Is estimating software engineering tasks an art? Is it a science? When can we be really certain that an estimate is correct?
Is this a black-and-white right-or-wrong situation? Or is there more to it?
Sometimes reviewing resumes and CVs can be so much fun. This presentation is powered by Prime-resume.com. It contains excerpts from real resumes and CVs that people used to apply for jobs.
Operation “Blue Star” is the only event in the history of Independent India where the state went into war with its own people. Even after about 40 years it is not clear if it was culmination of states anger over people of the region, a political game of power or start of dictatorial chapter in the democratic setup.
The people of Punjab felt alienated from main stream due to denial of their just demands during a long democratic struggle since independence. As it happen all over the word, it led to militant struggle with great loss of lives of military, police and civilian personnel. Killing of Indira Gandhi and massacre of innocent Sikhs in Delhi and other India cities was also associated with this movement.
Instructions for Submissions thorugh G- Classroom.pptxJheel Barad
This presentation provides a briefing on how to upload submissions and documents in Google Classroom. It was prepared as part of an orientation for new Sainik School in-service teacher trainees. As a training officer, my goal is to ensure that you are comfortable and proficient with this essential tool for managing assignments and fostering student engagement.
How to Make a Field invisible in Odoo 17Celine George
It is possible to hide or invisible some fields in odoo. Commonly using “invisible” attribute in the field definition to invisible the fields. This slide will show how to make a field invisible in odoo 17.
The French Revolution, which began in 1789, was a period of radical social and political upheaval in France. It marked the decline of absolute monarchies, the rise of secular and democratic republics, and the eventual rise of Napoleon Bonaparte. This revolutionary period is crucial in understanding the transition from feudalism to modernity in Europe.
For more information, visit-www.vavaclasses.com
Read| The latest issue of The Challenger is here! We are thrilled to announce that our school paper has qualified for the NATIONAL SCHOOLS PRESS CONFERENCE (NSPC) 2024. Thank you for your unwavering support and trust. Dive into the stories that made us stand out!
Macroeconomics- Movie Location
This will be used as part of your Personal Professional Portfolio once graded.
Objective:
Prepare a presentation or a paper using research, basic comparative analysis, data organization and application of economic information. You will make an informed assessment of an economic climate outside of the United States to accomplish an entertainment industry objective.
Palestine last event orientationfvgnh .pptxRaedMohamed3
An EFL lesson about the current events in Palestine. It is intended to be for intermediate students who wish to increase their listening skills through a short lesson in power point.
Welcome to TechSoup New Member Orientation and Q&A (May 2024).pdfTechSoup
In this webinar you will learn how your organization can access TechSoup's wide variety of product discount and donation programs. From hardware to software, we'll give you a tour of the tools available to help your nonprofit with productivity, collaboration, financial management, donor tracking, security, and more.
Remind them that a stopwatch will be needed for this activity.
Emphasize the time it takes from piece to piece and not anything else. First watch the process to pick out the exit point you will measure. Keep the stopwatch running continually, then hit the lap button each time a unit passes the exit of the workstation or the line. From lap time to lap time is your exit cycle time.
Stress that while they take times OR observations that it is important to make notes about the facts they observe.