Download as PDF, PPTX

![© Rajesh Viswanathan
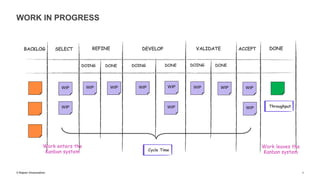
SAMPLE USE OF CFD
7
What to look for? Comments
Mismatched arrivals & departures → Indication of an unstable system.
Flat Lines over long periods of time → Indication of zero arrivals / departures.
→ No value is delivered to customer / downstream step.
→ External dependencies.
Stair steps → Indication of cadence based process such Scrum.
→ Batch transfers (due to regular cadence or not).
Bulging Bands → Explosion of WIP. May be a push from upstream or block in downstream.
Disappearing Bands → Indication of upstream variability.
→ Frequent skipping of some workflow steps.
S Curve → Inefficiency in workflow & less predictable process.
State wise cycle times → “Conditioning flow” [Items to be worked are selected based on the best chances of
success they might have.]
Balanced process → The top & bottom lines on the CFD become parallel.
Flow debt → Artificially reducing the cycle time of some work items.
Violation of Little Law’s
assumptions
→ Any violations make a process unstable & unpredictable.
Purpose of analyzing CFD is to learn, so ask questions.](https://image.slidesharecdn.com/actionableagilemetrics-190617141628/85/Actionable-Agile-Metrics-7-320.jpg)
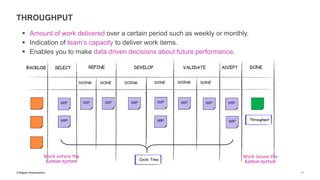


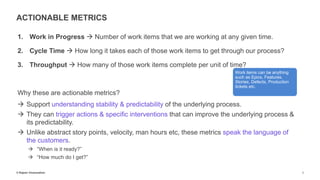
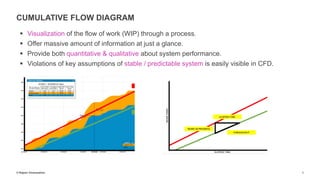
This document discusses actionable agile metrics including work in progress, cycle time, and throughput. It defines each metric and explains why they are useful for understanding process stability, predictability, and improvements. Visualizations like cumulative flow diagrams and scatter plots of cycle times can help teams identify patterns and anomalies to investigate. Analyzing metrics over time through run charts also supports monitoring trends and capacity planning. The key message is that these quantitative metrics can trigger process improvements when used to learn rather than assess teams.


![[Talk] Manage flow - Metrics and Analytics for predictability and flow](https://cdn.slidesharecdn.com/ss_thumbnails/lkna-manageflow-metricsandanalyticsforpredictabilityandflow-190527041051-thumbnail.jpg?width=640&height=640&fit=bounds)


