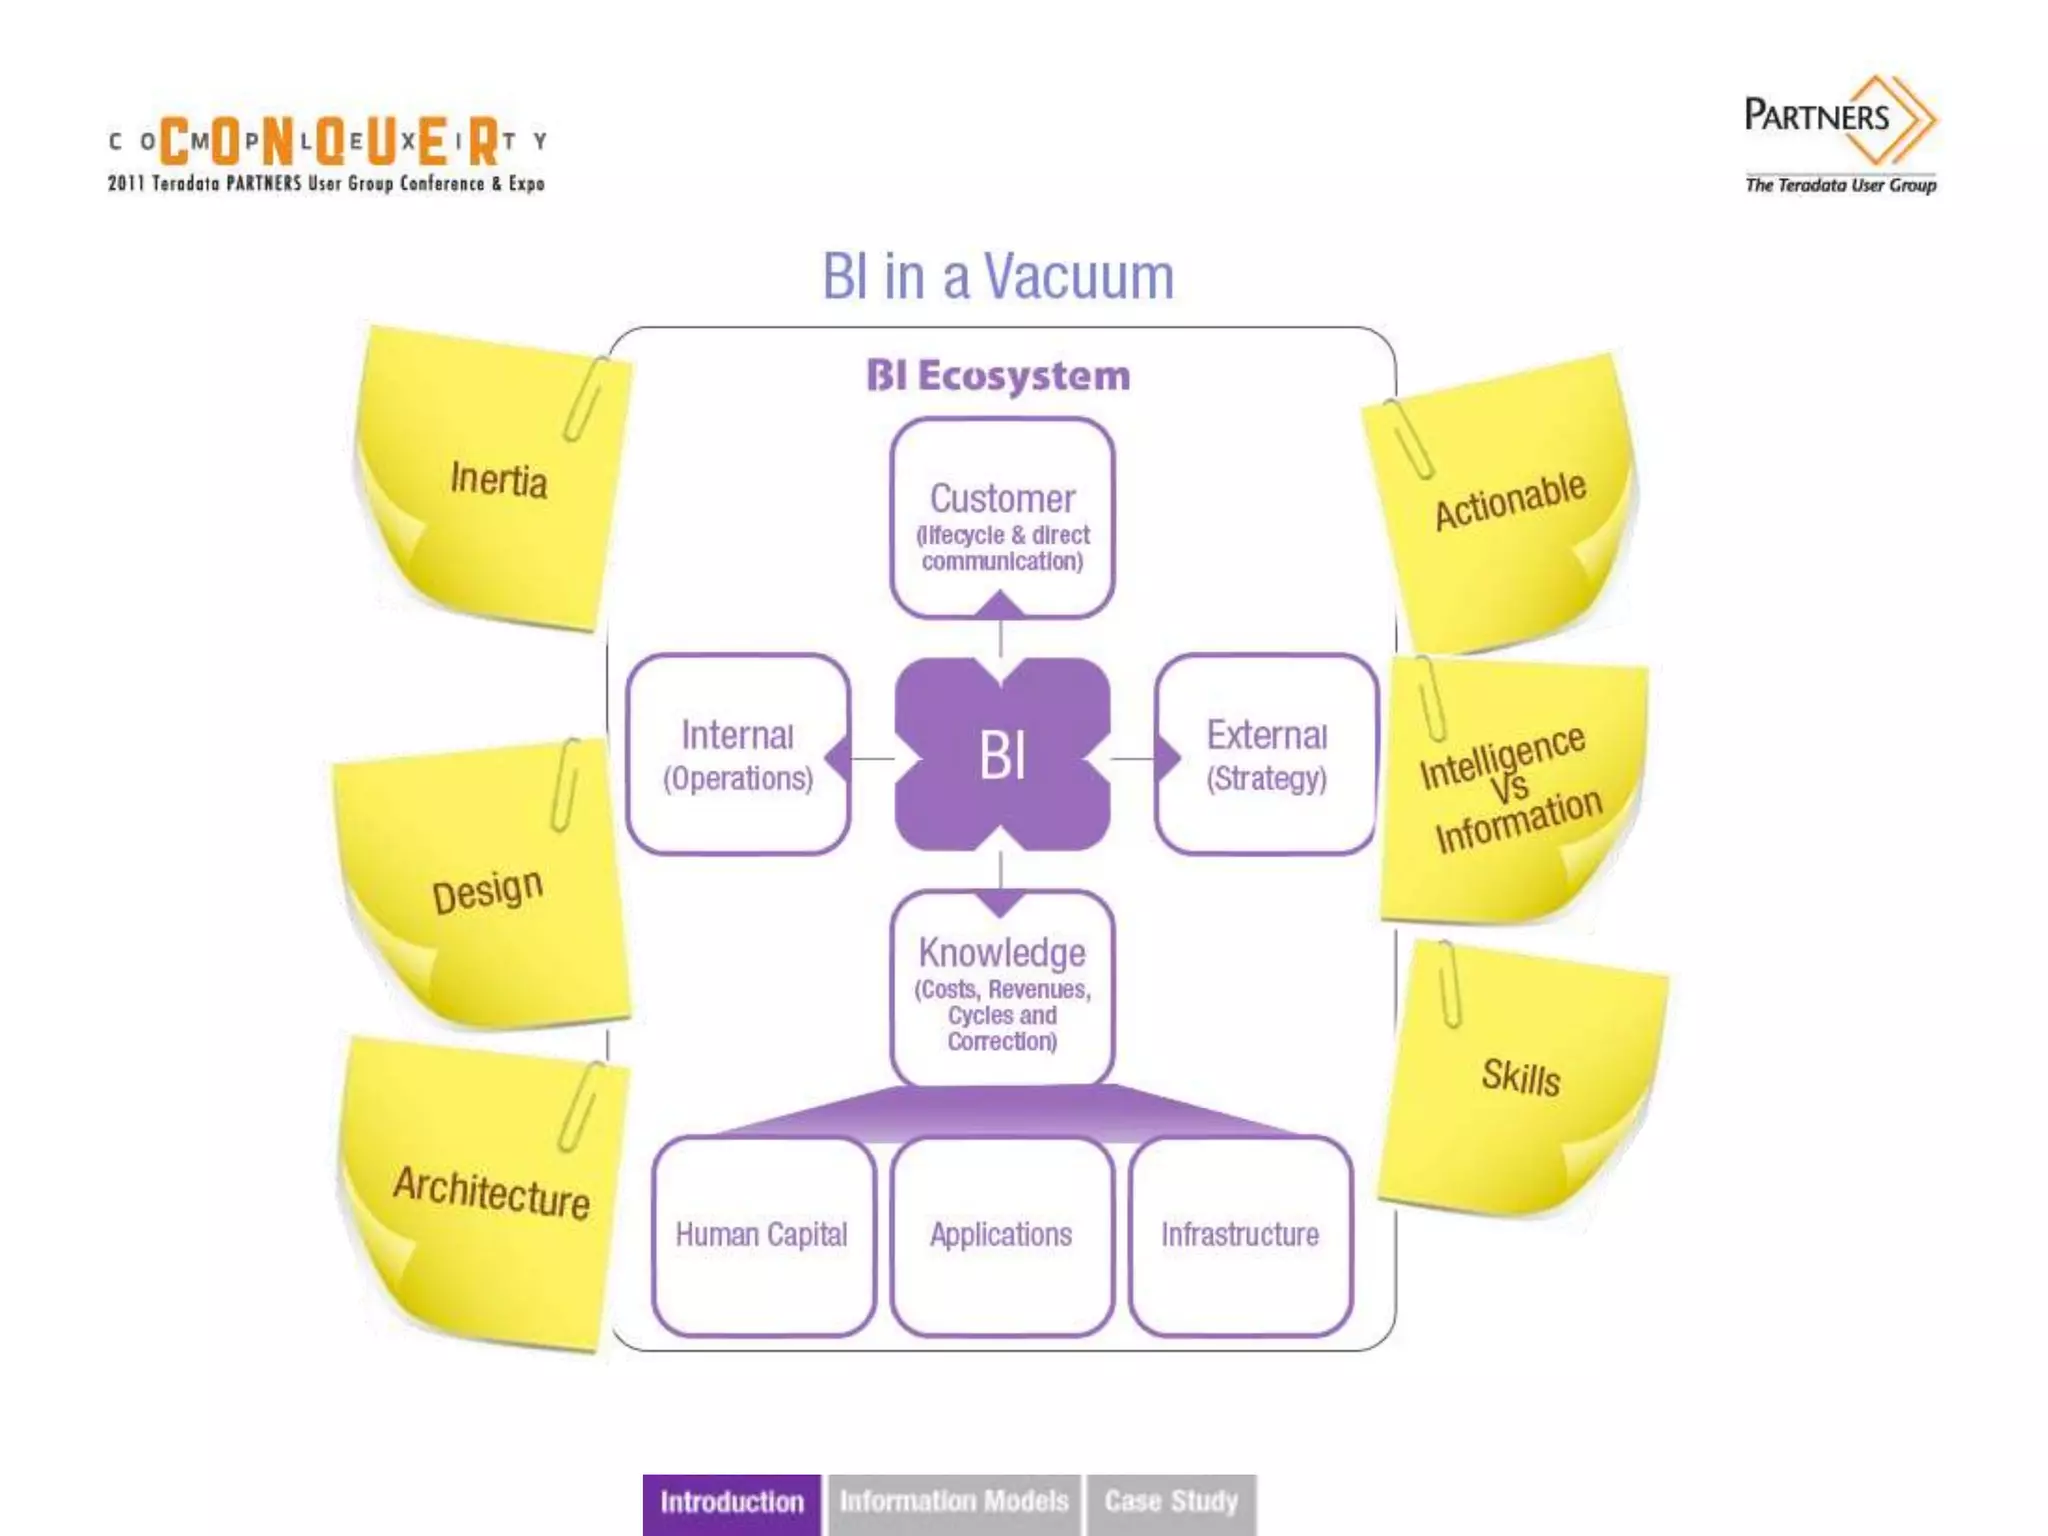
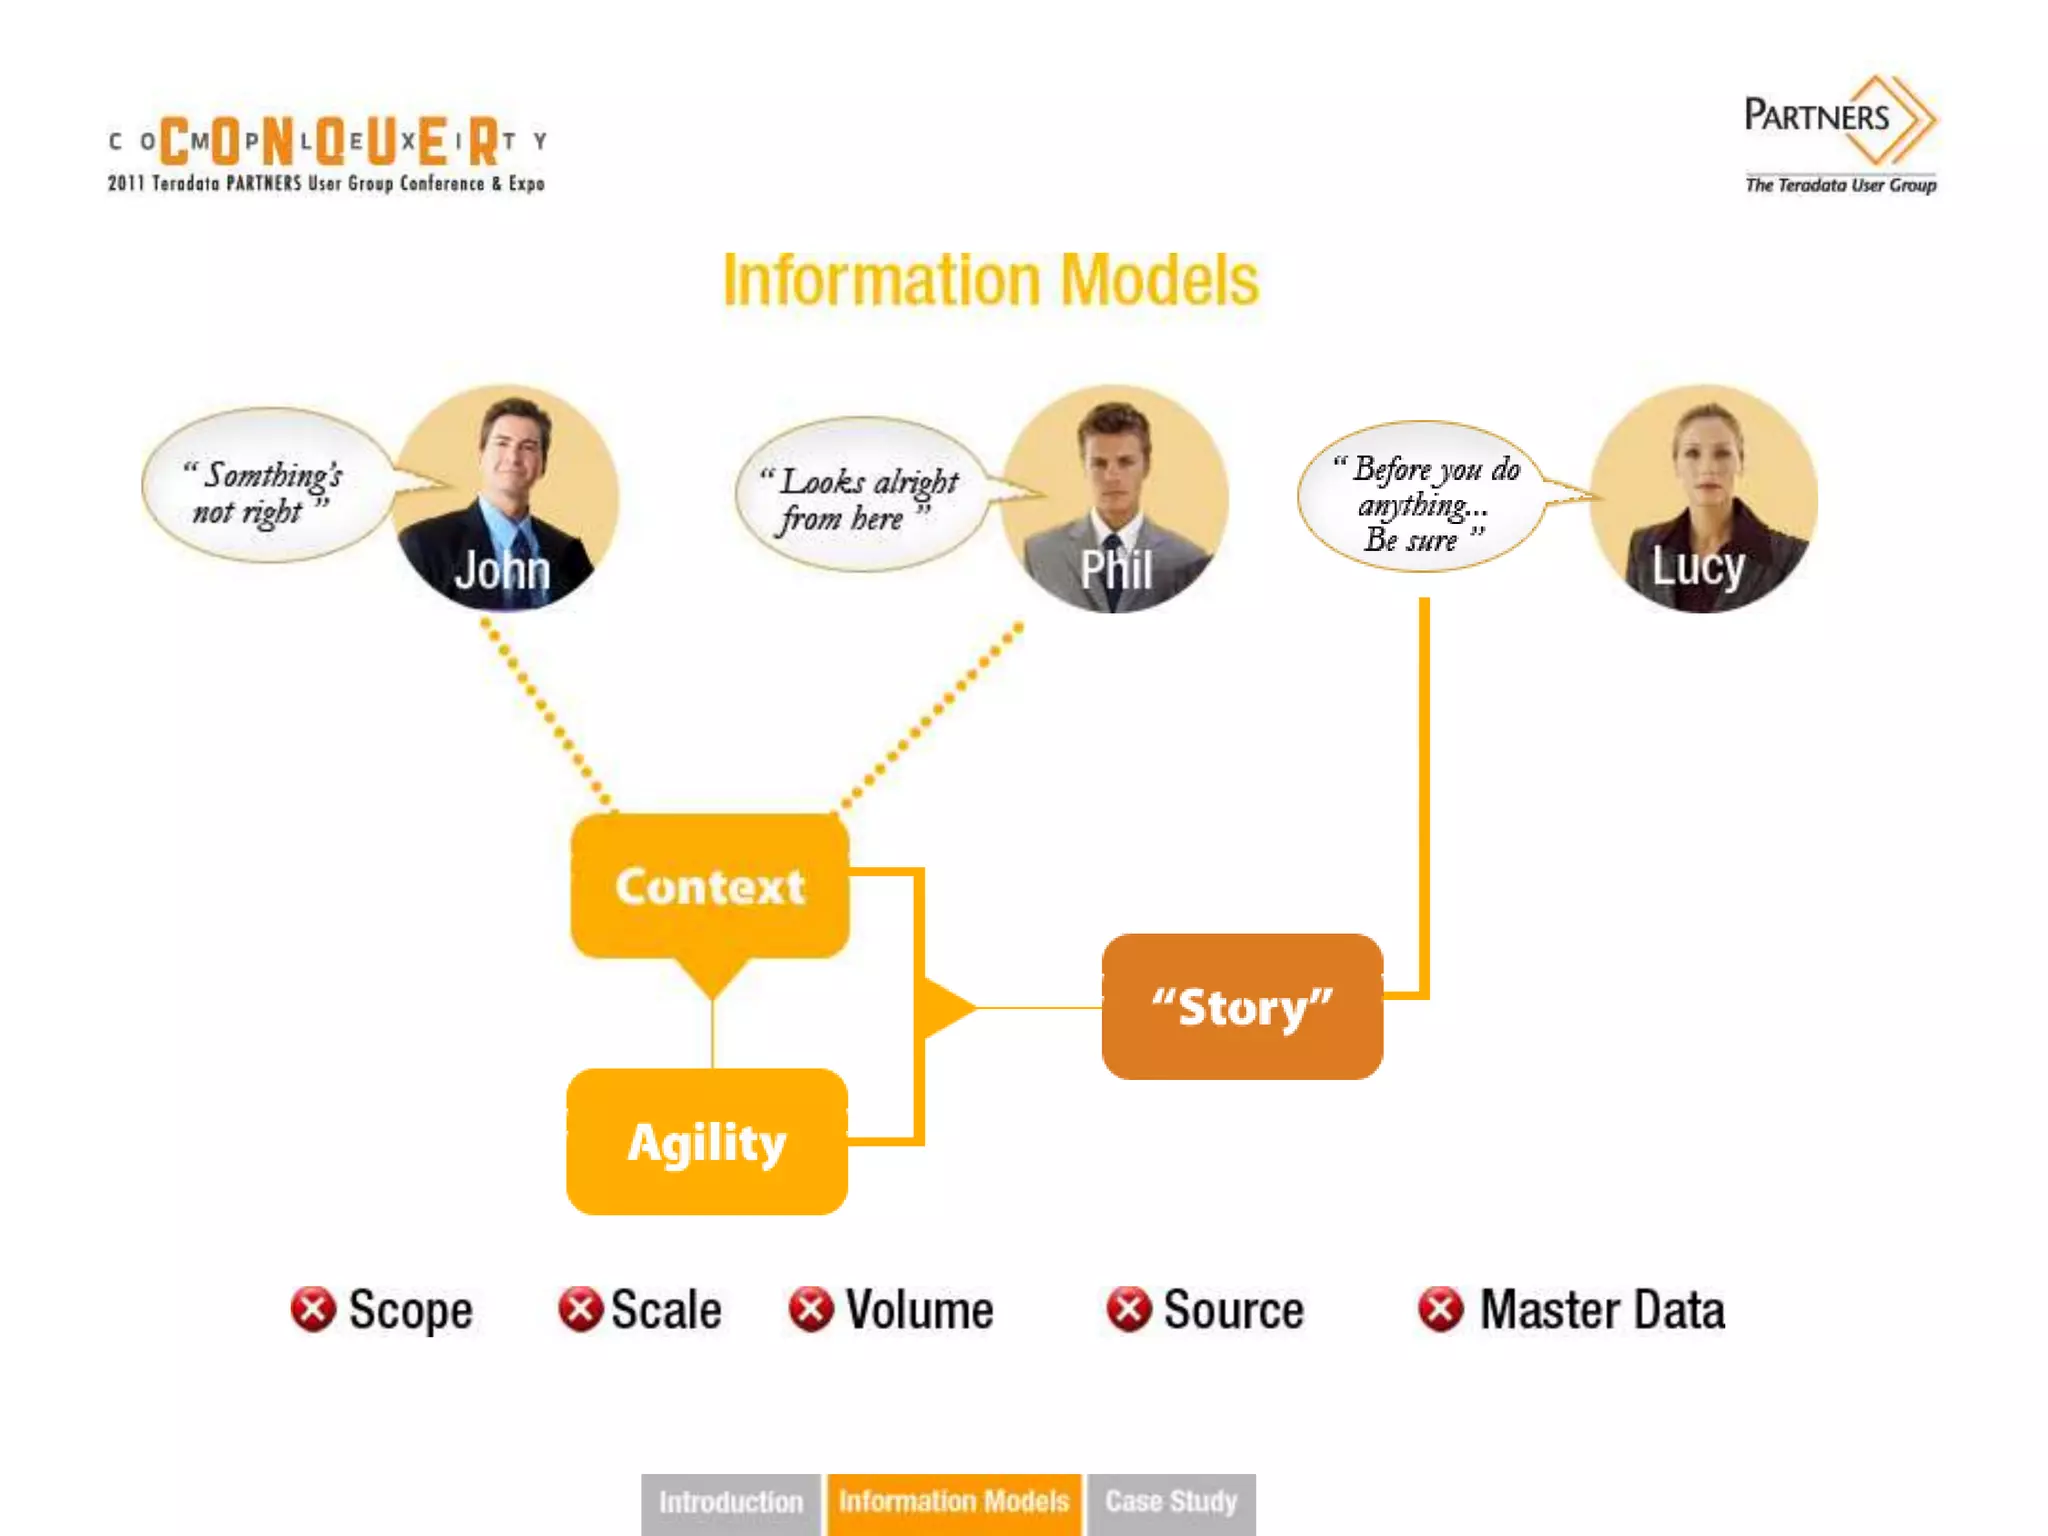
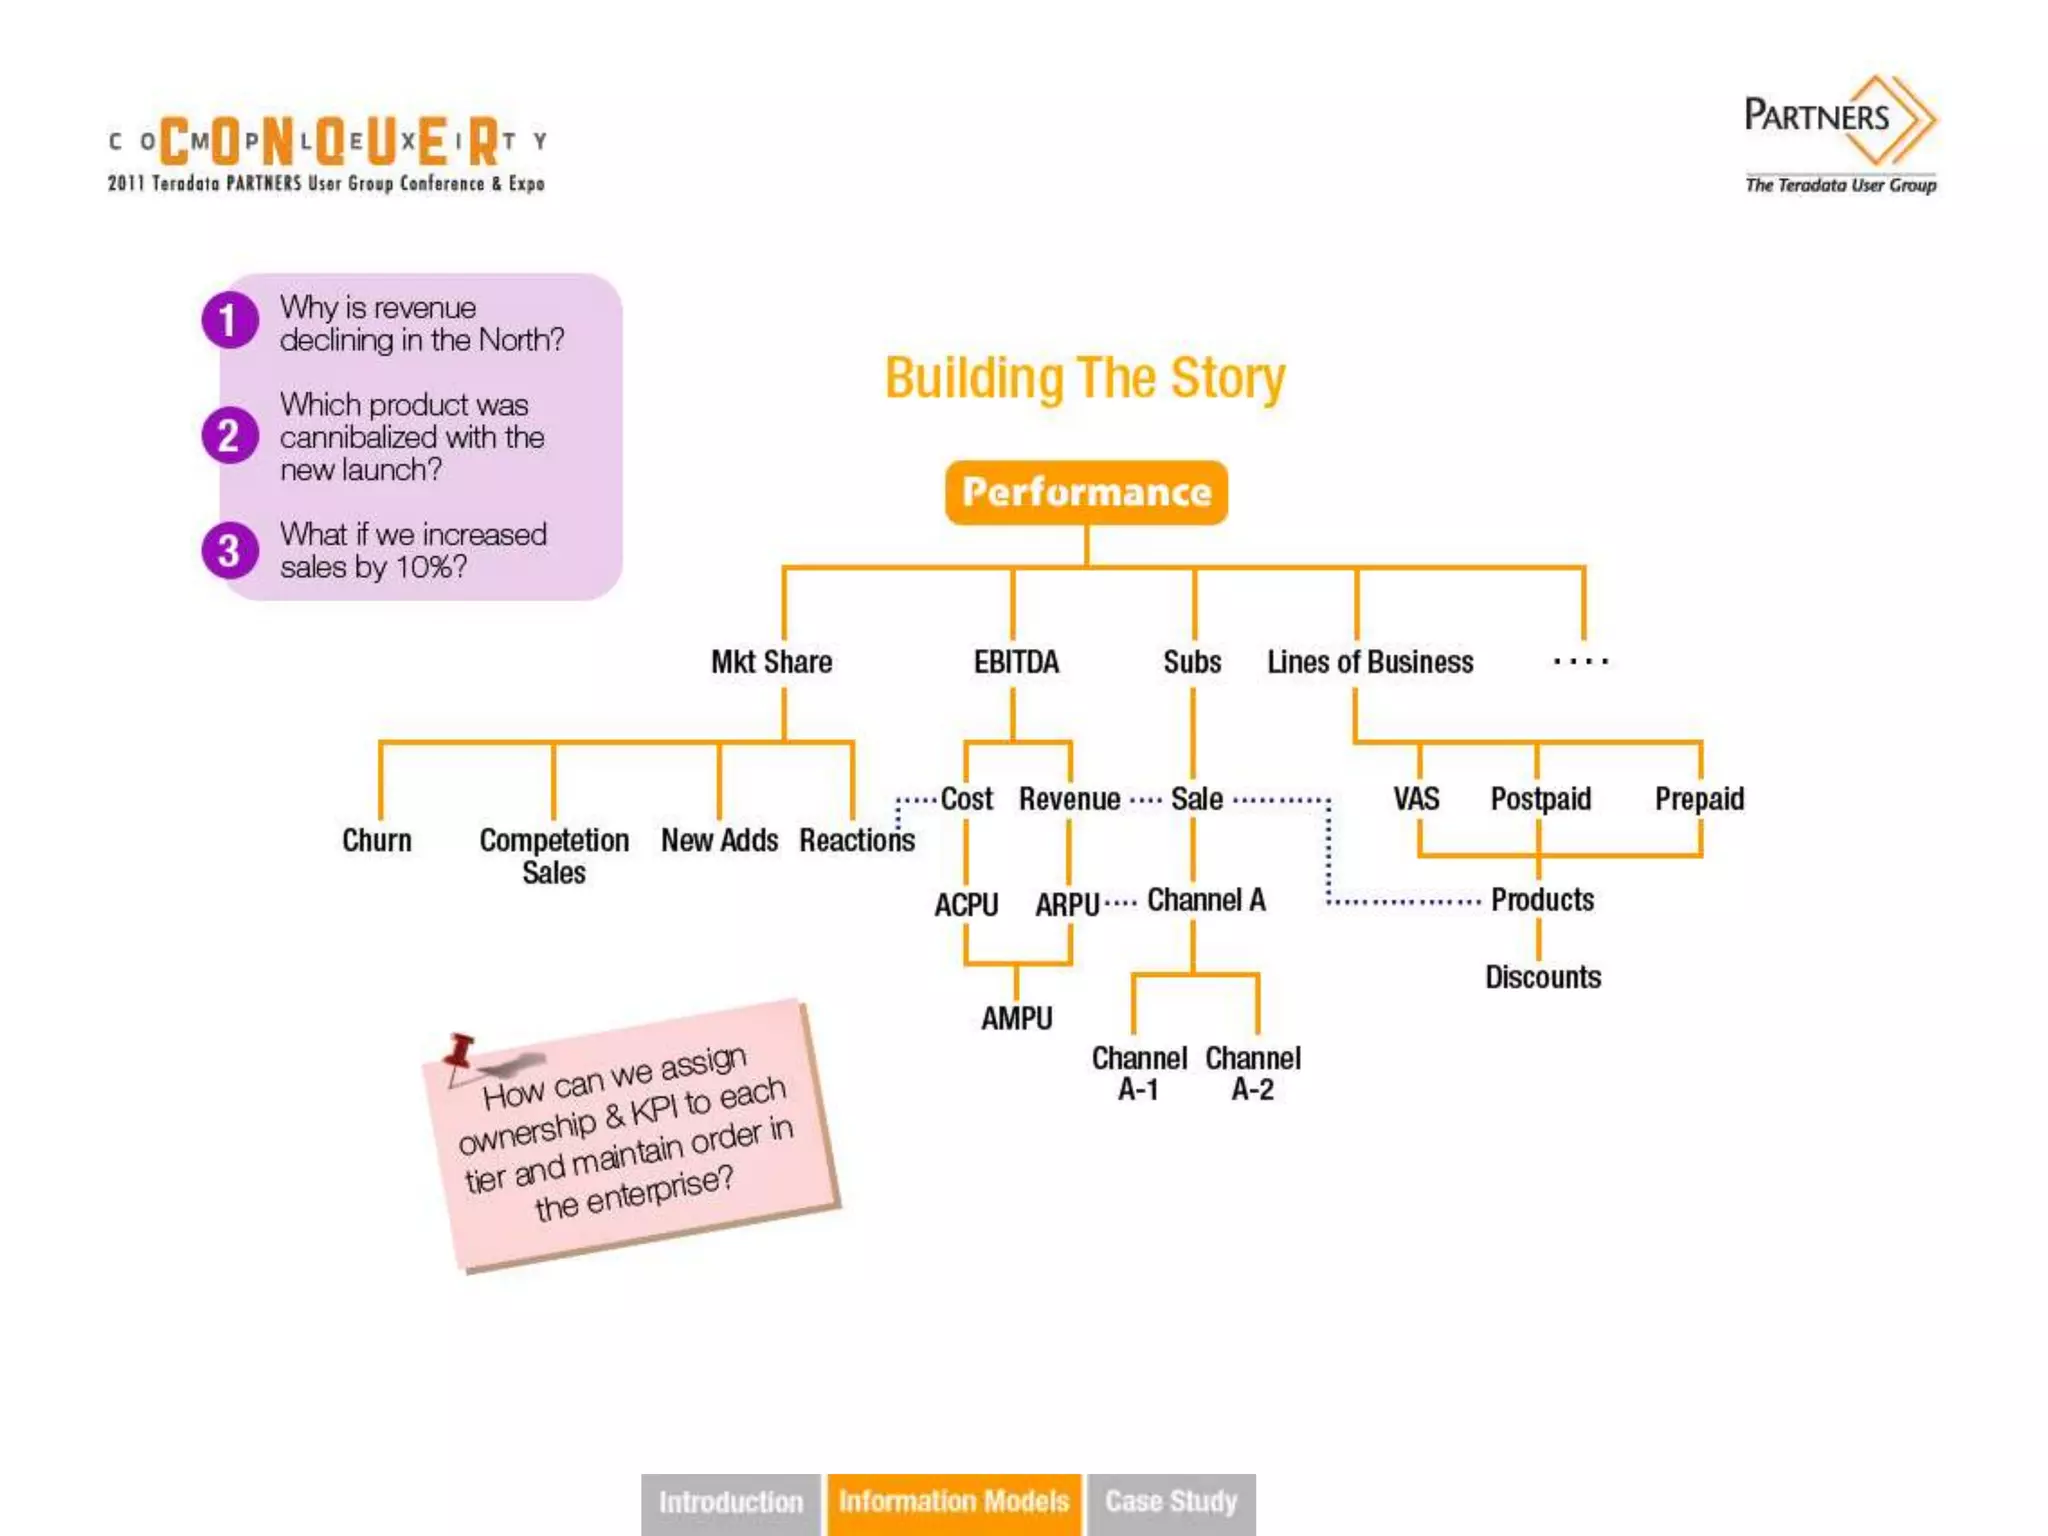
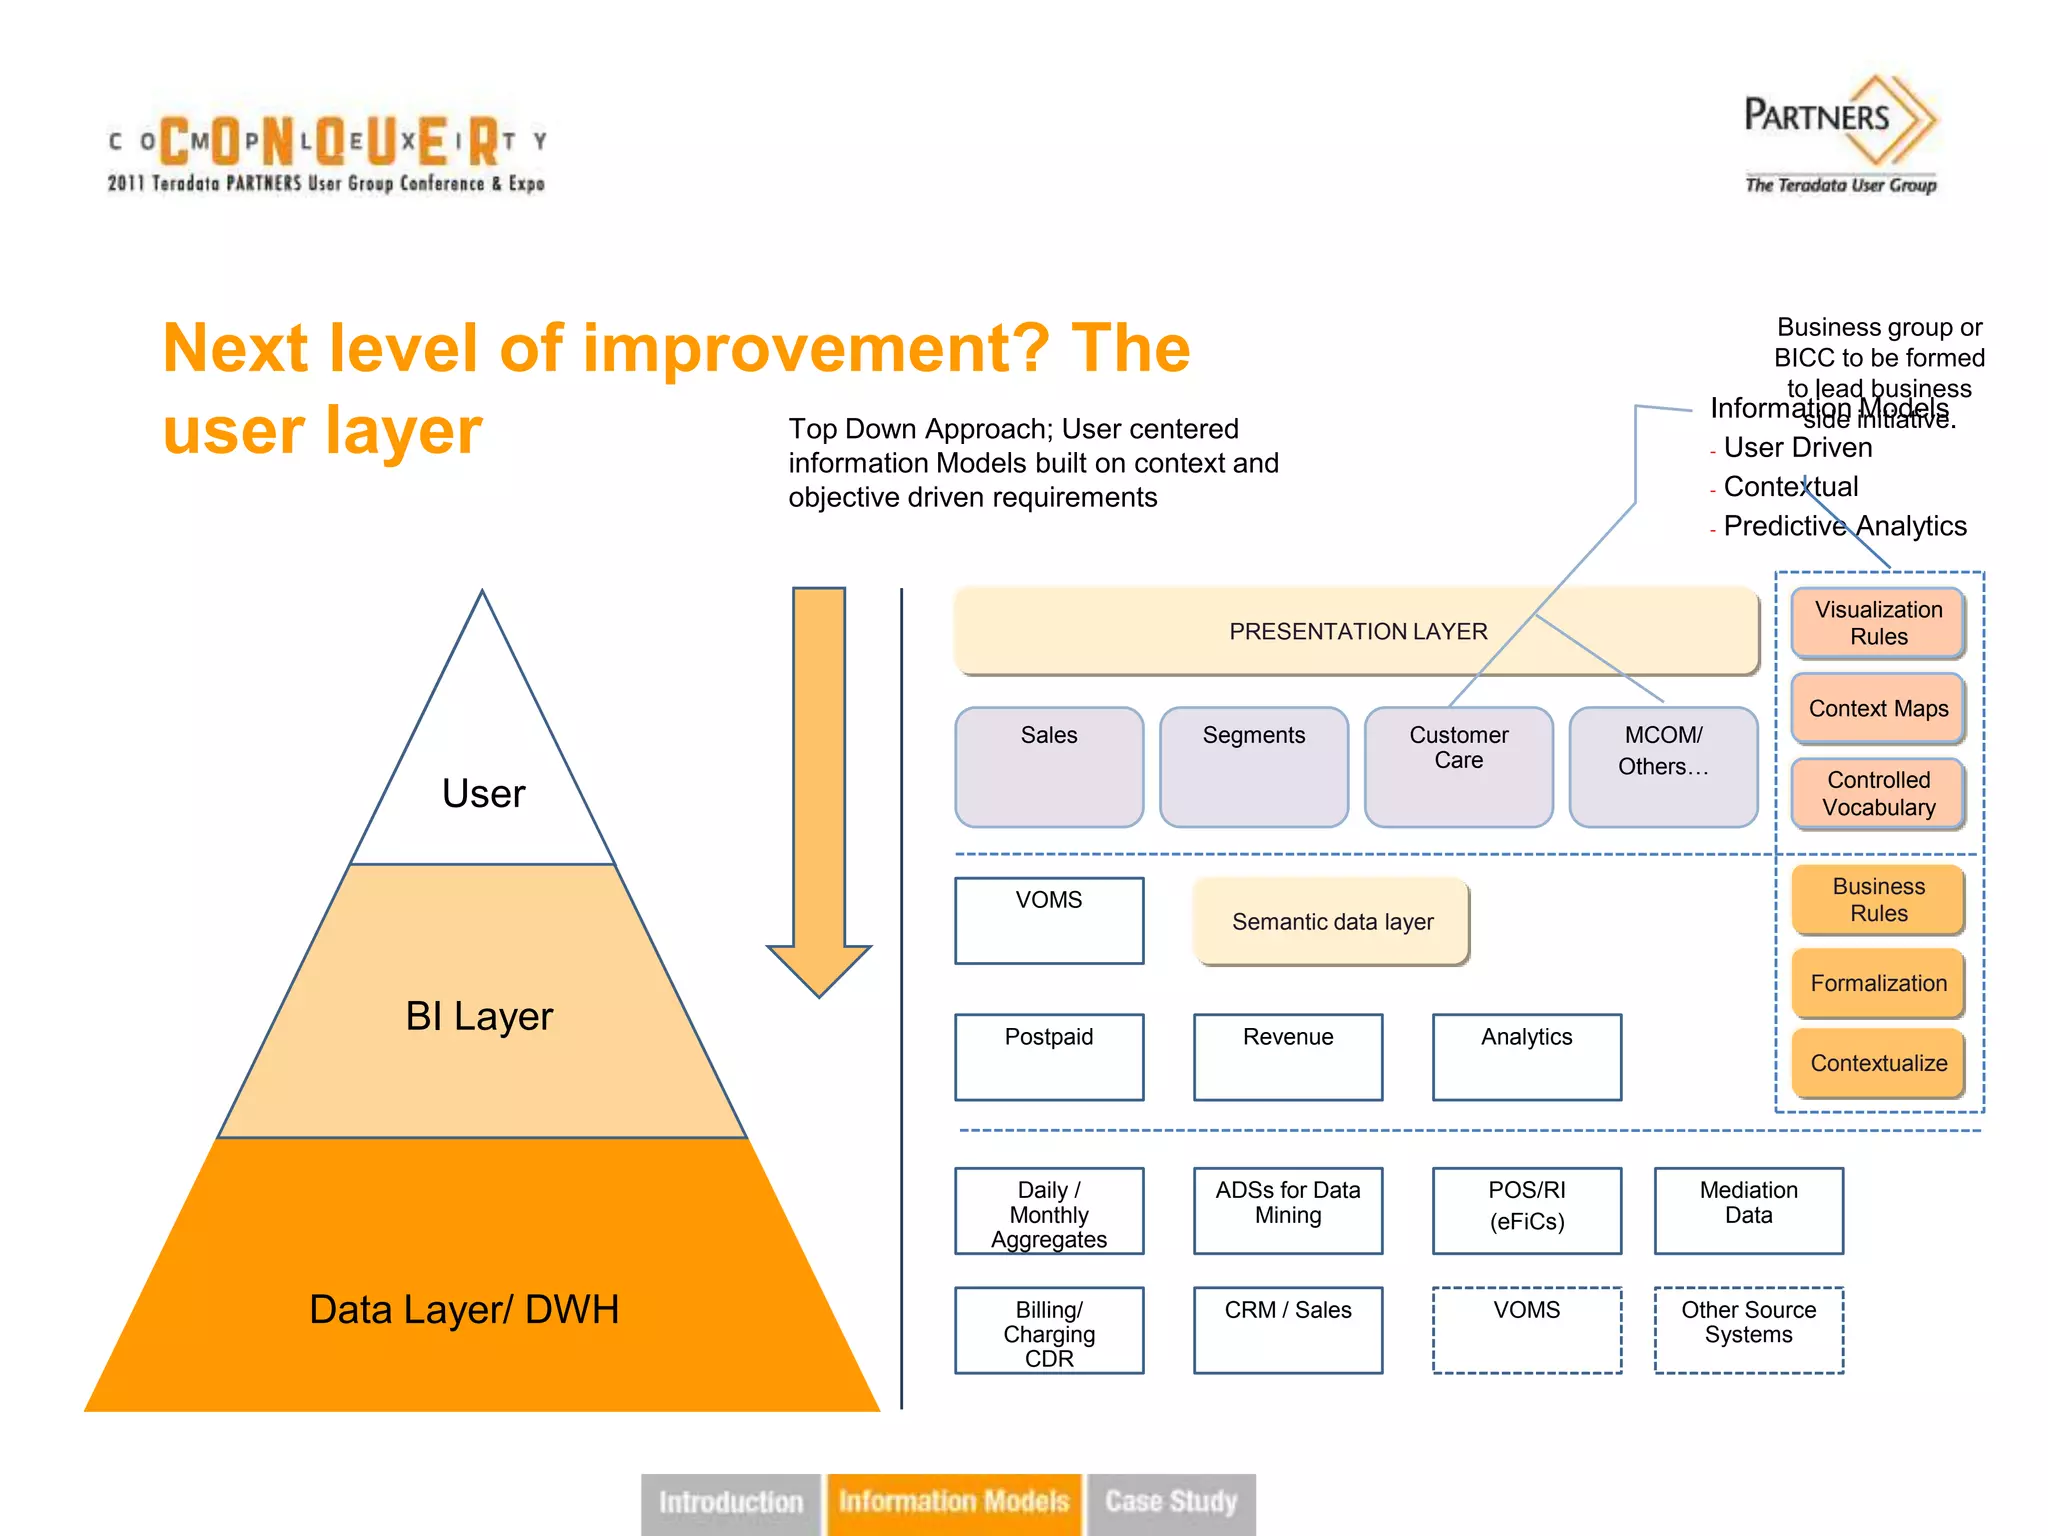
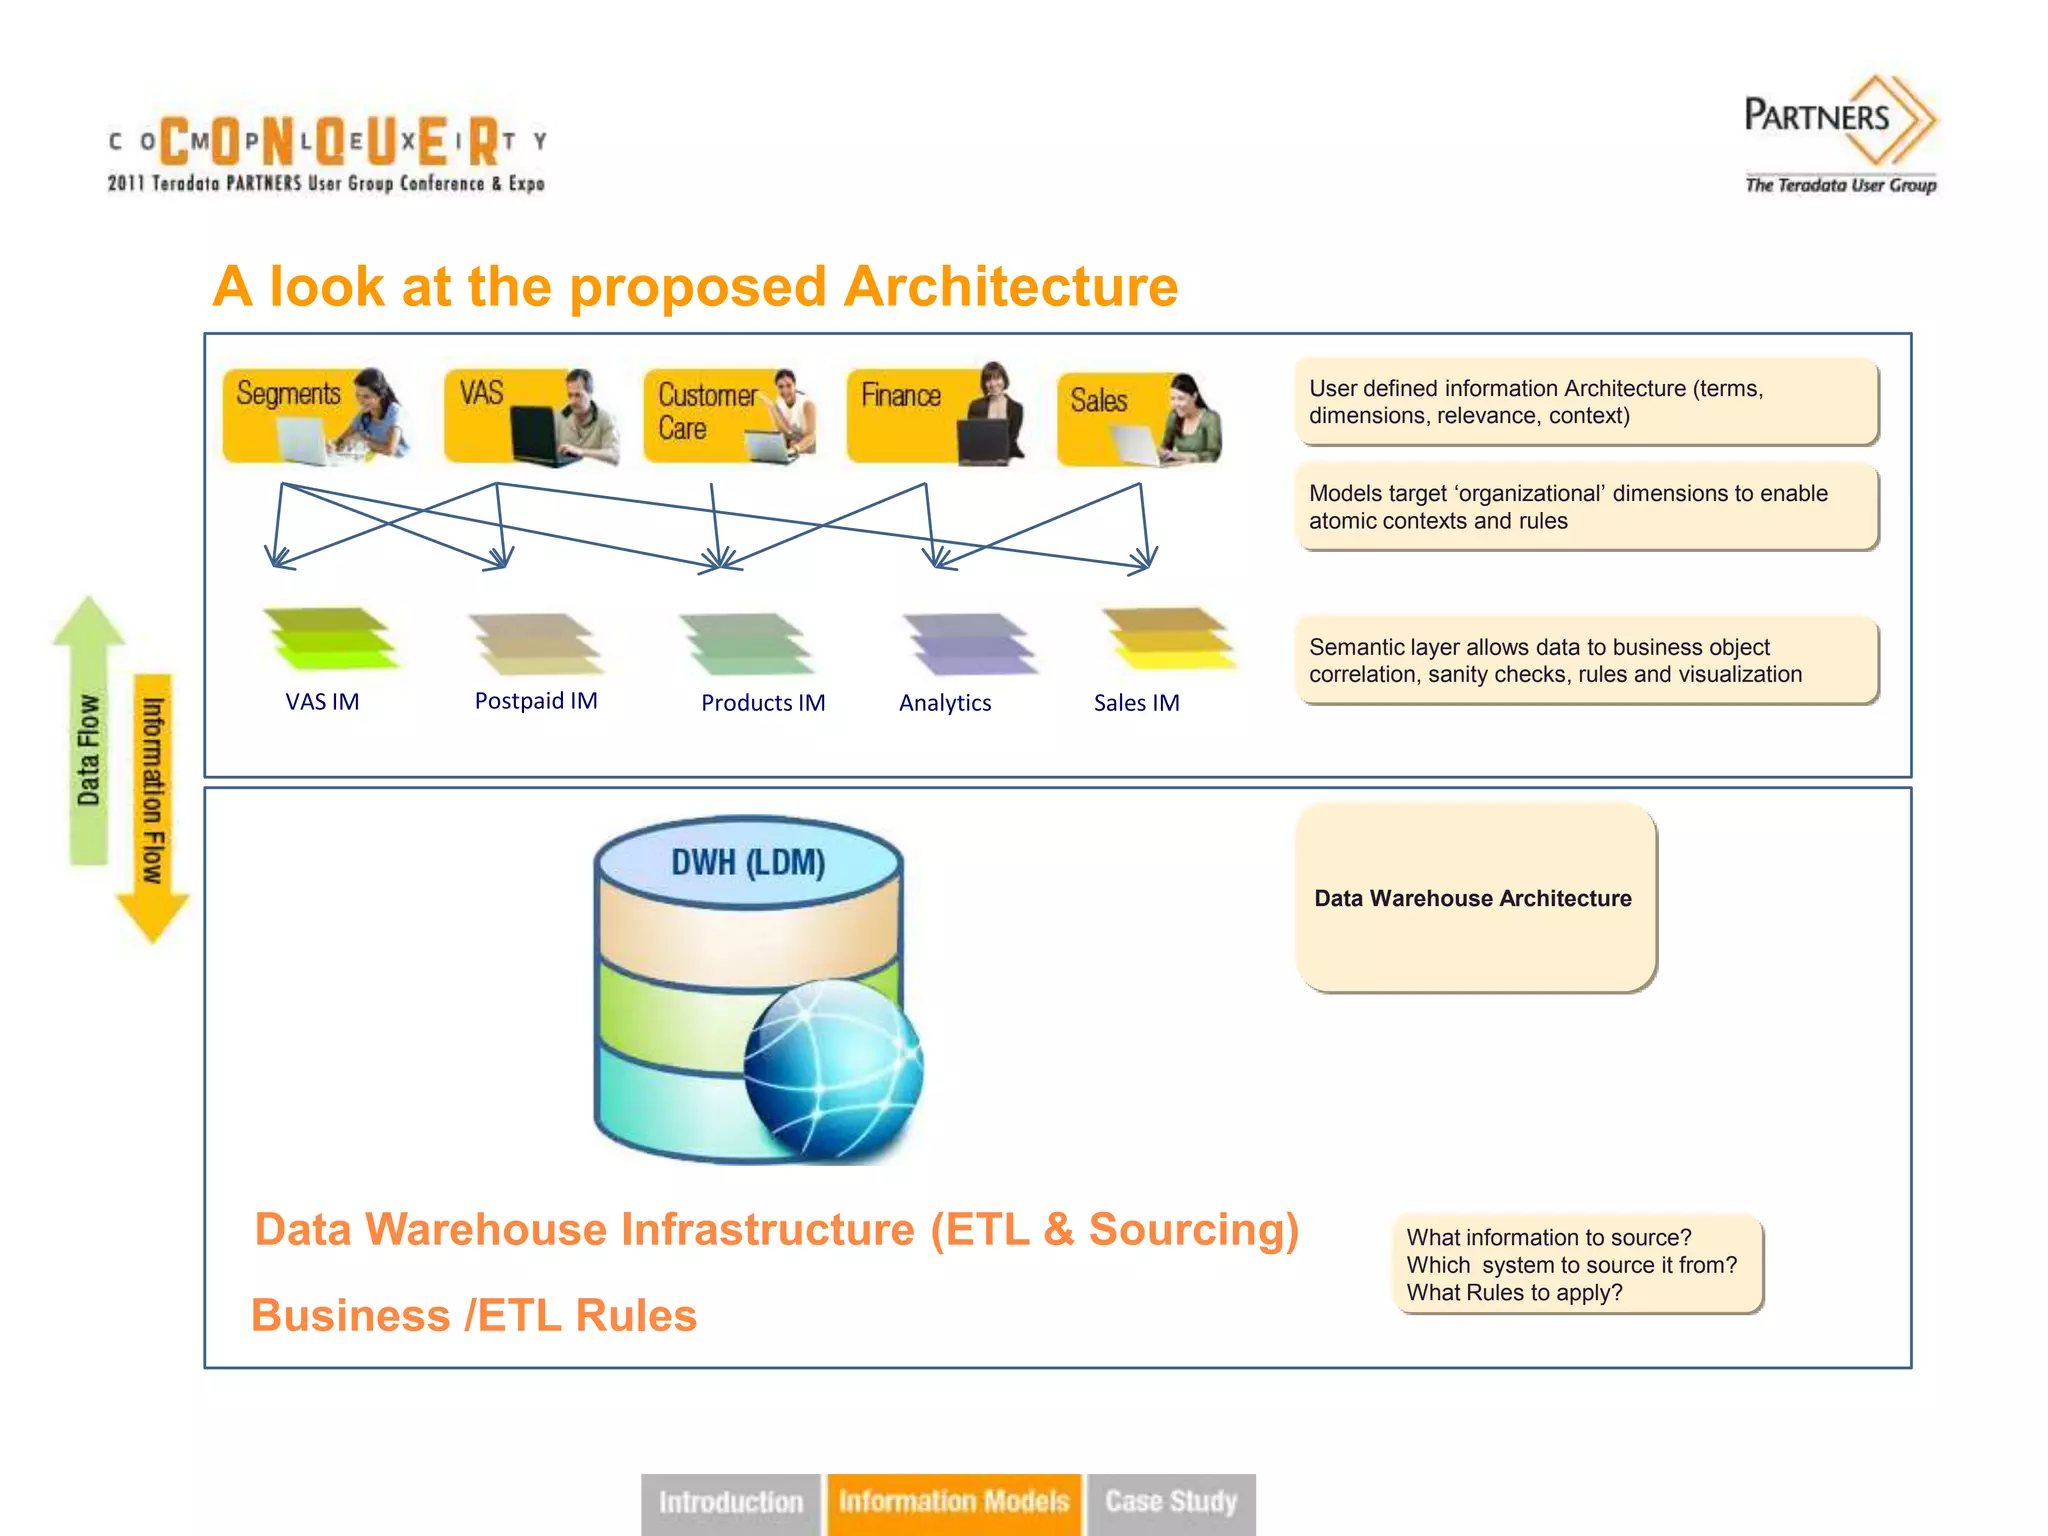
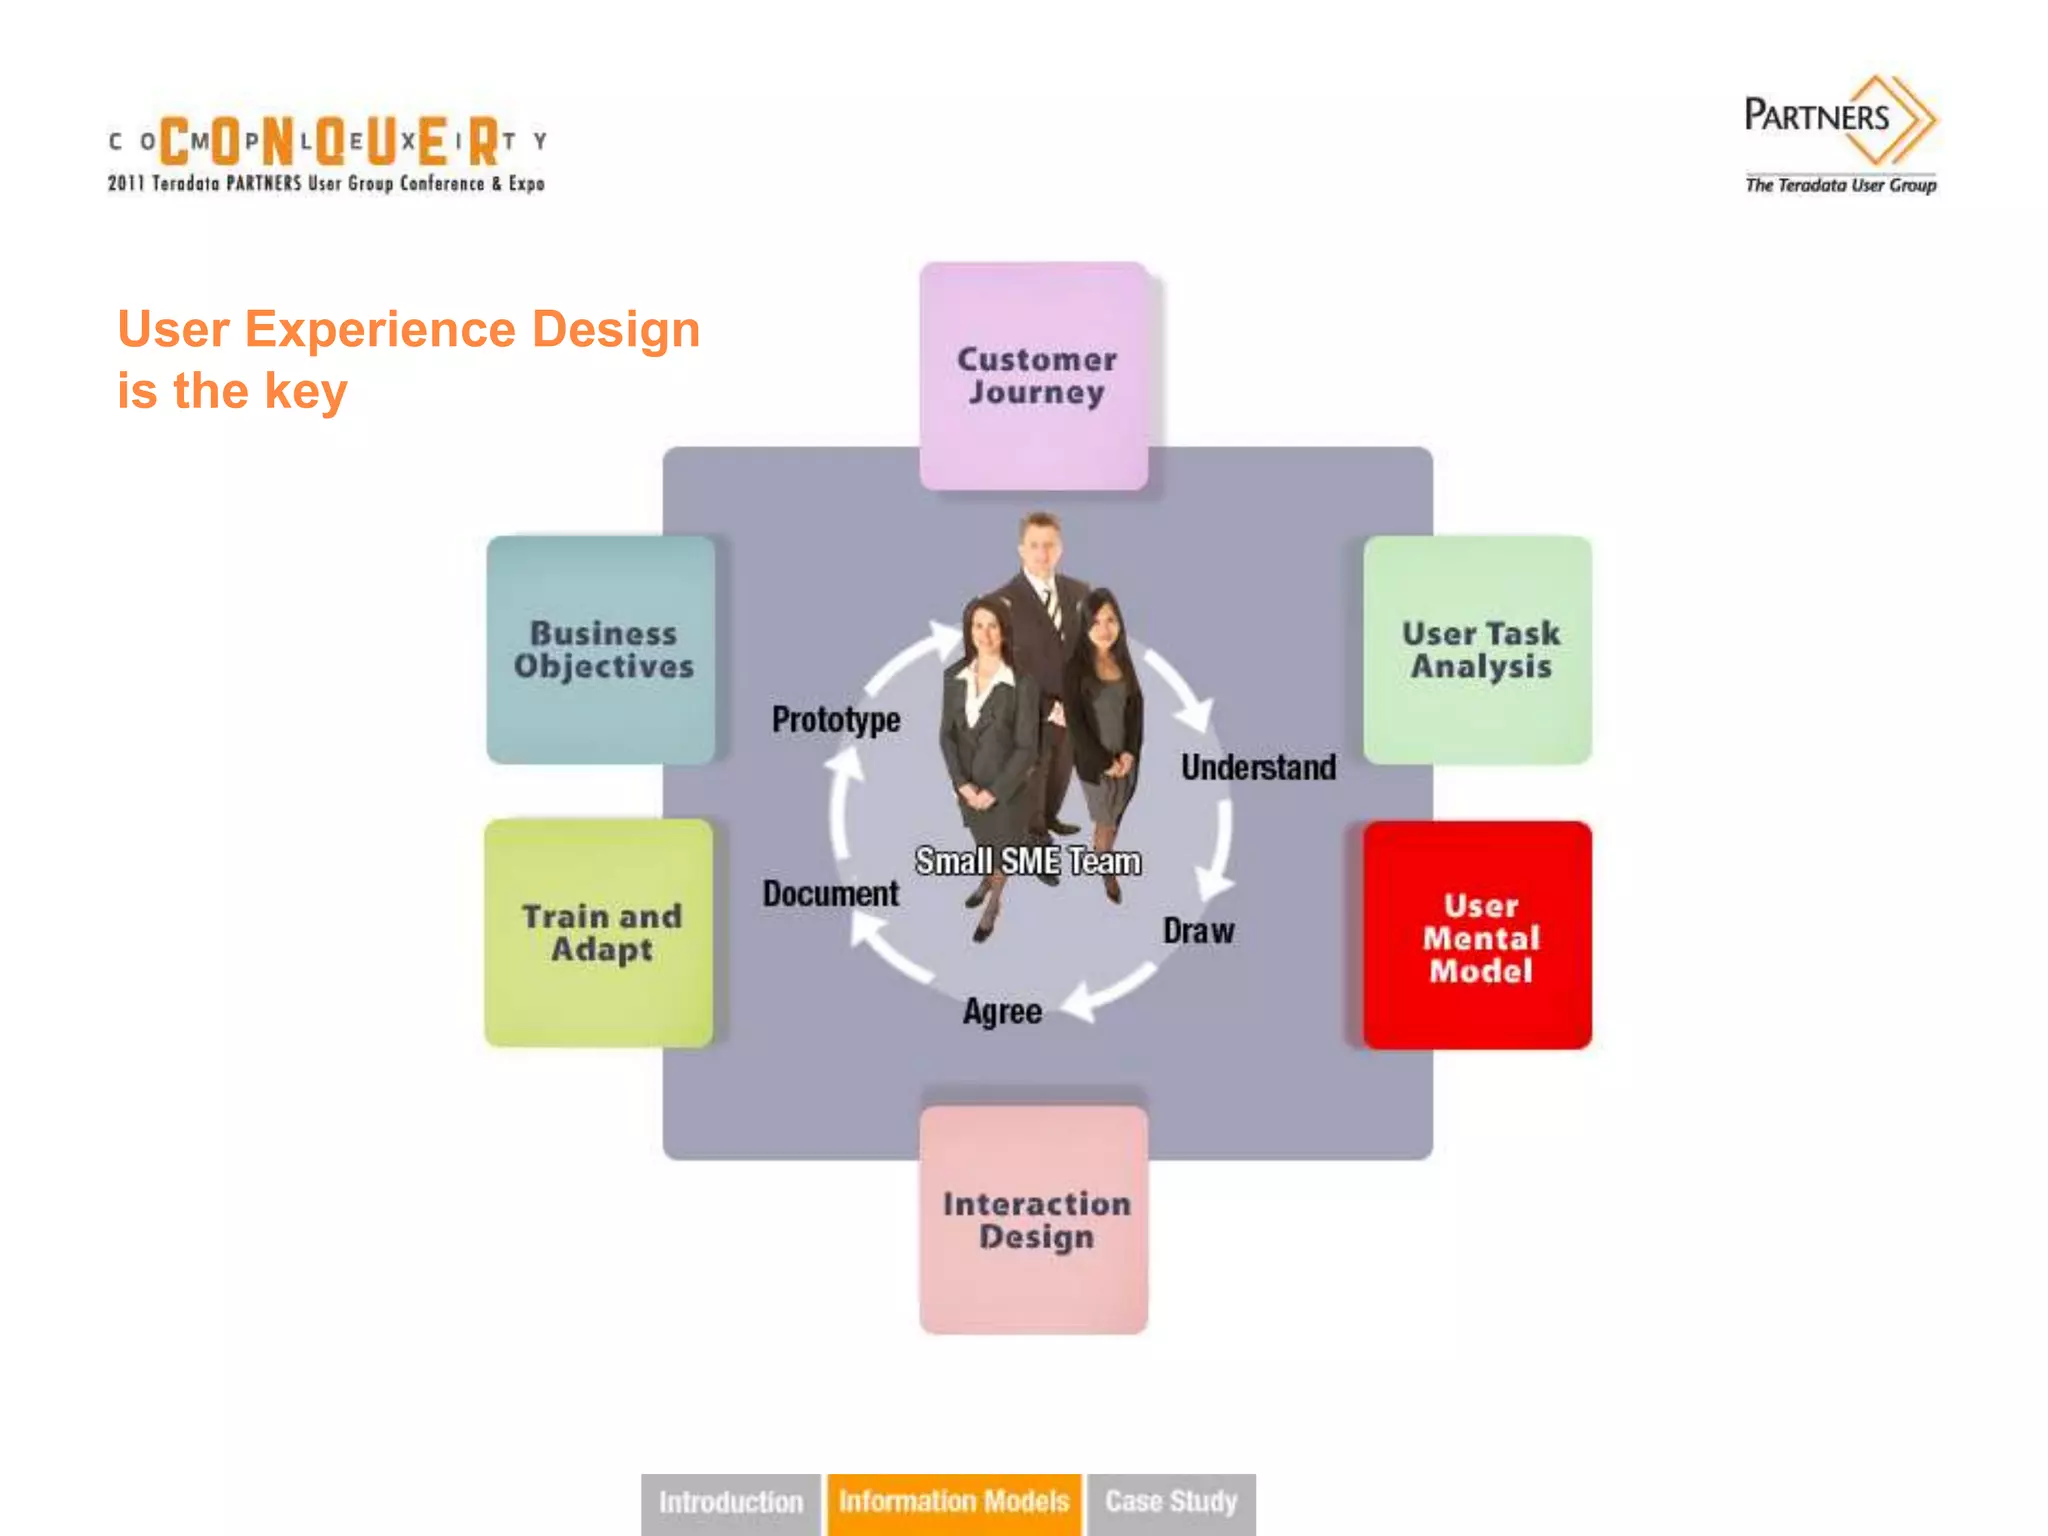
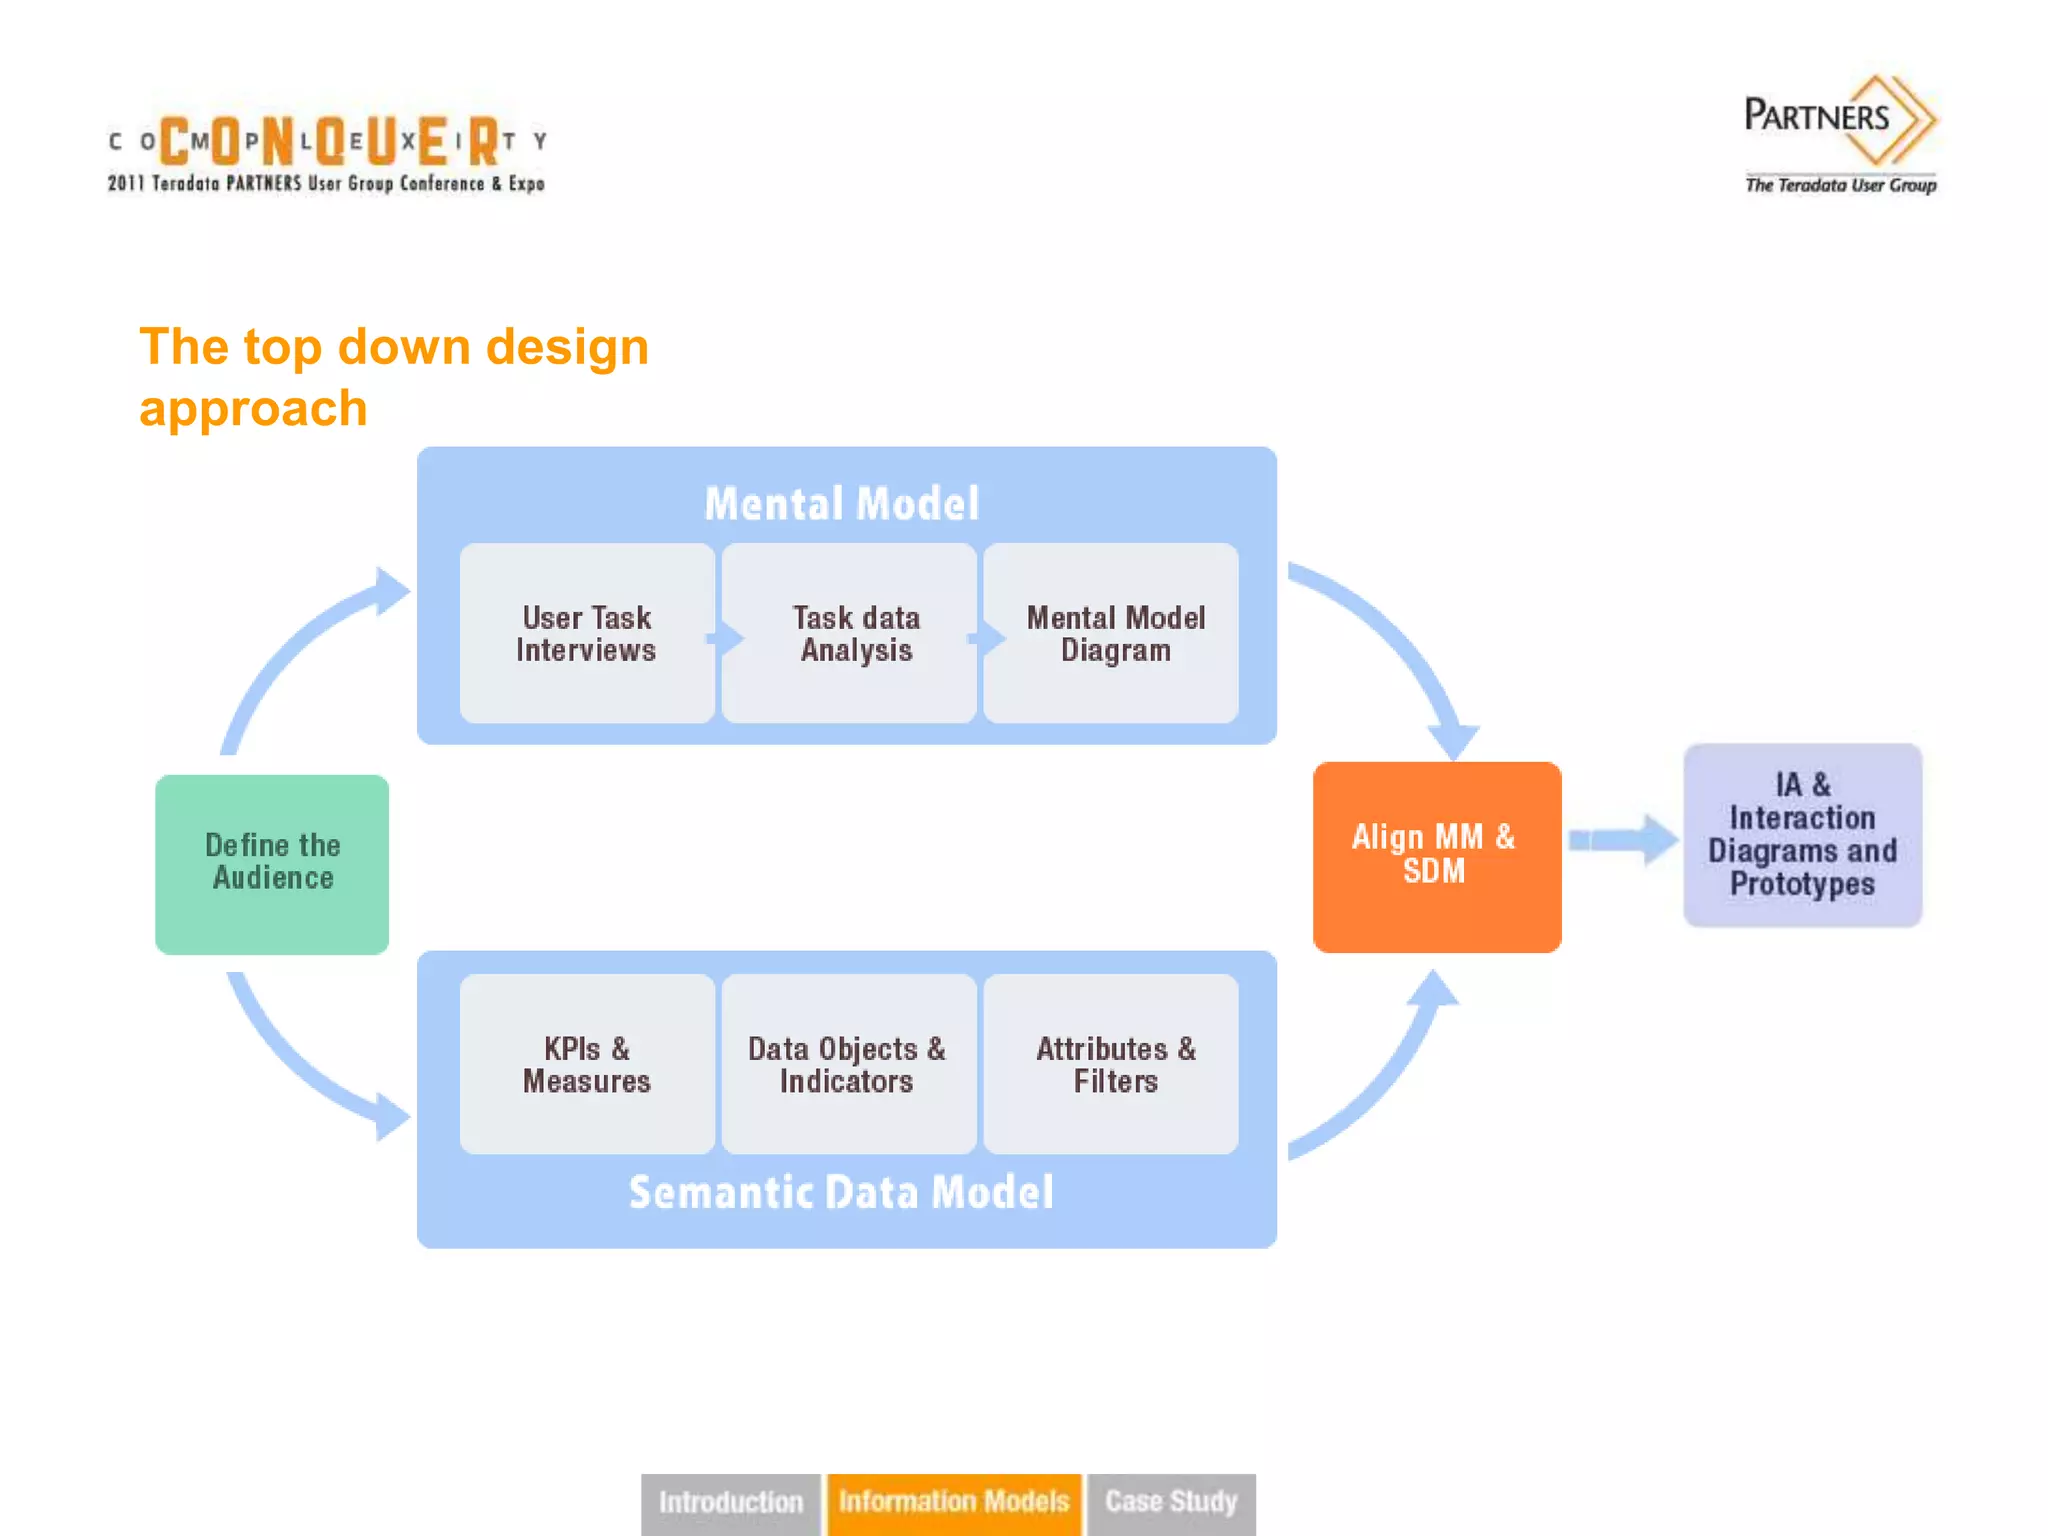
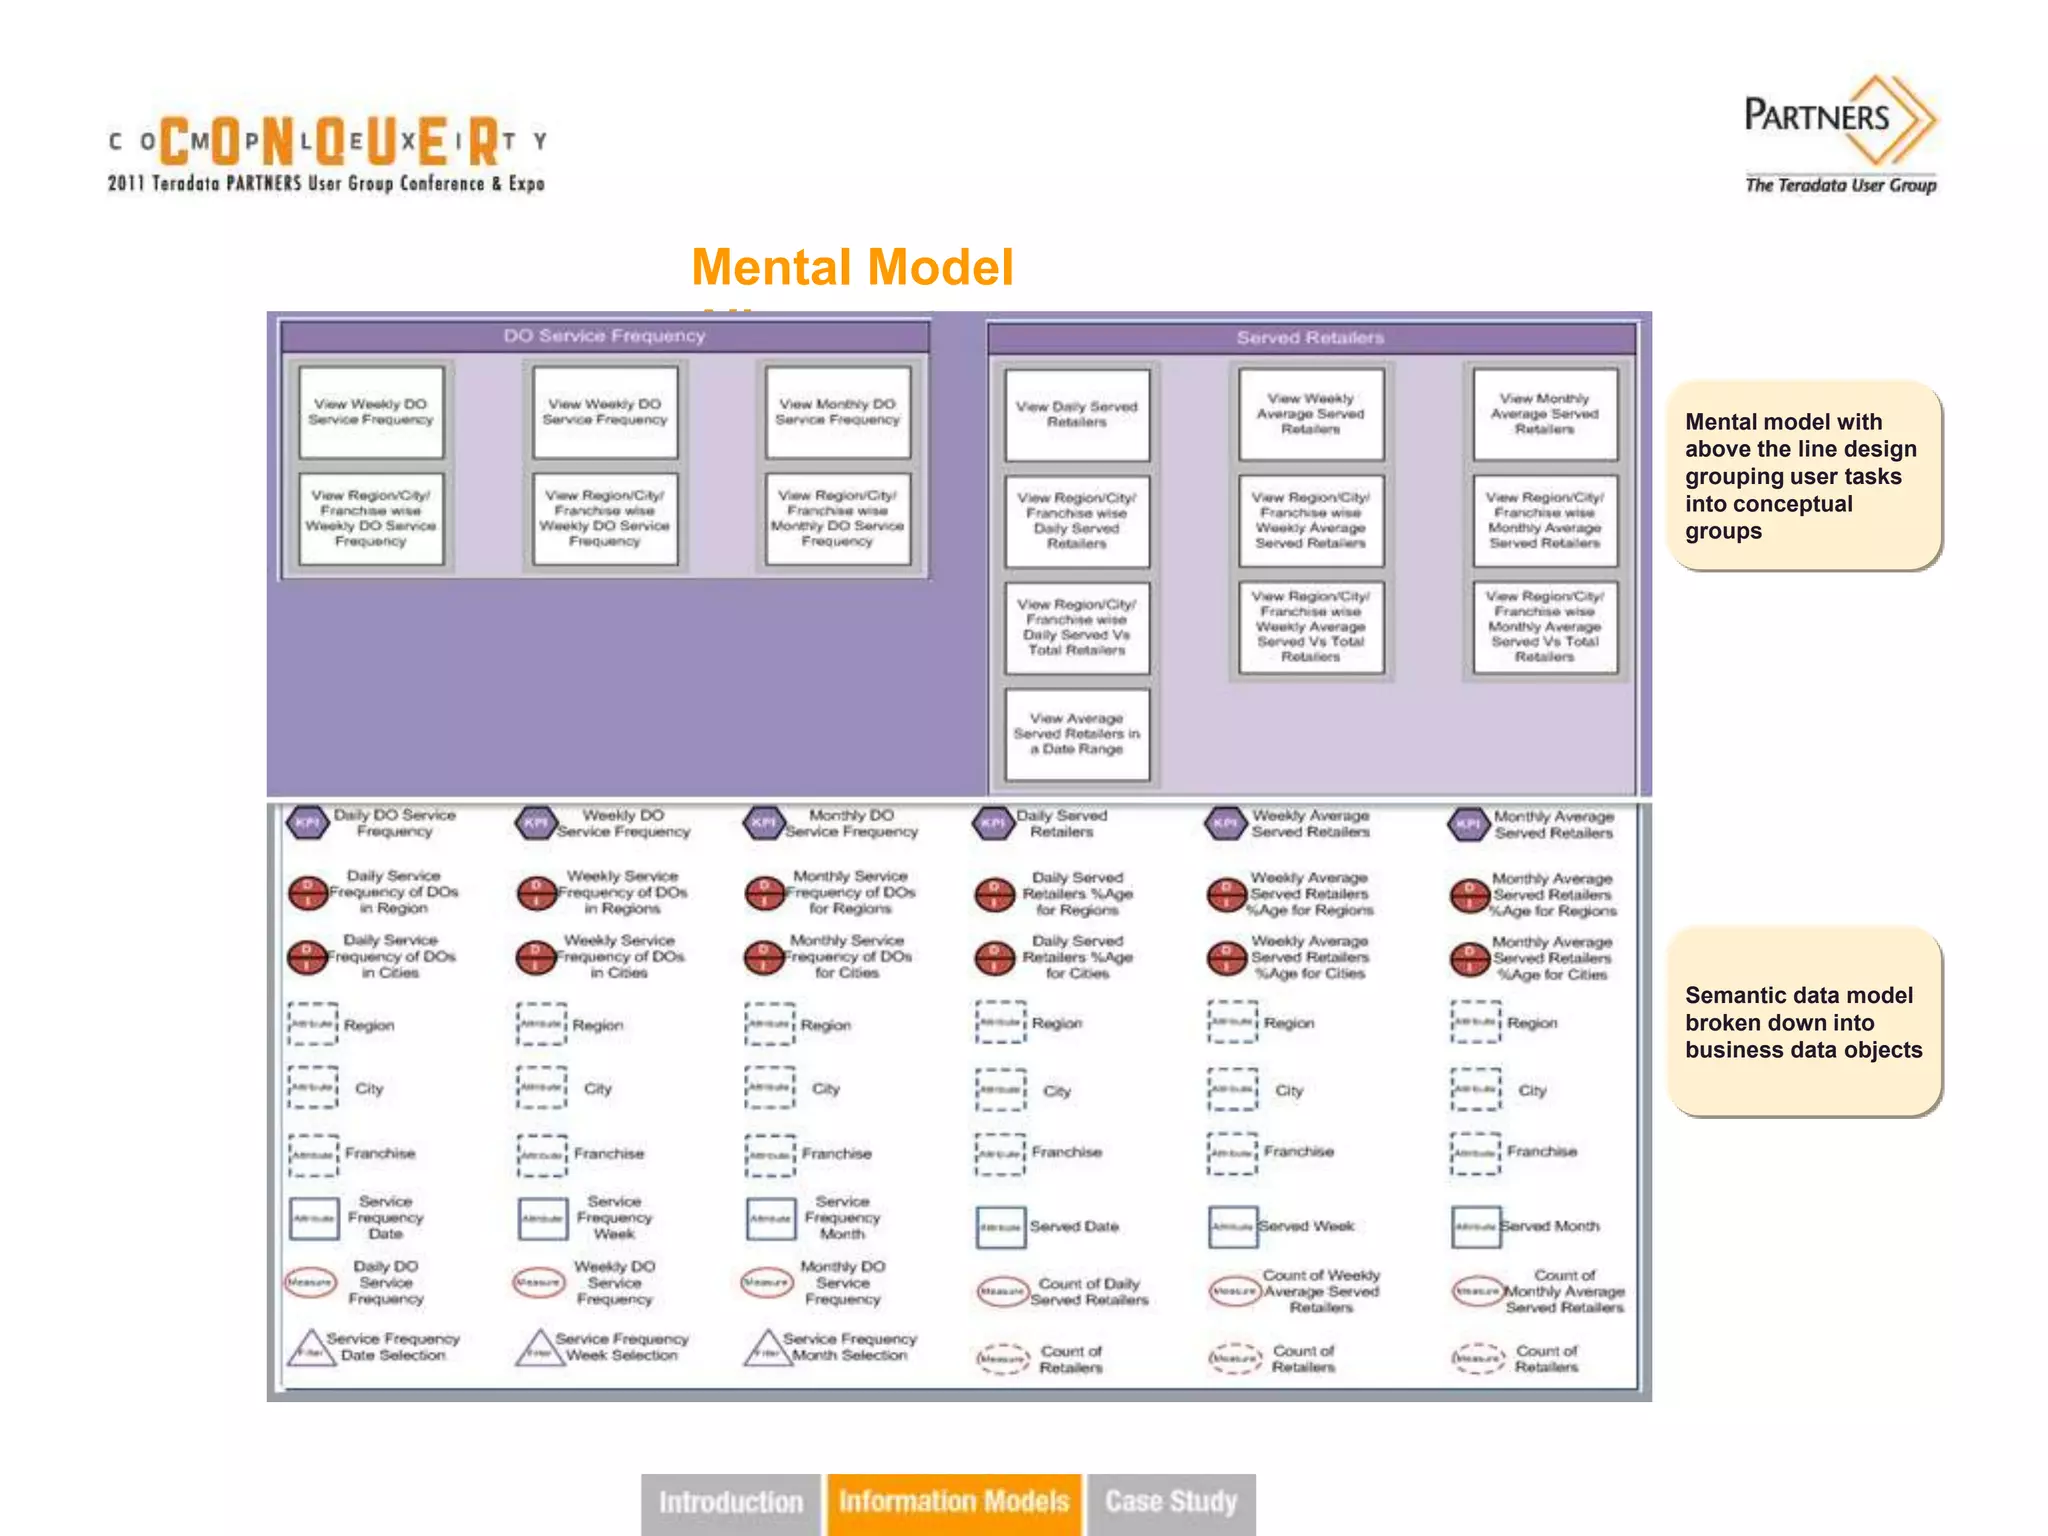
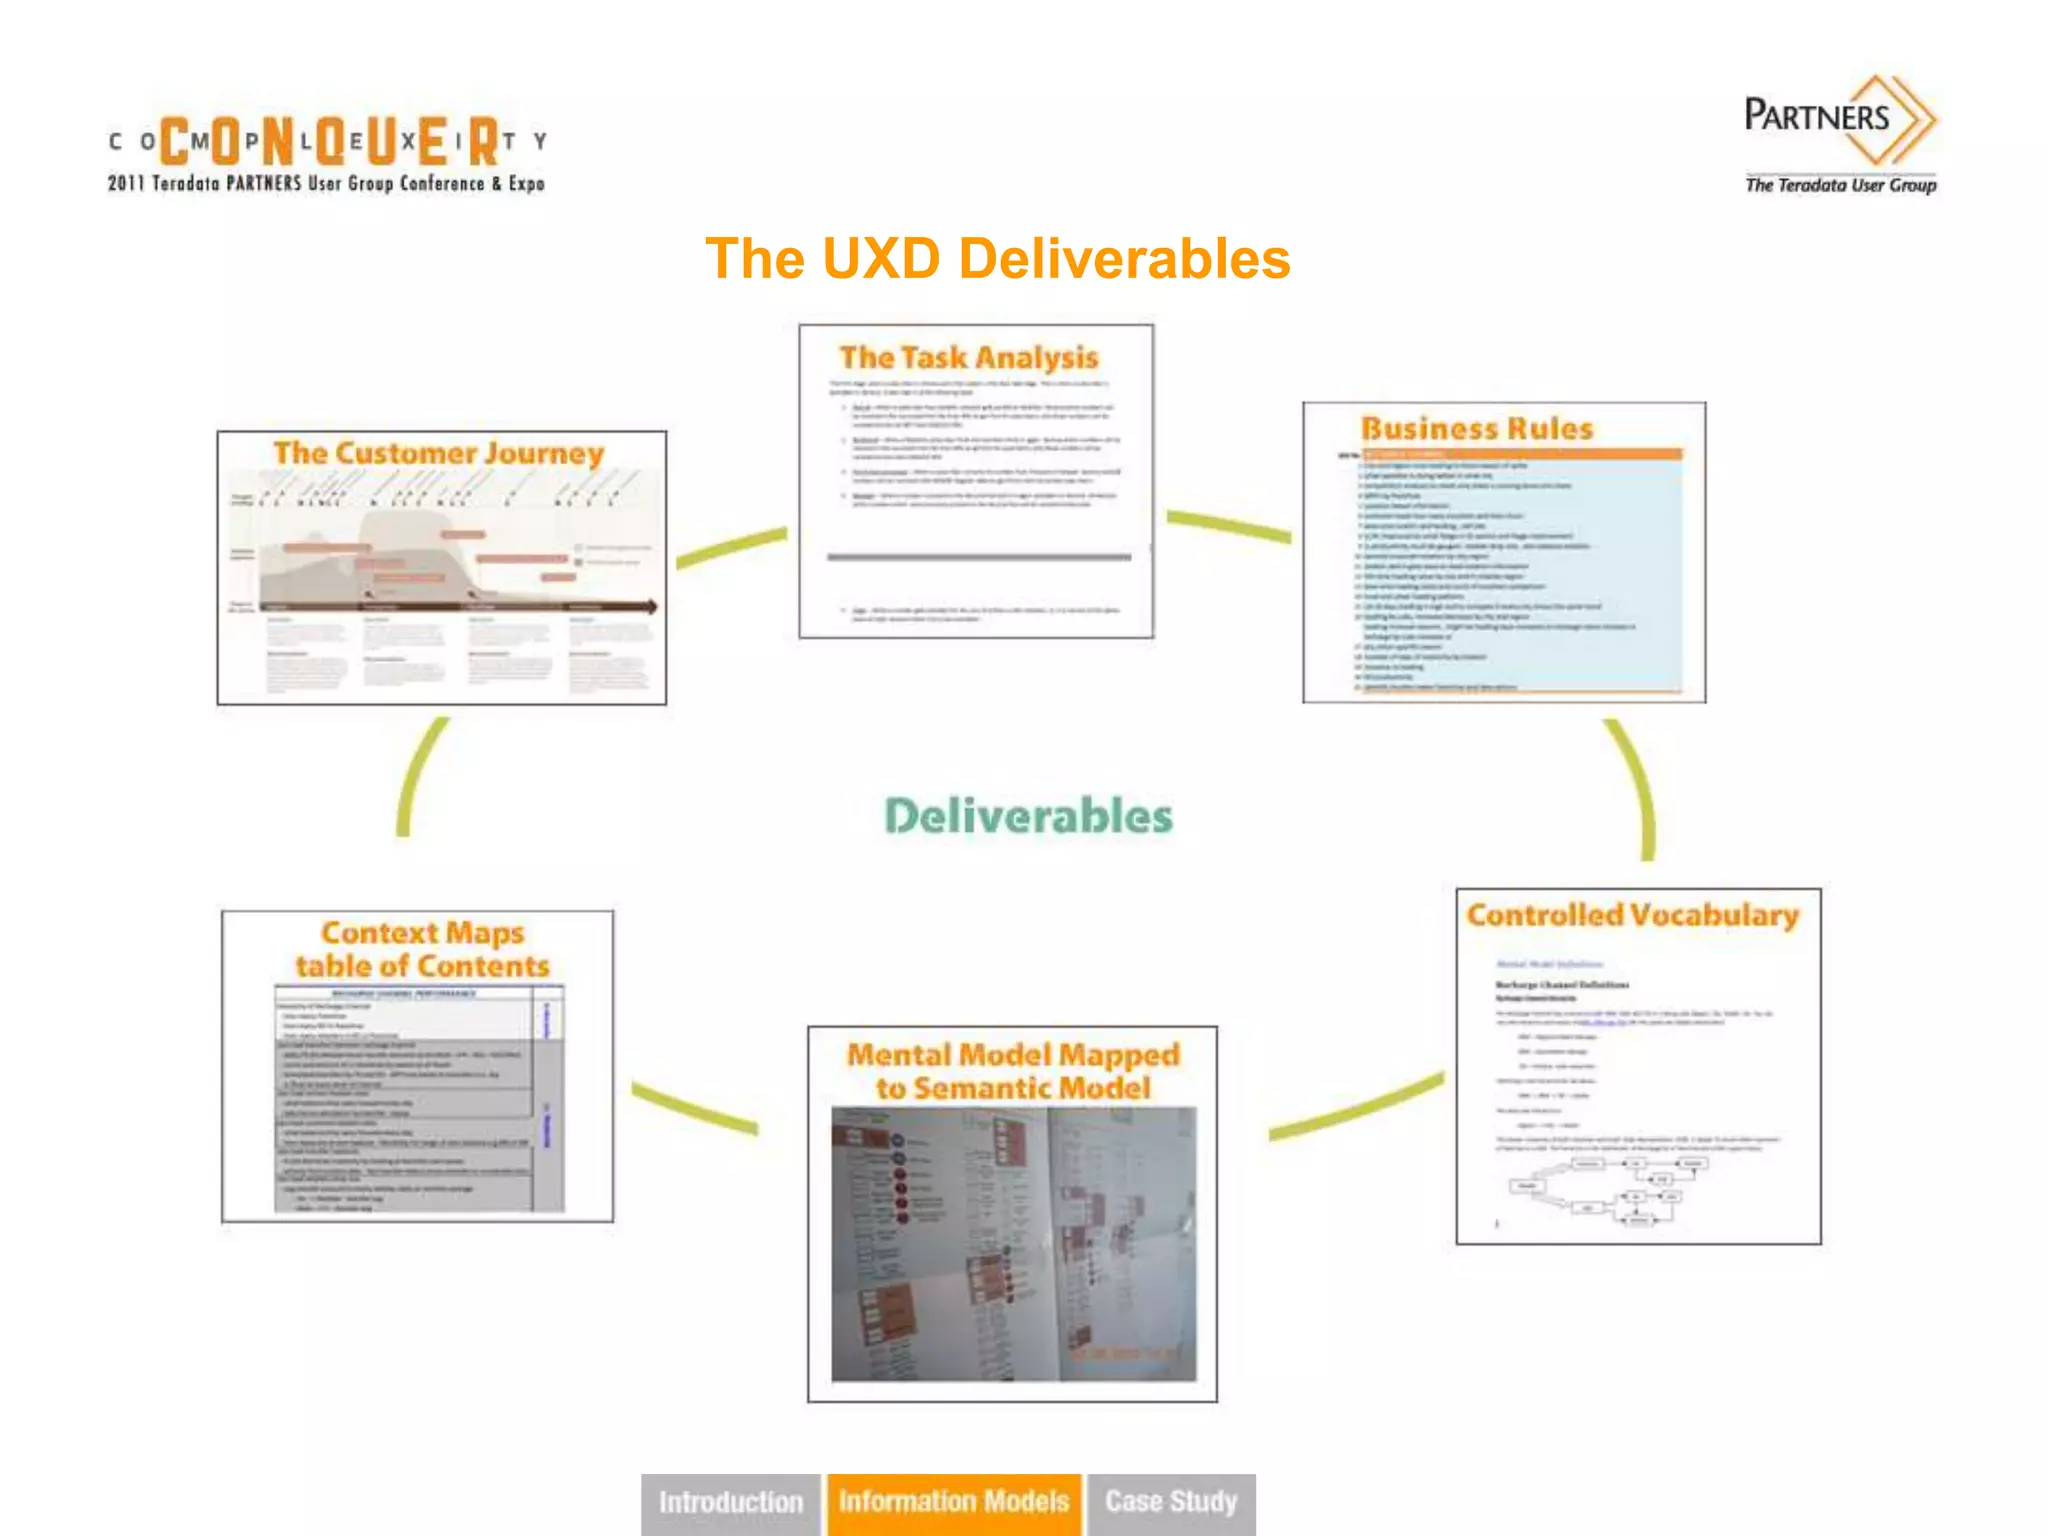
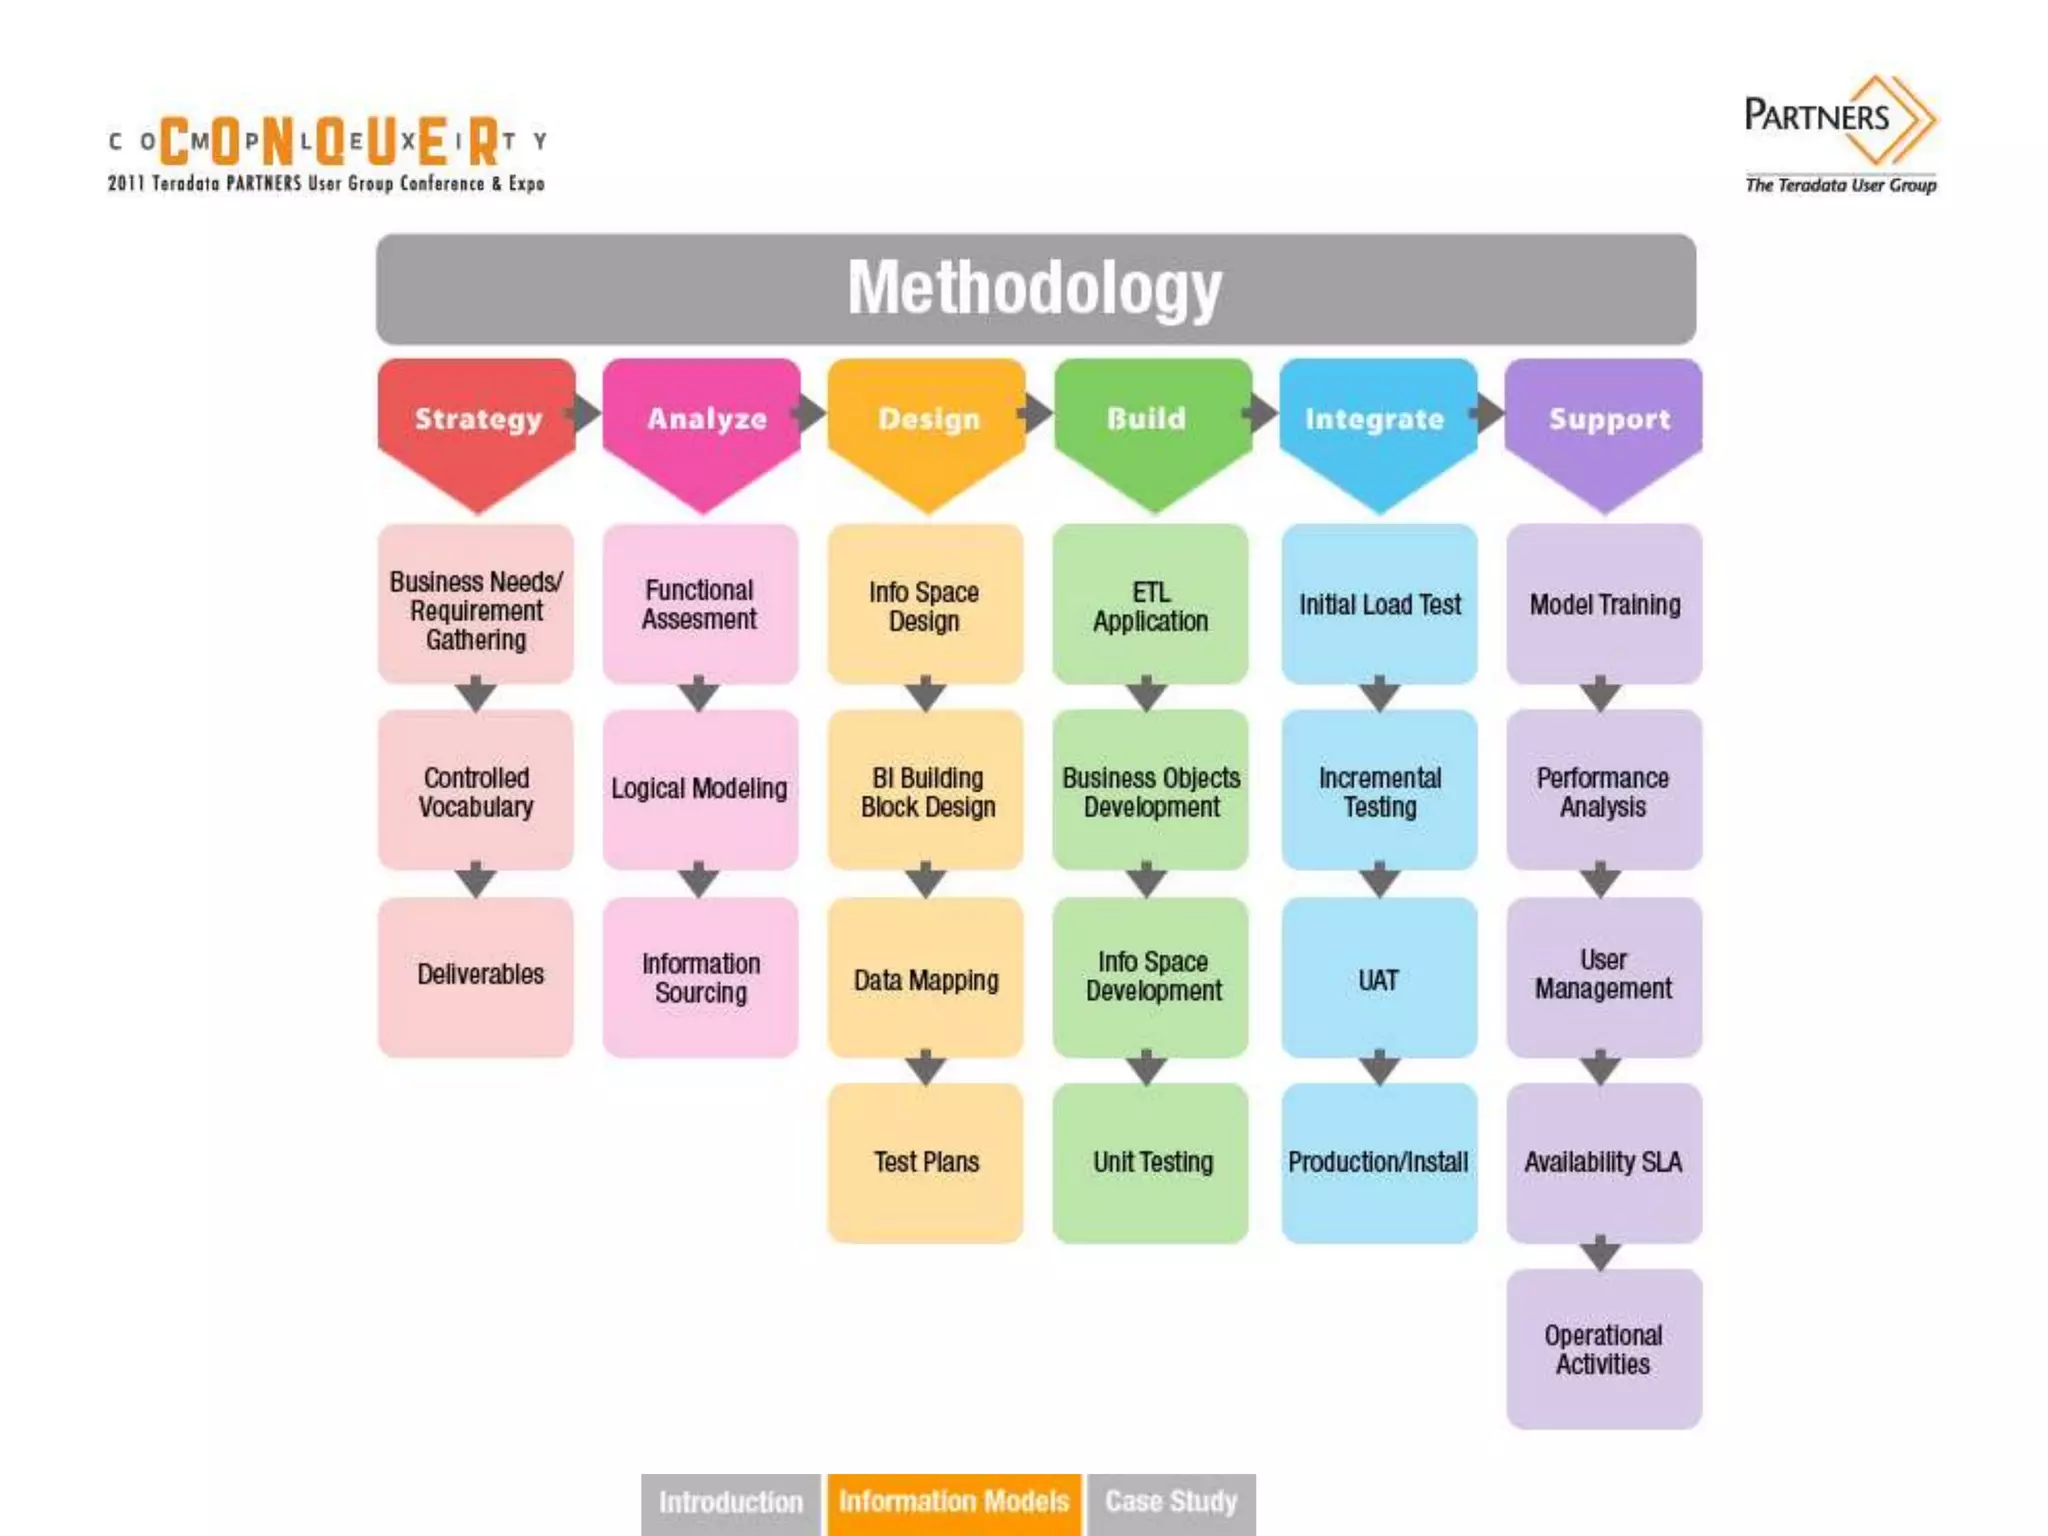
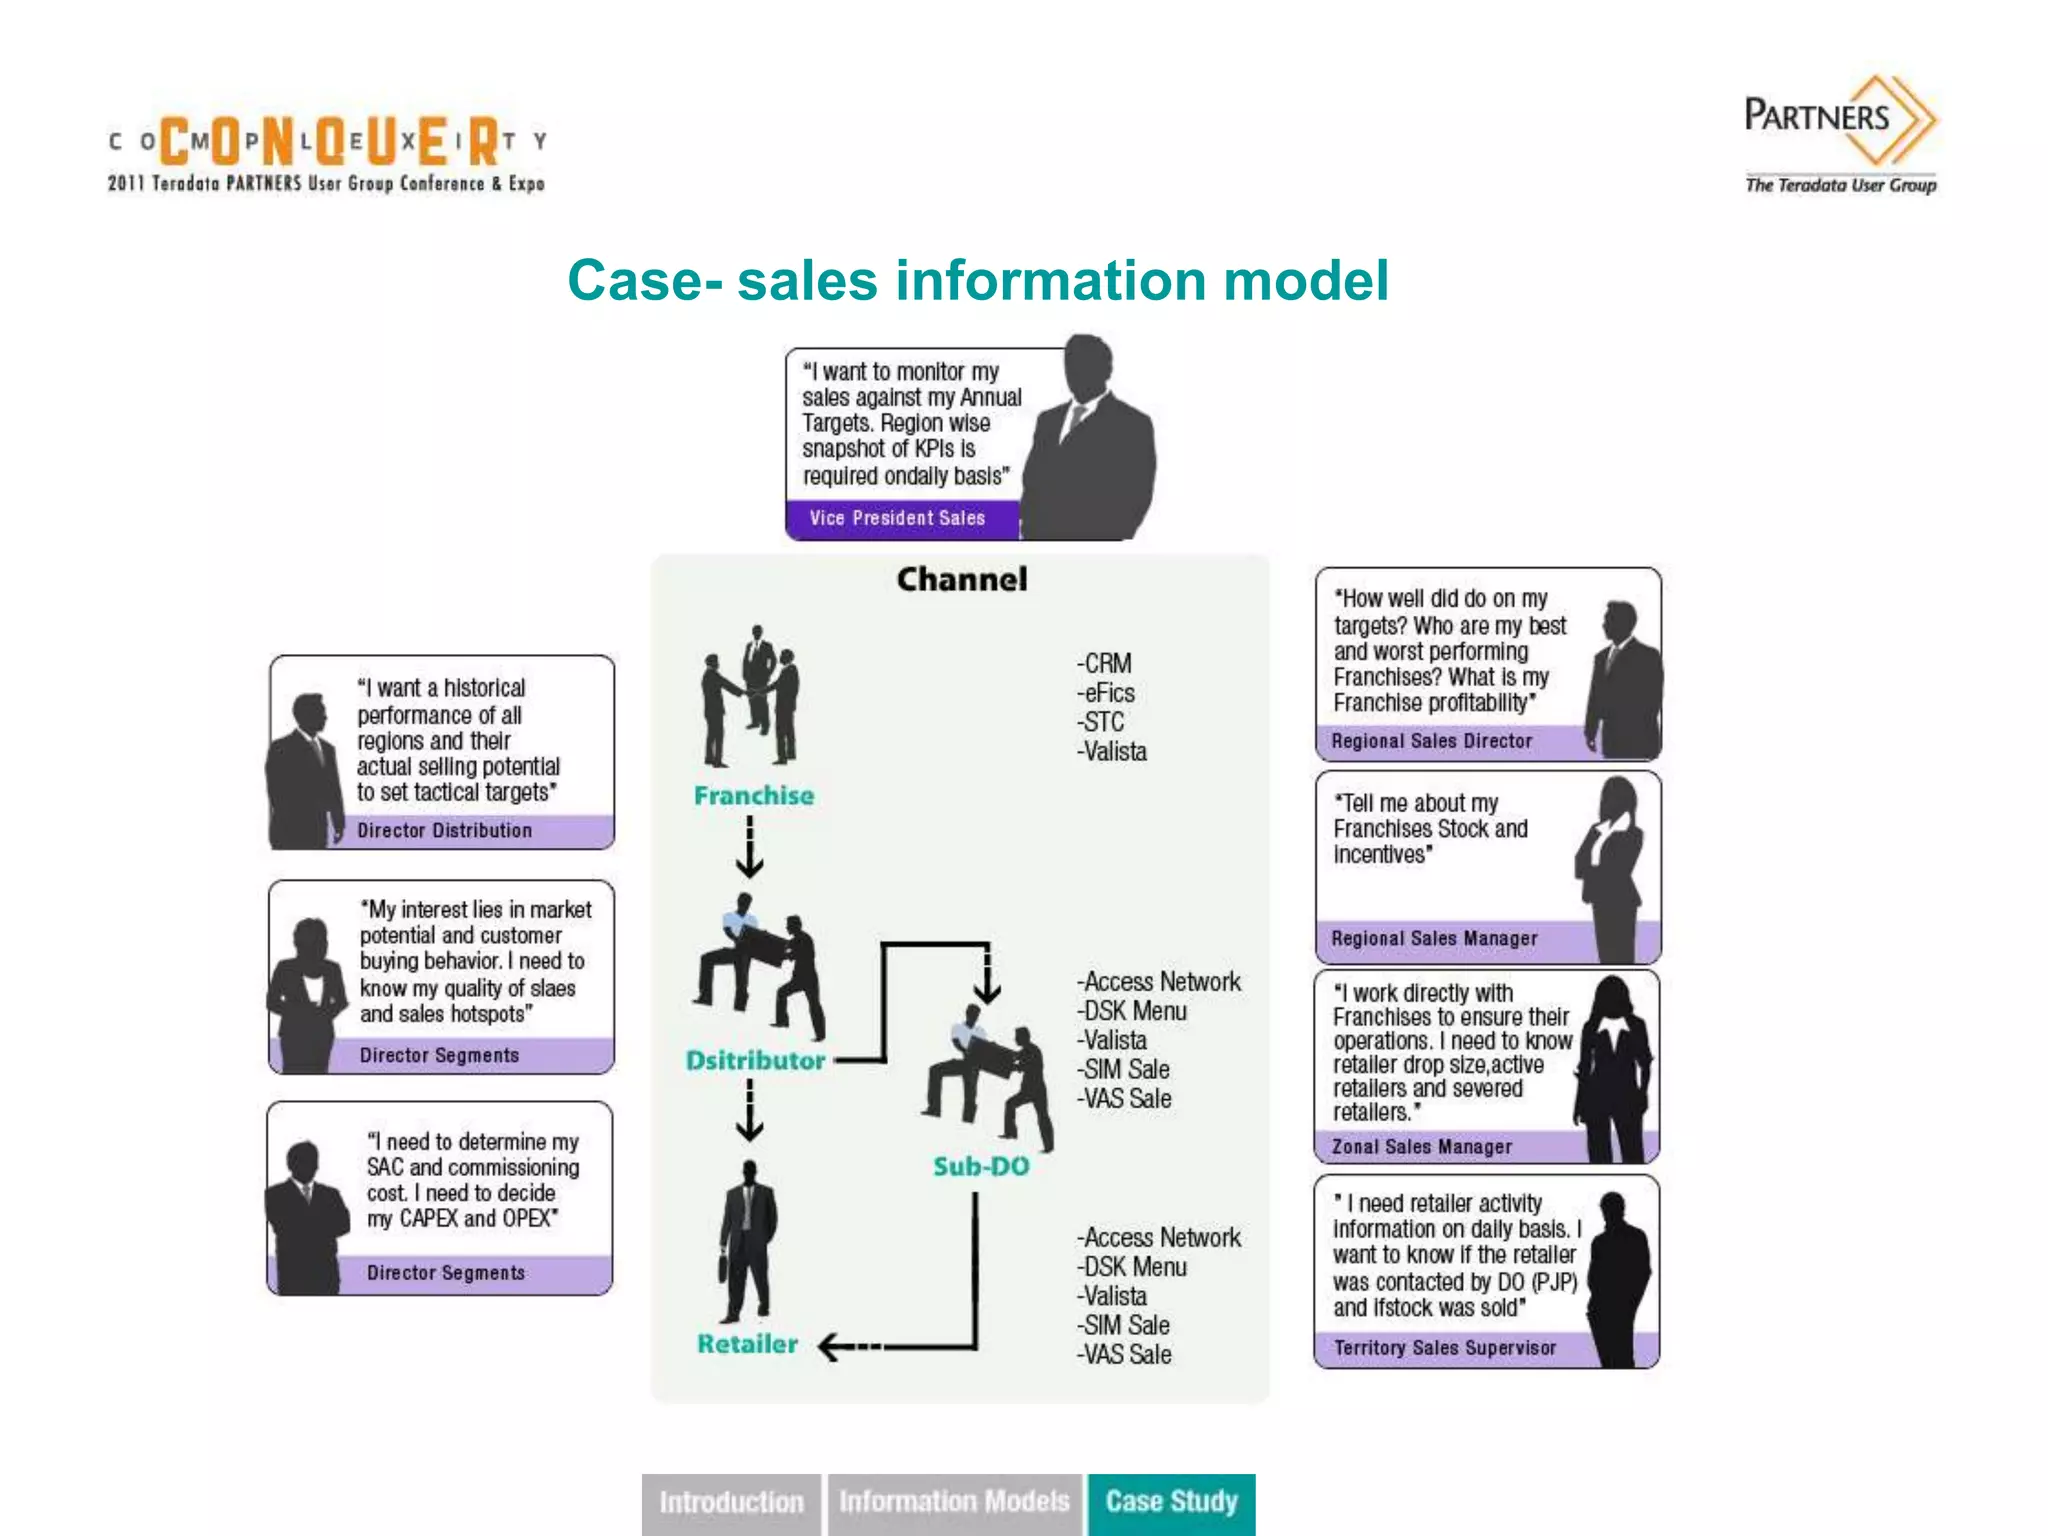
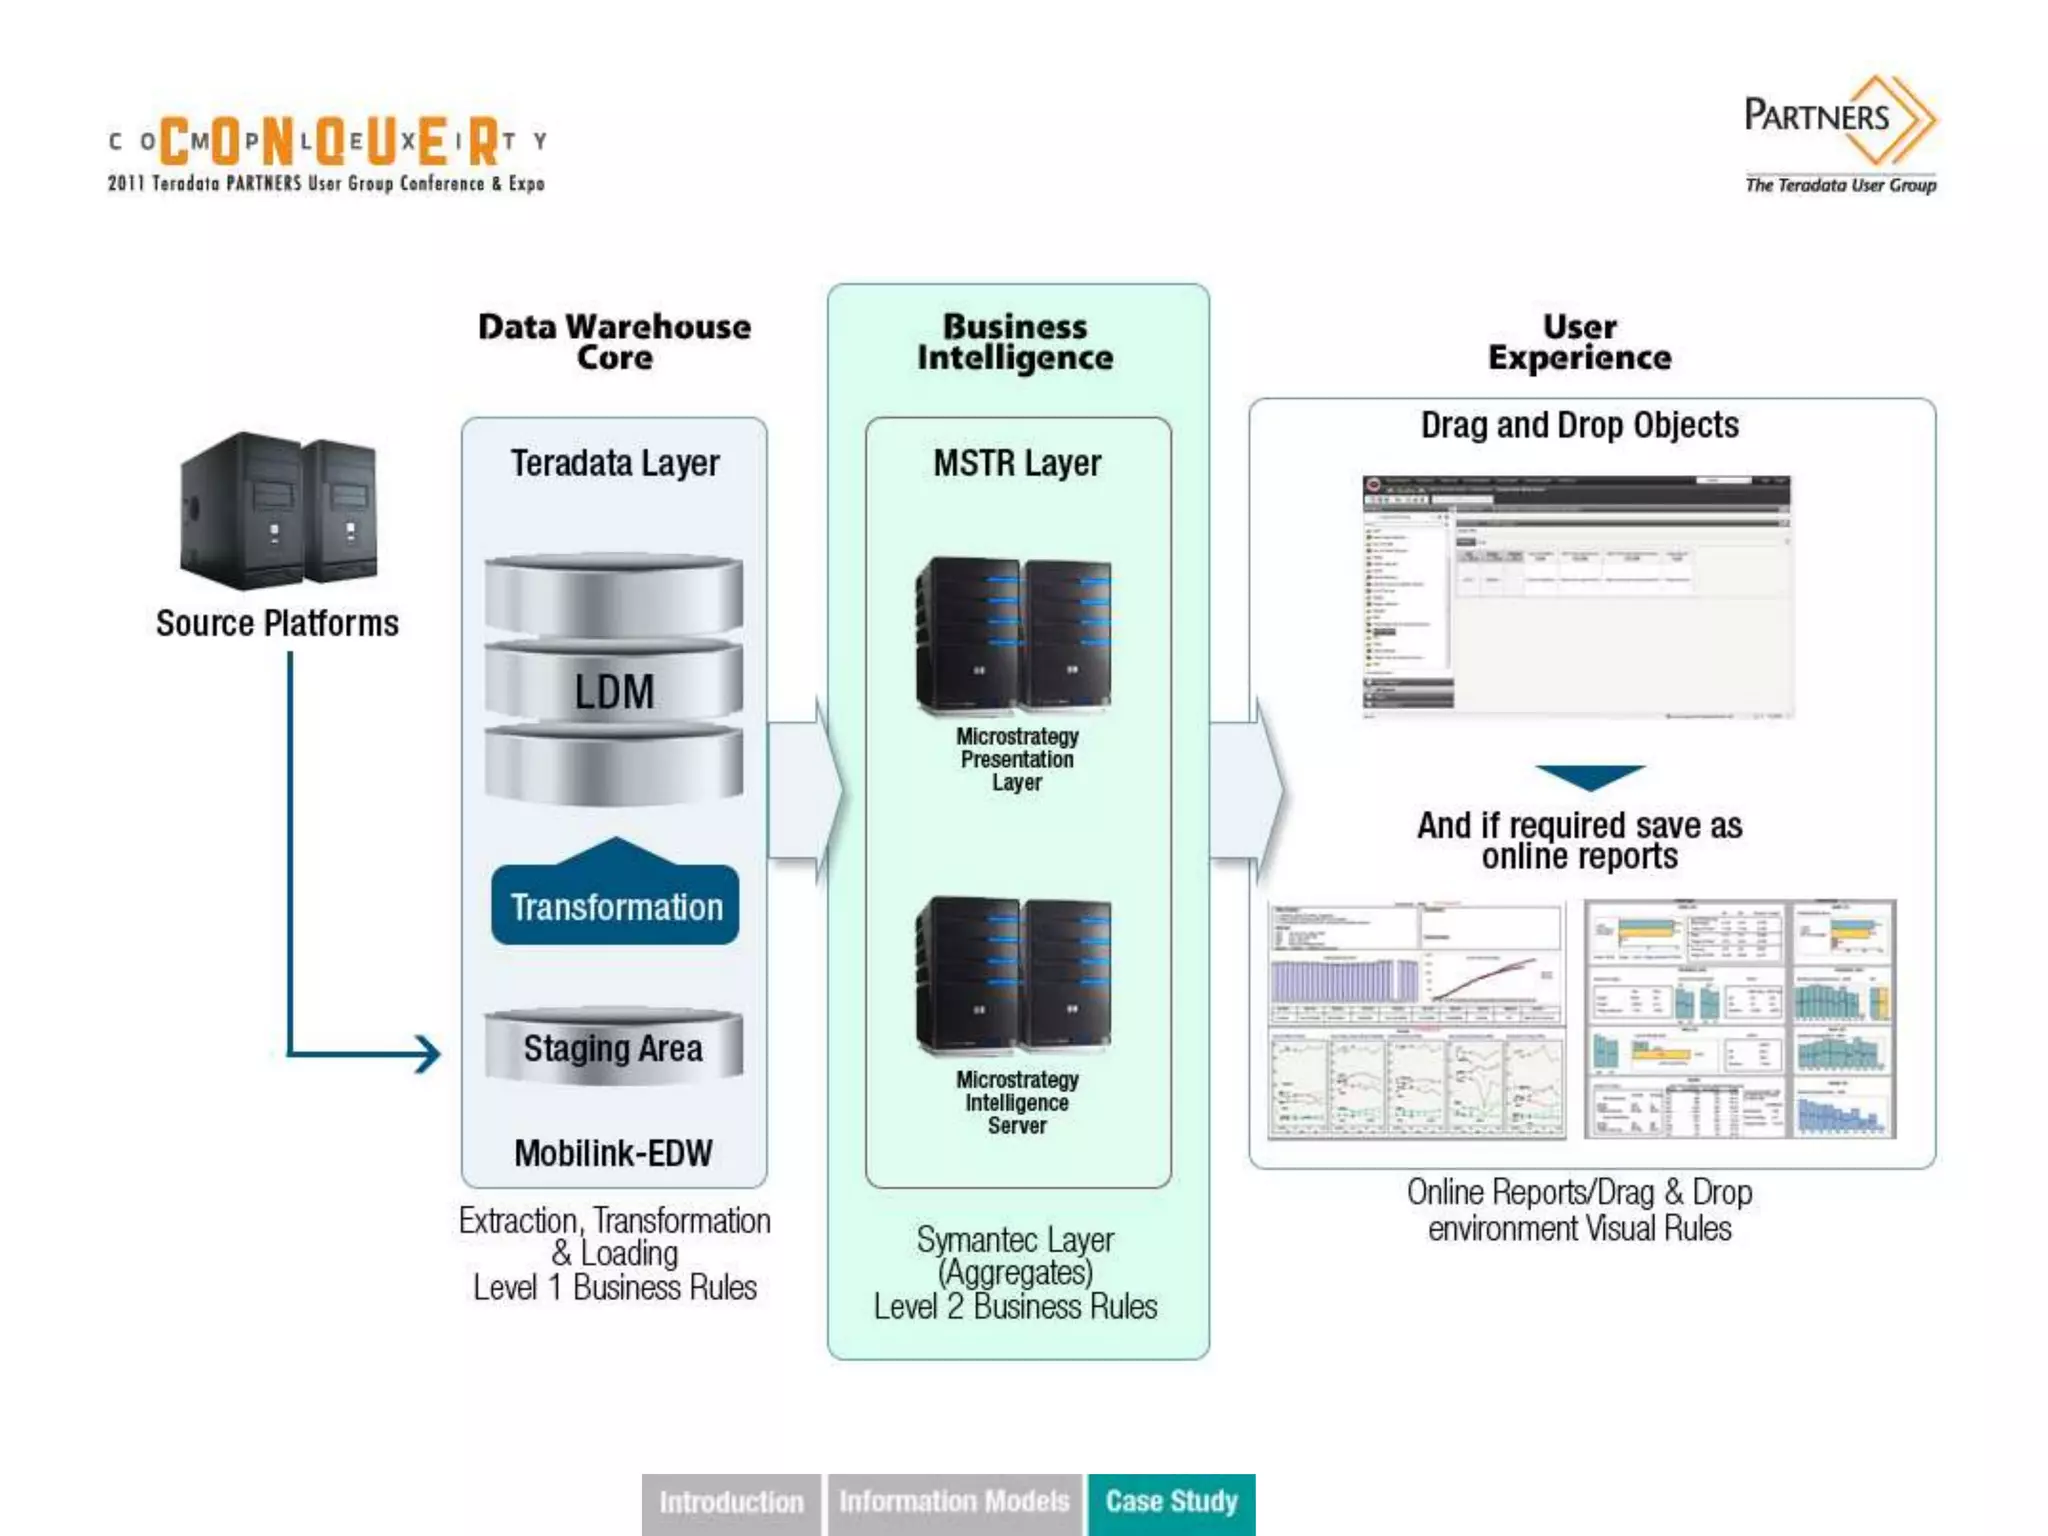
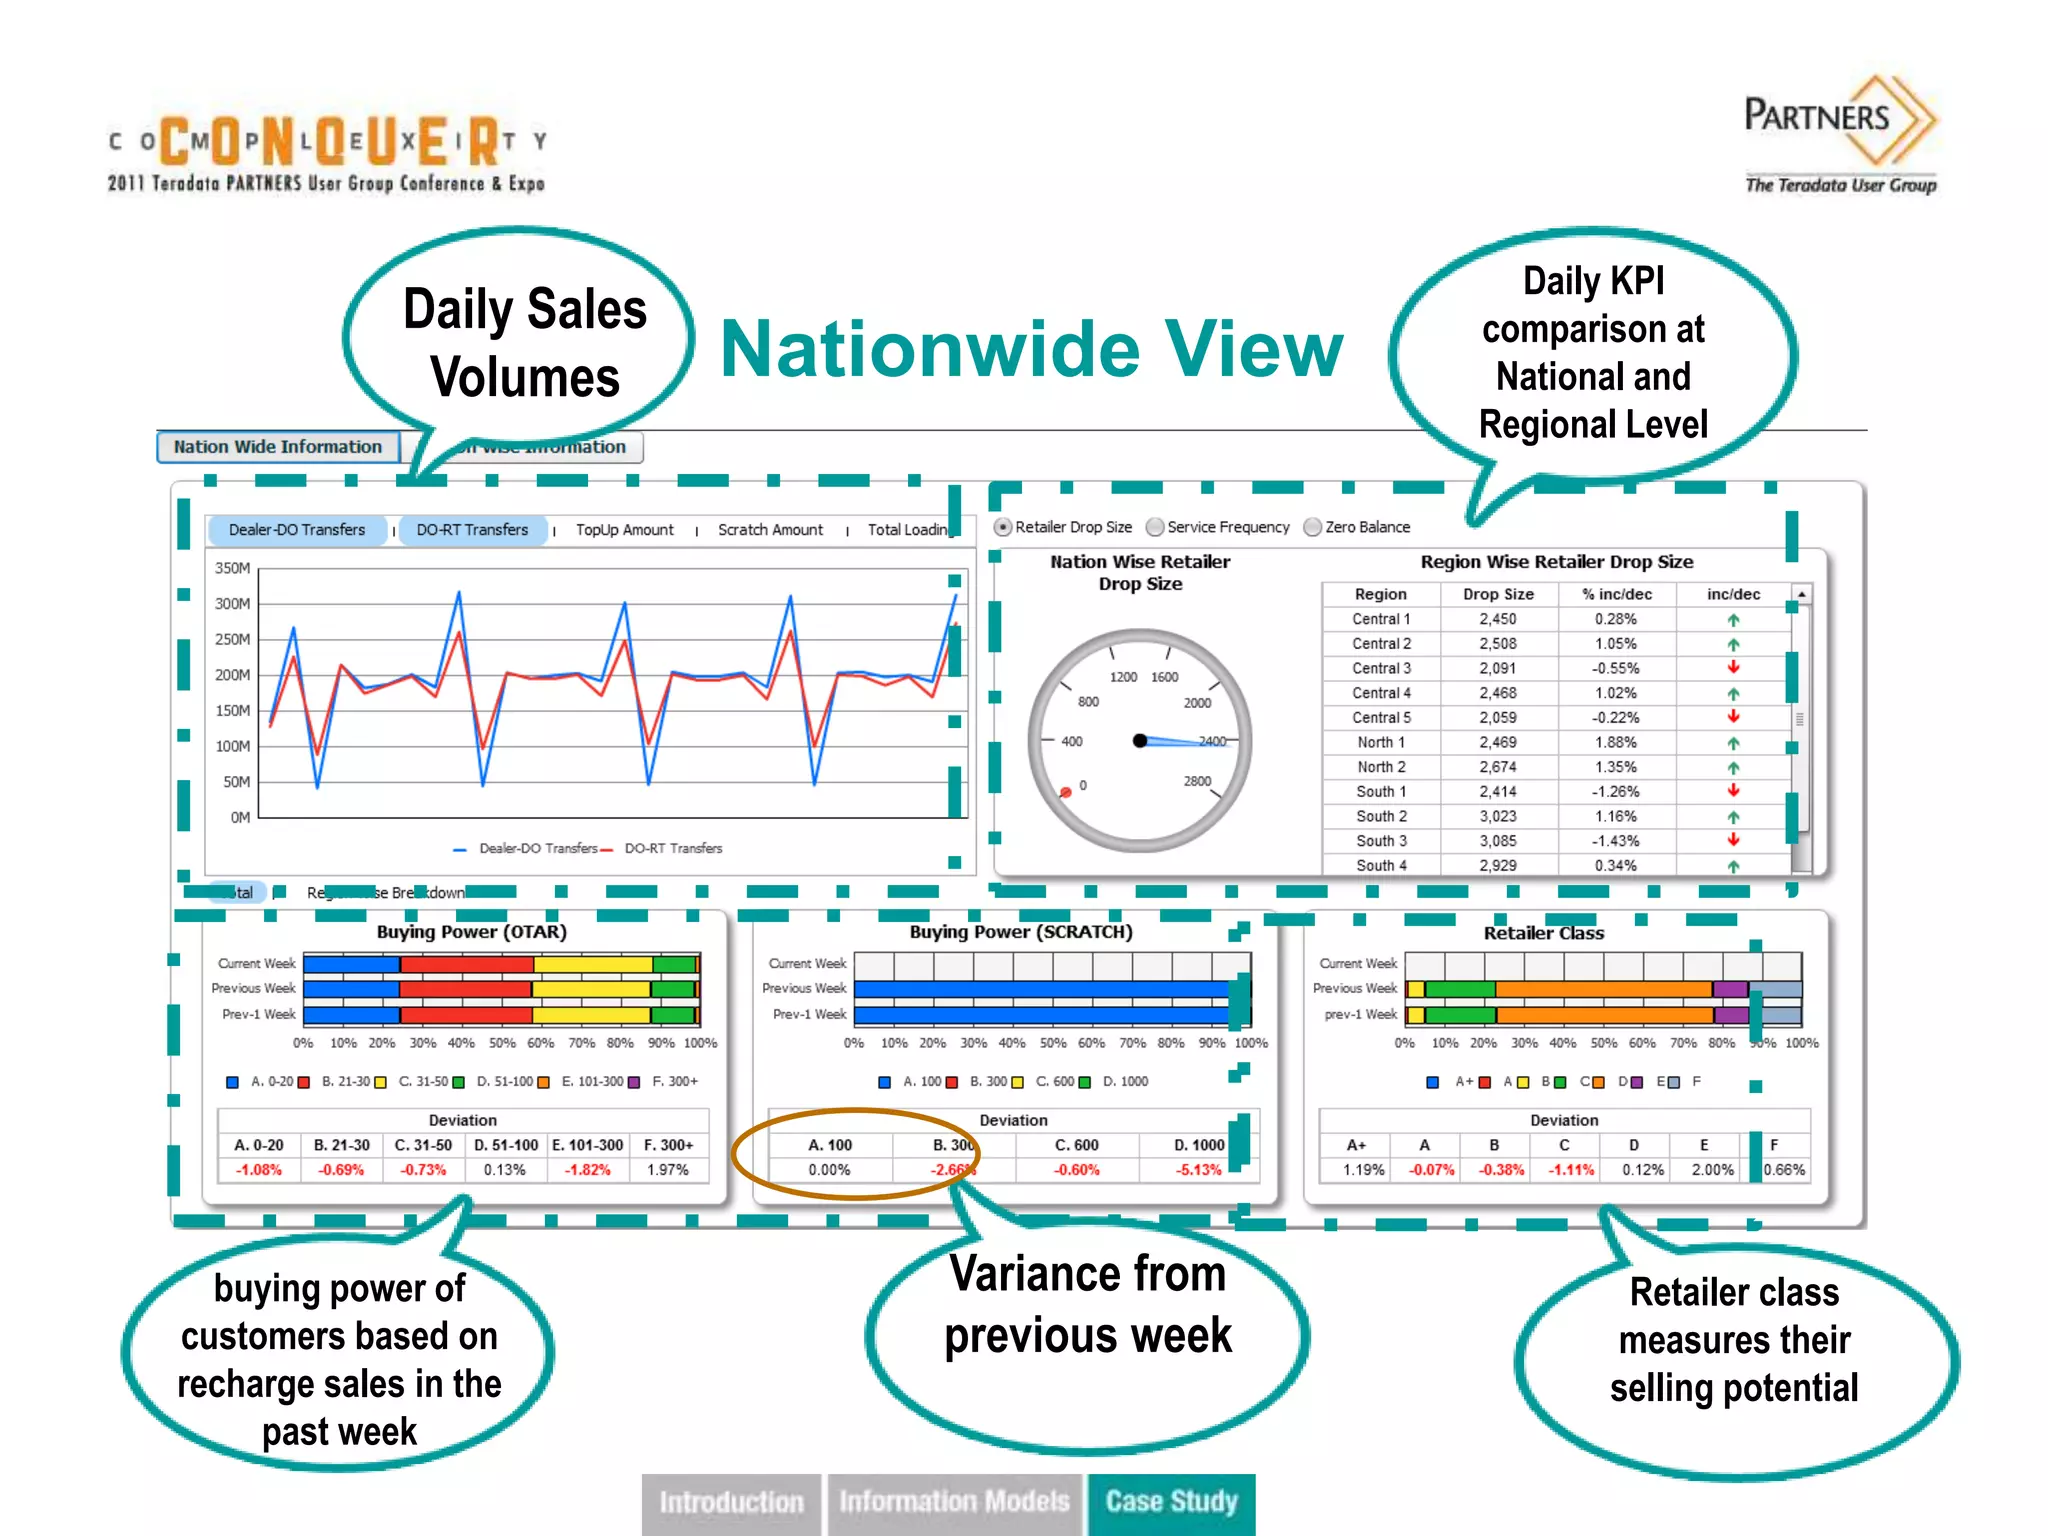
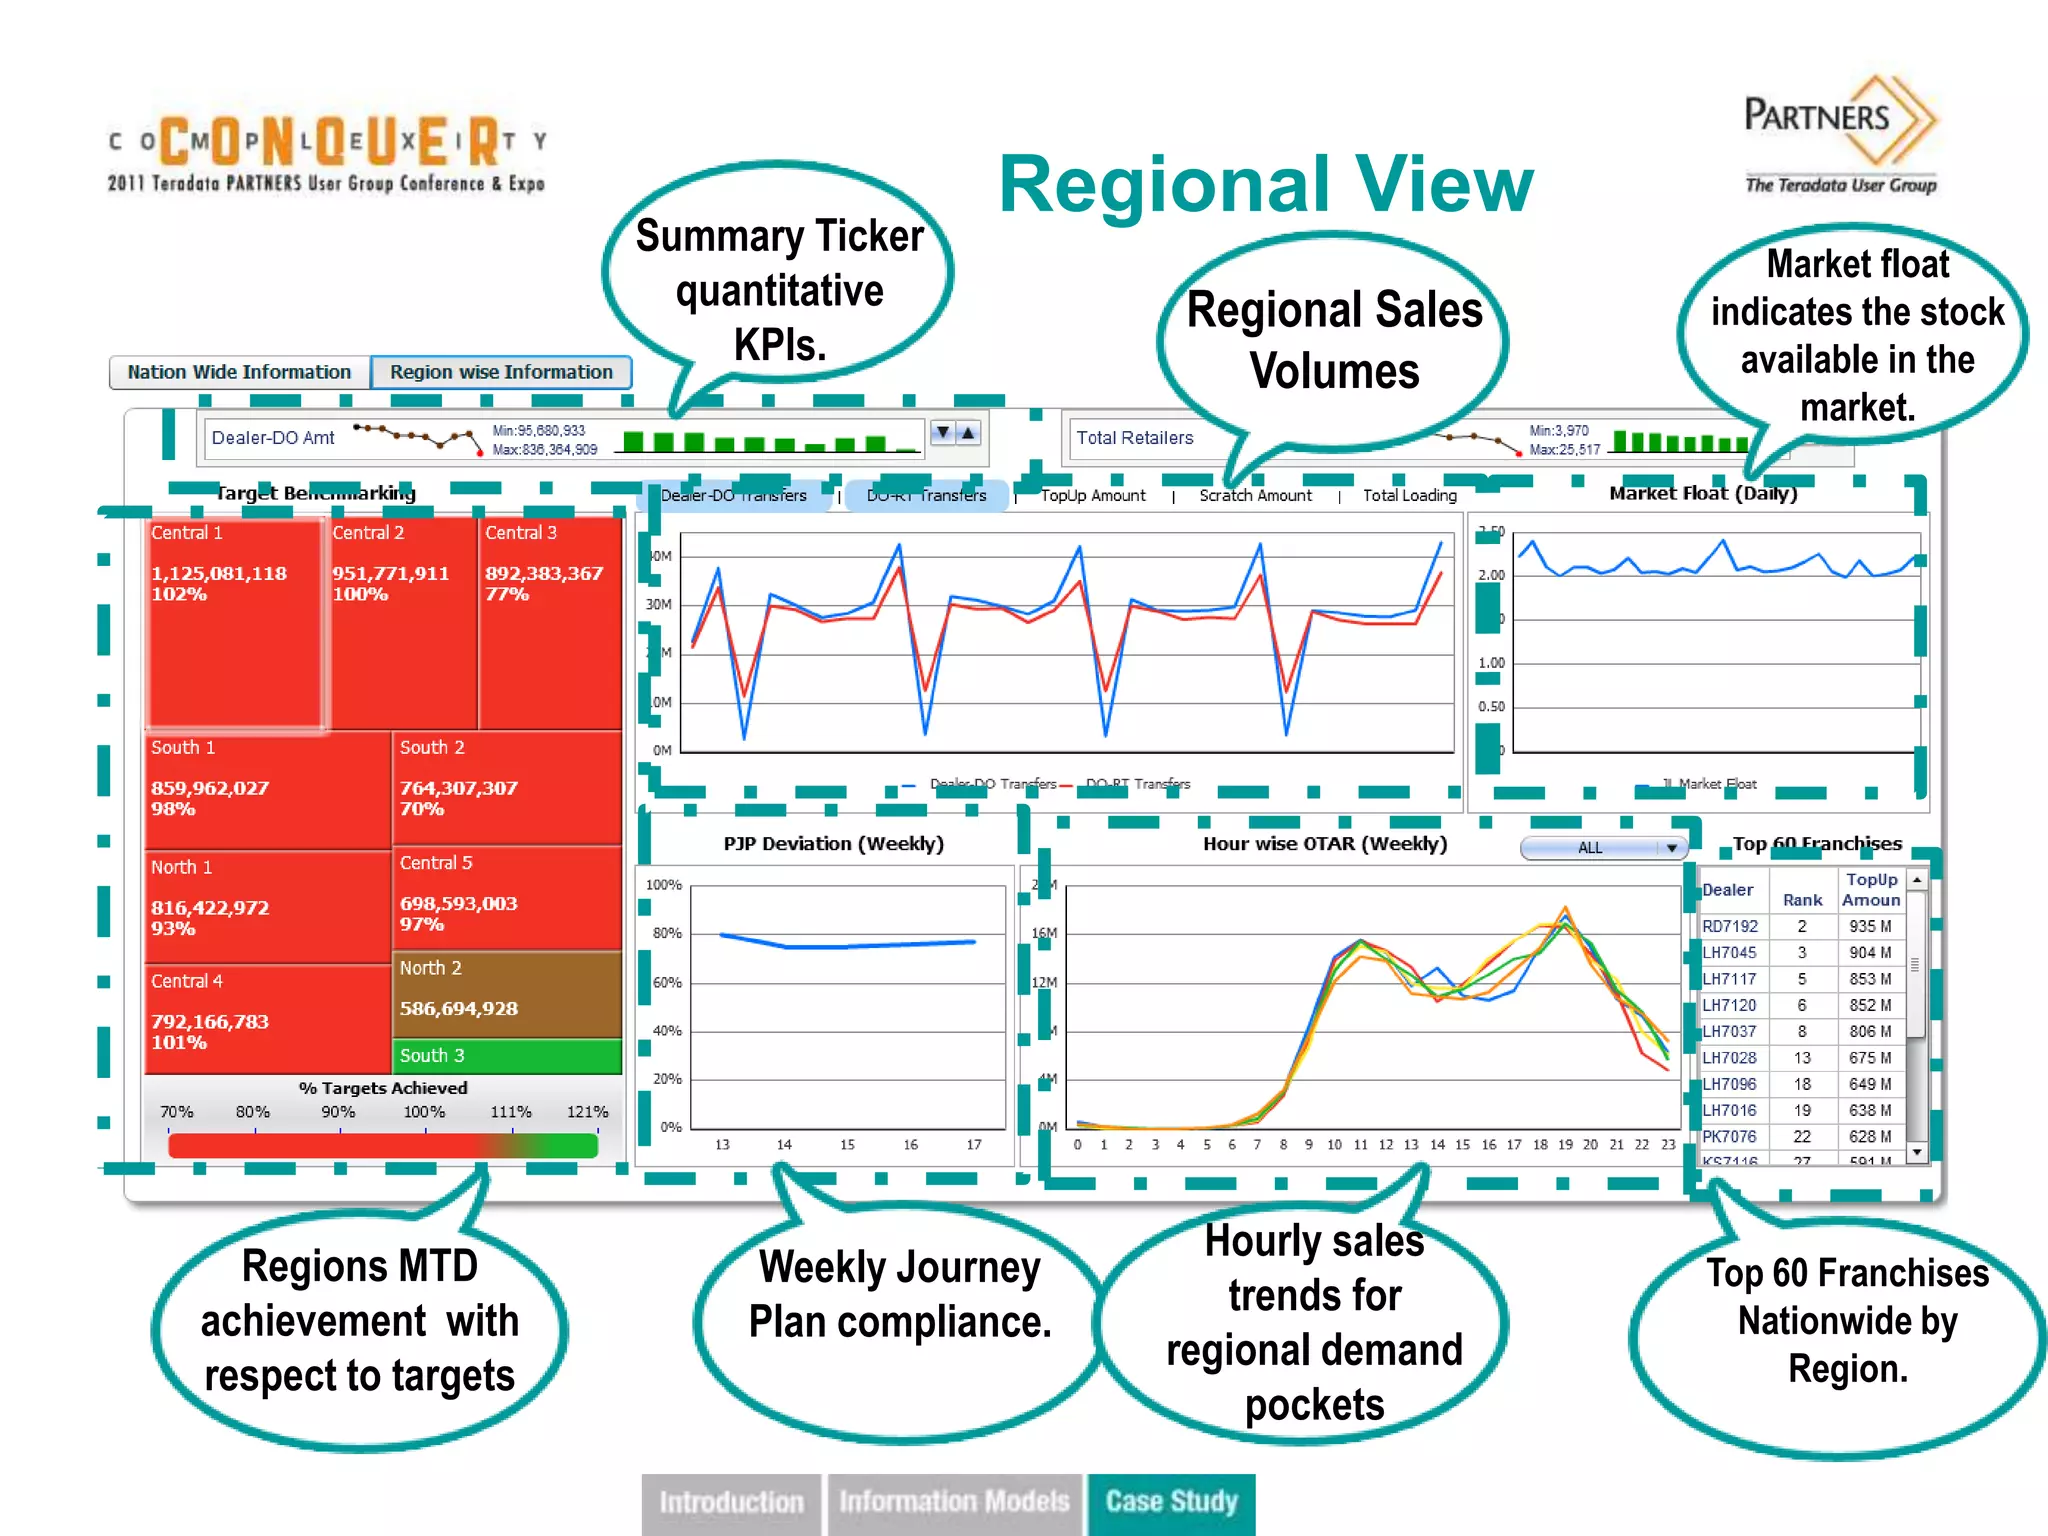
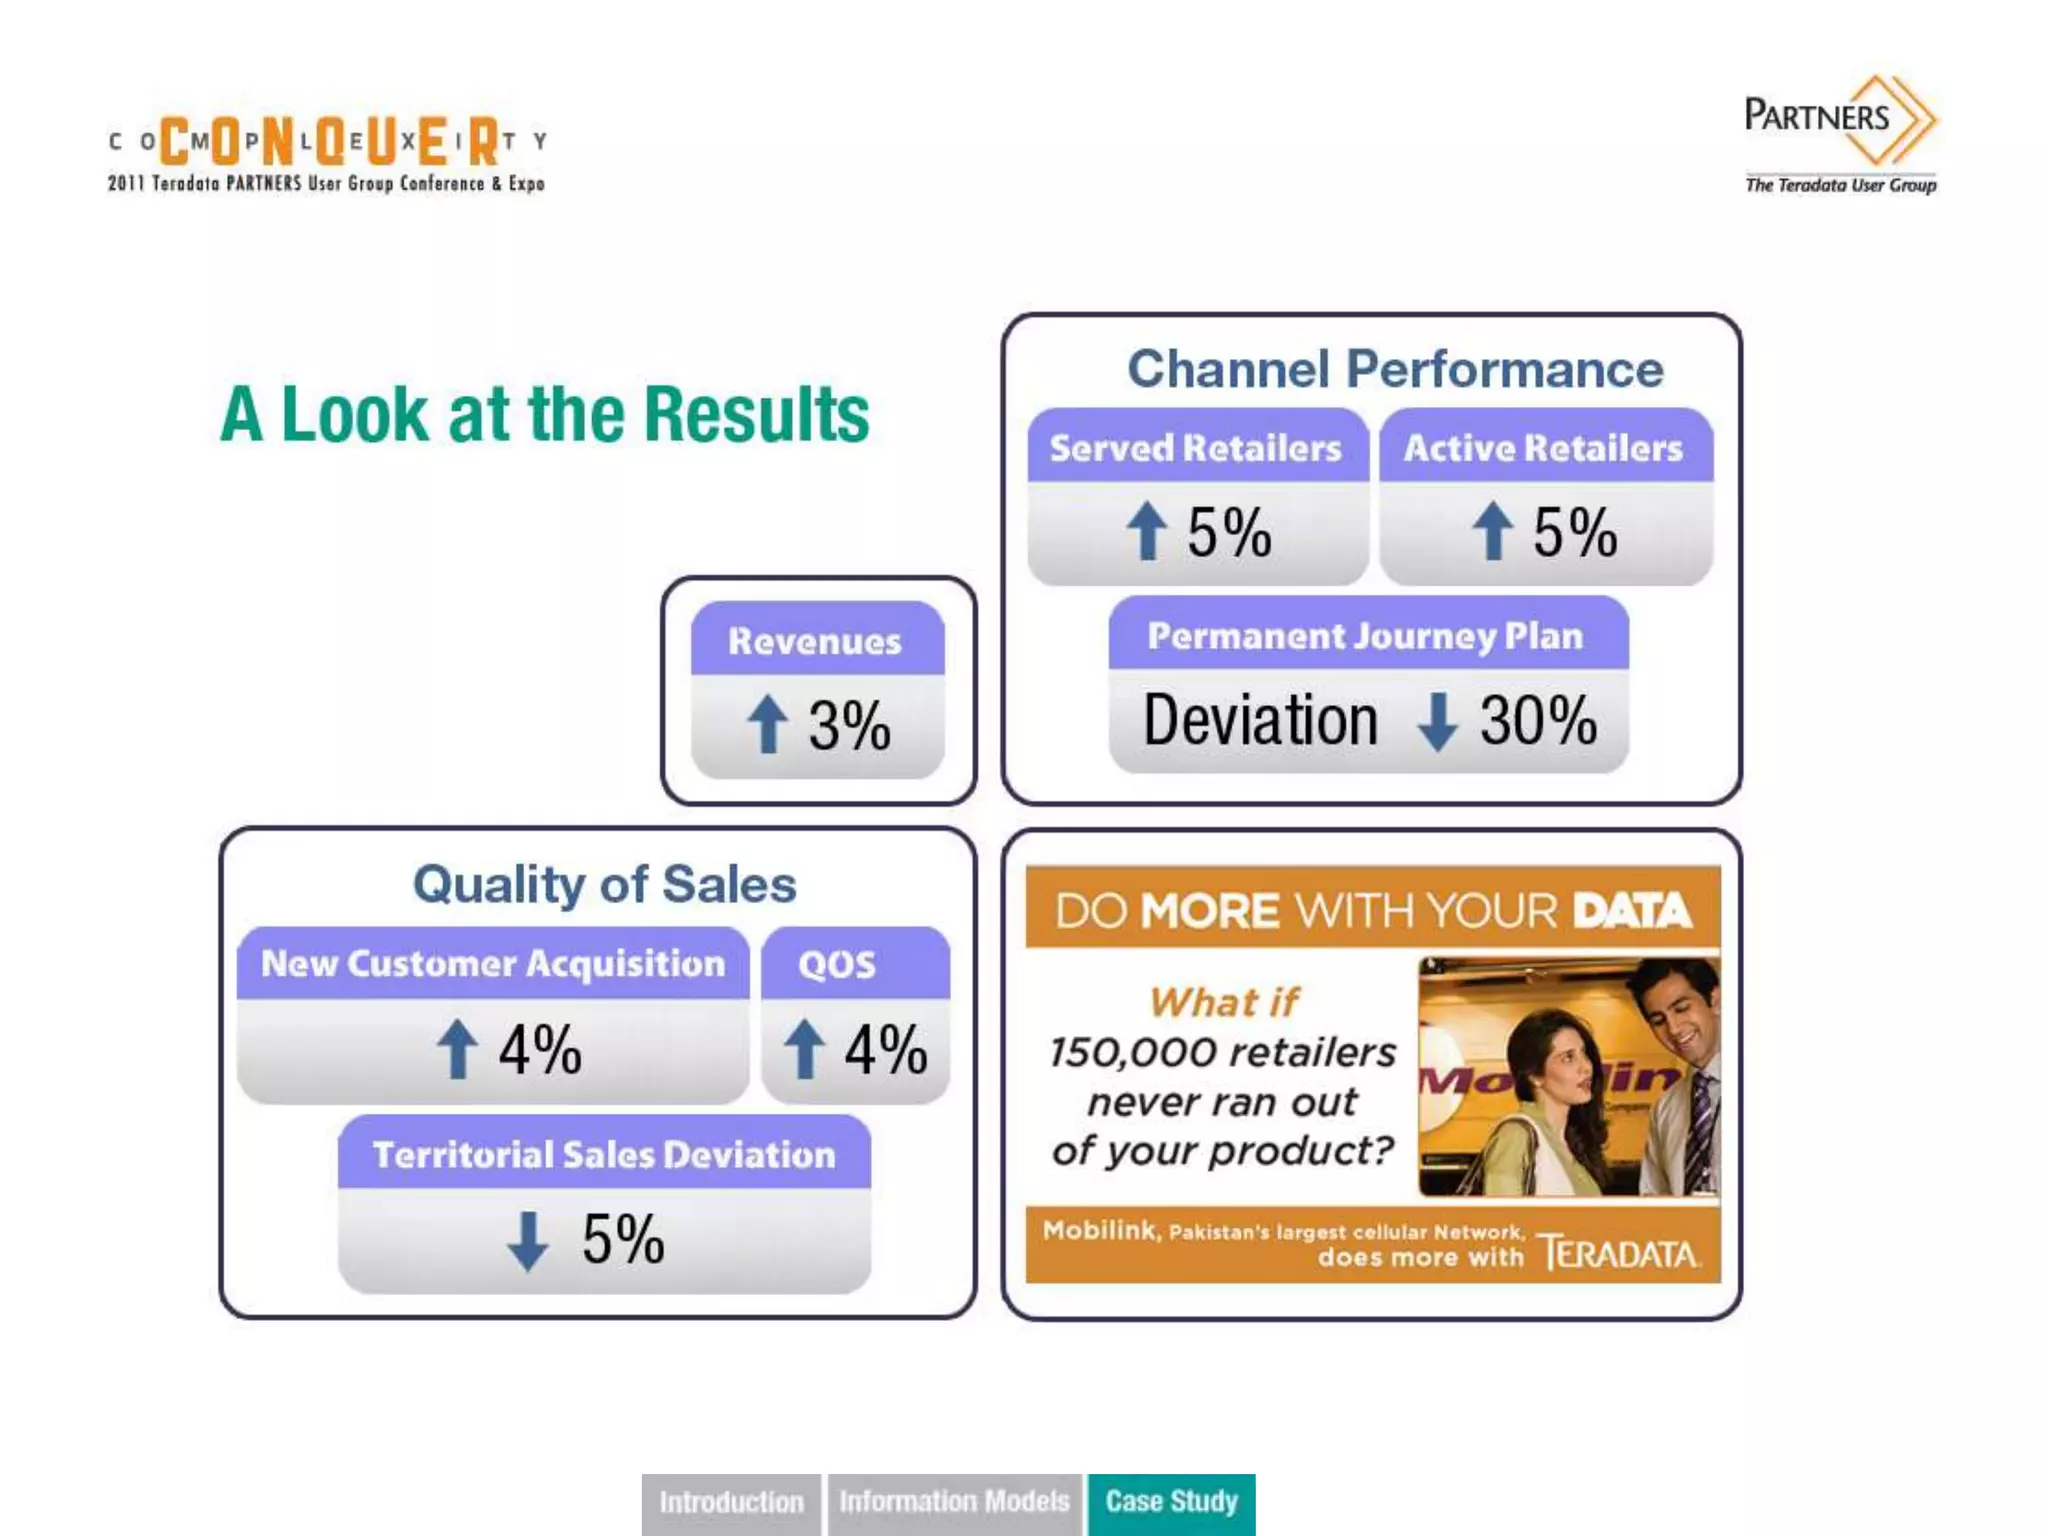
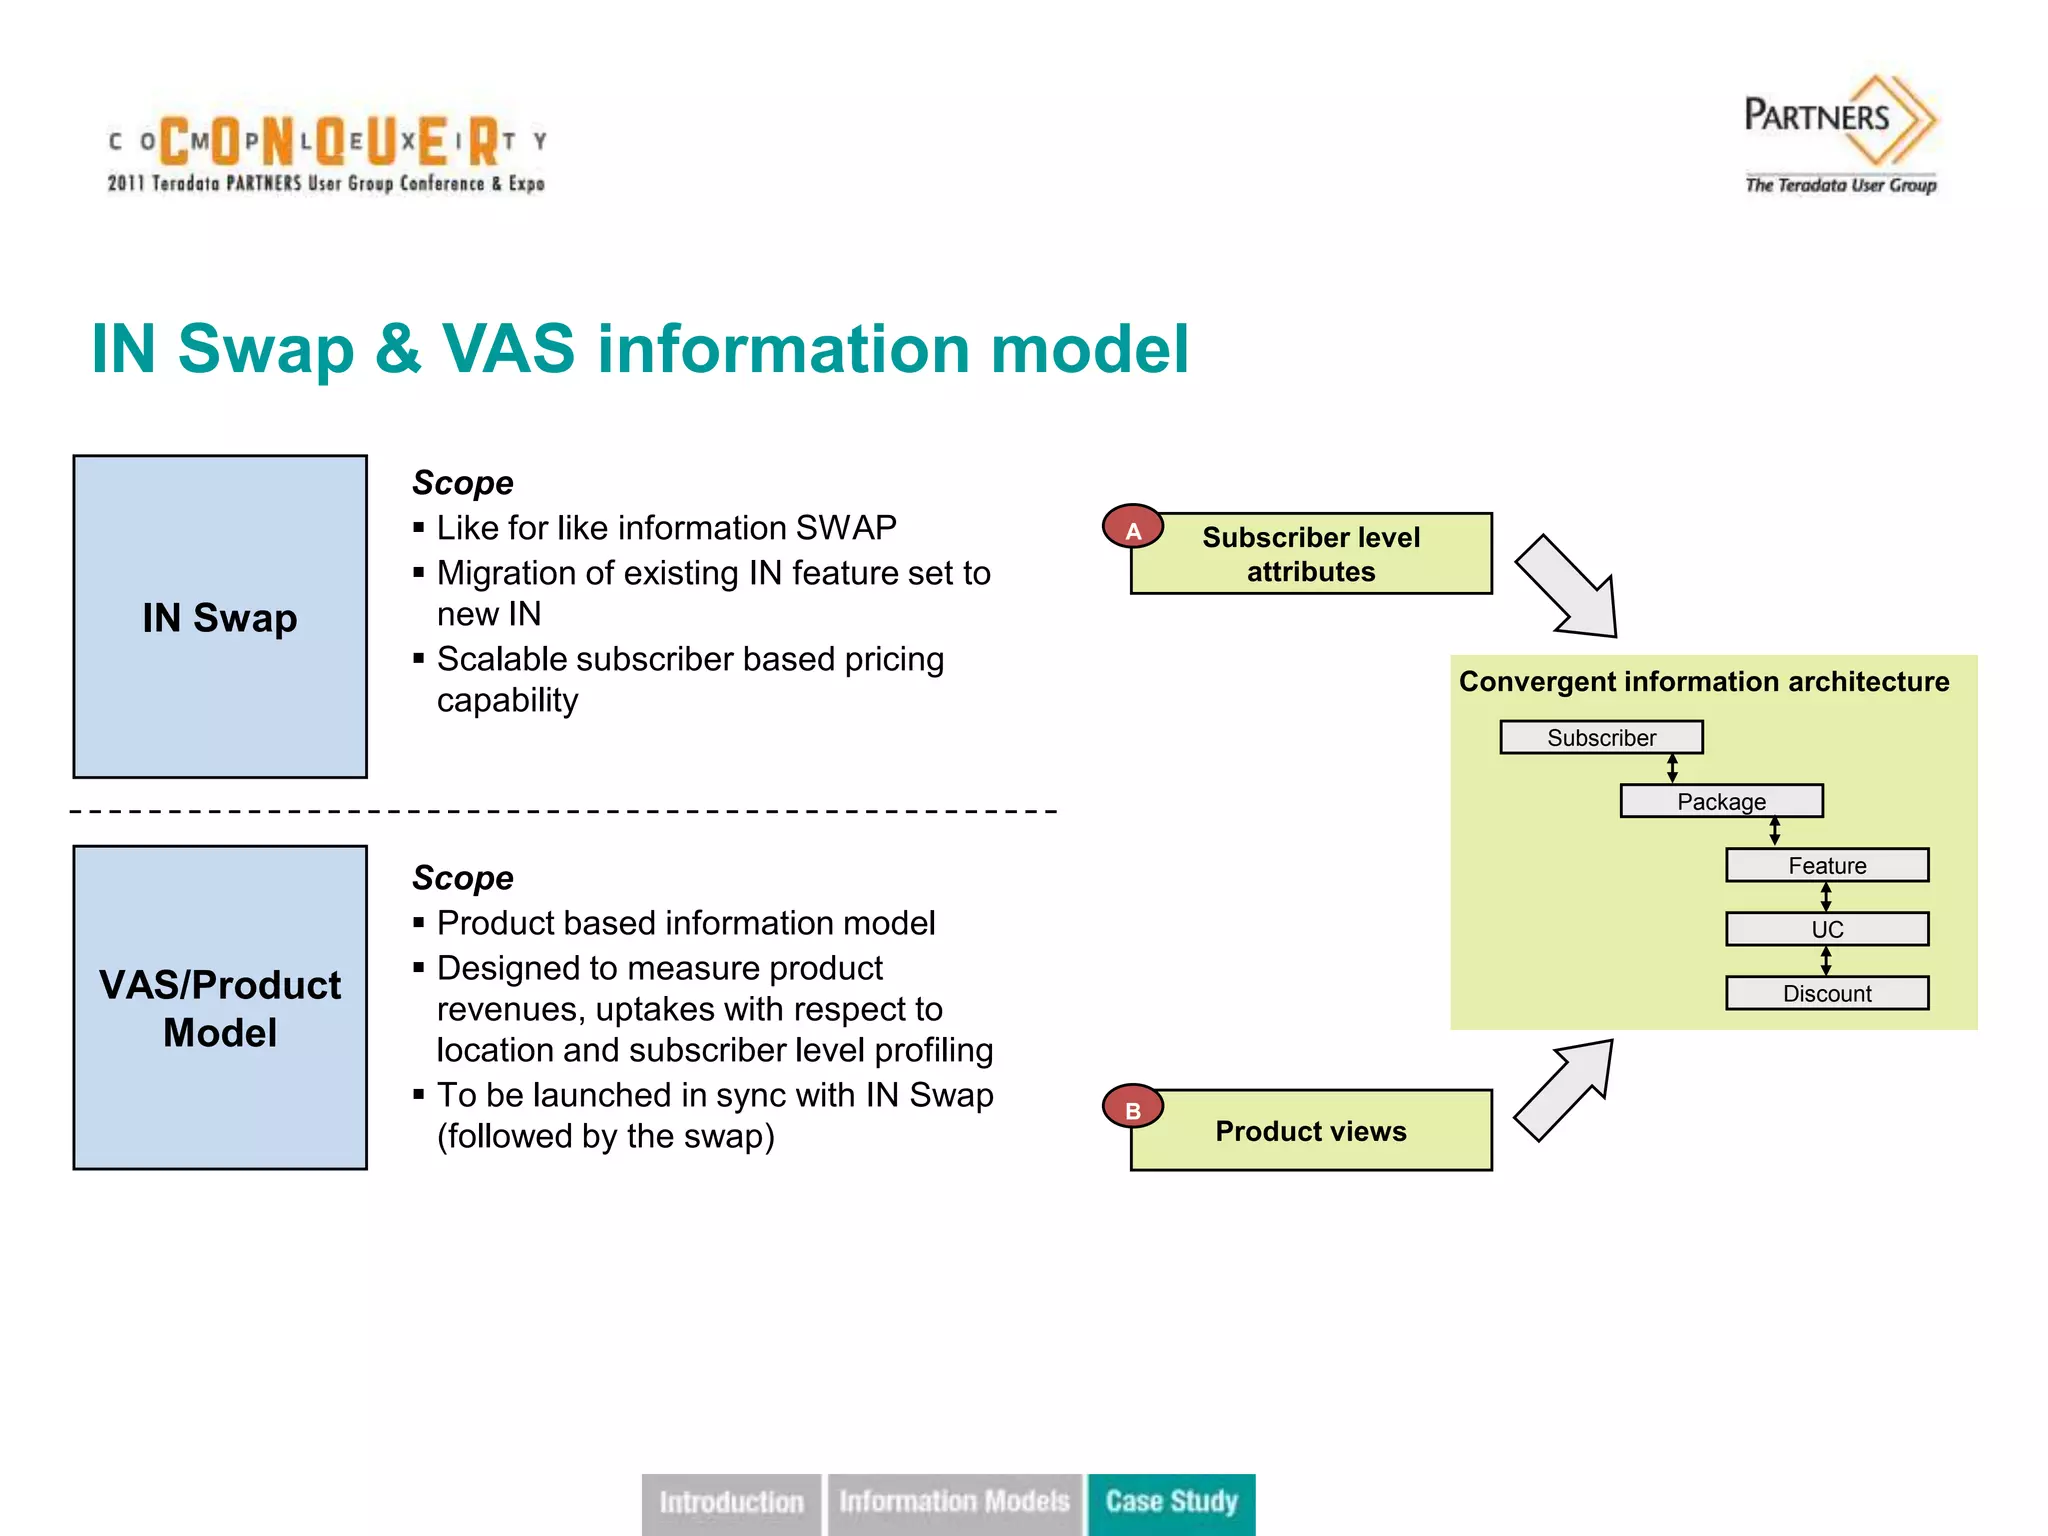
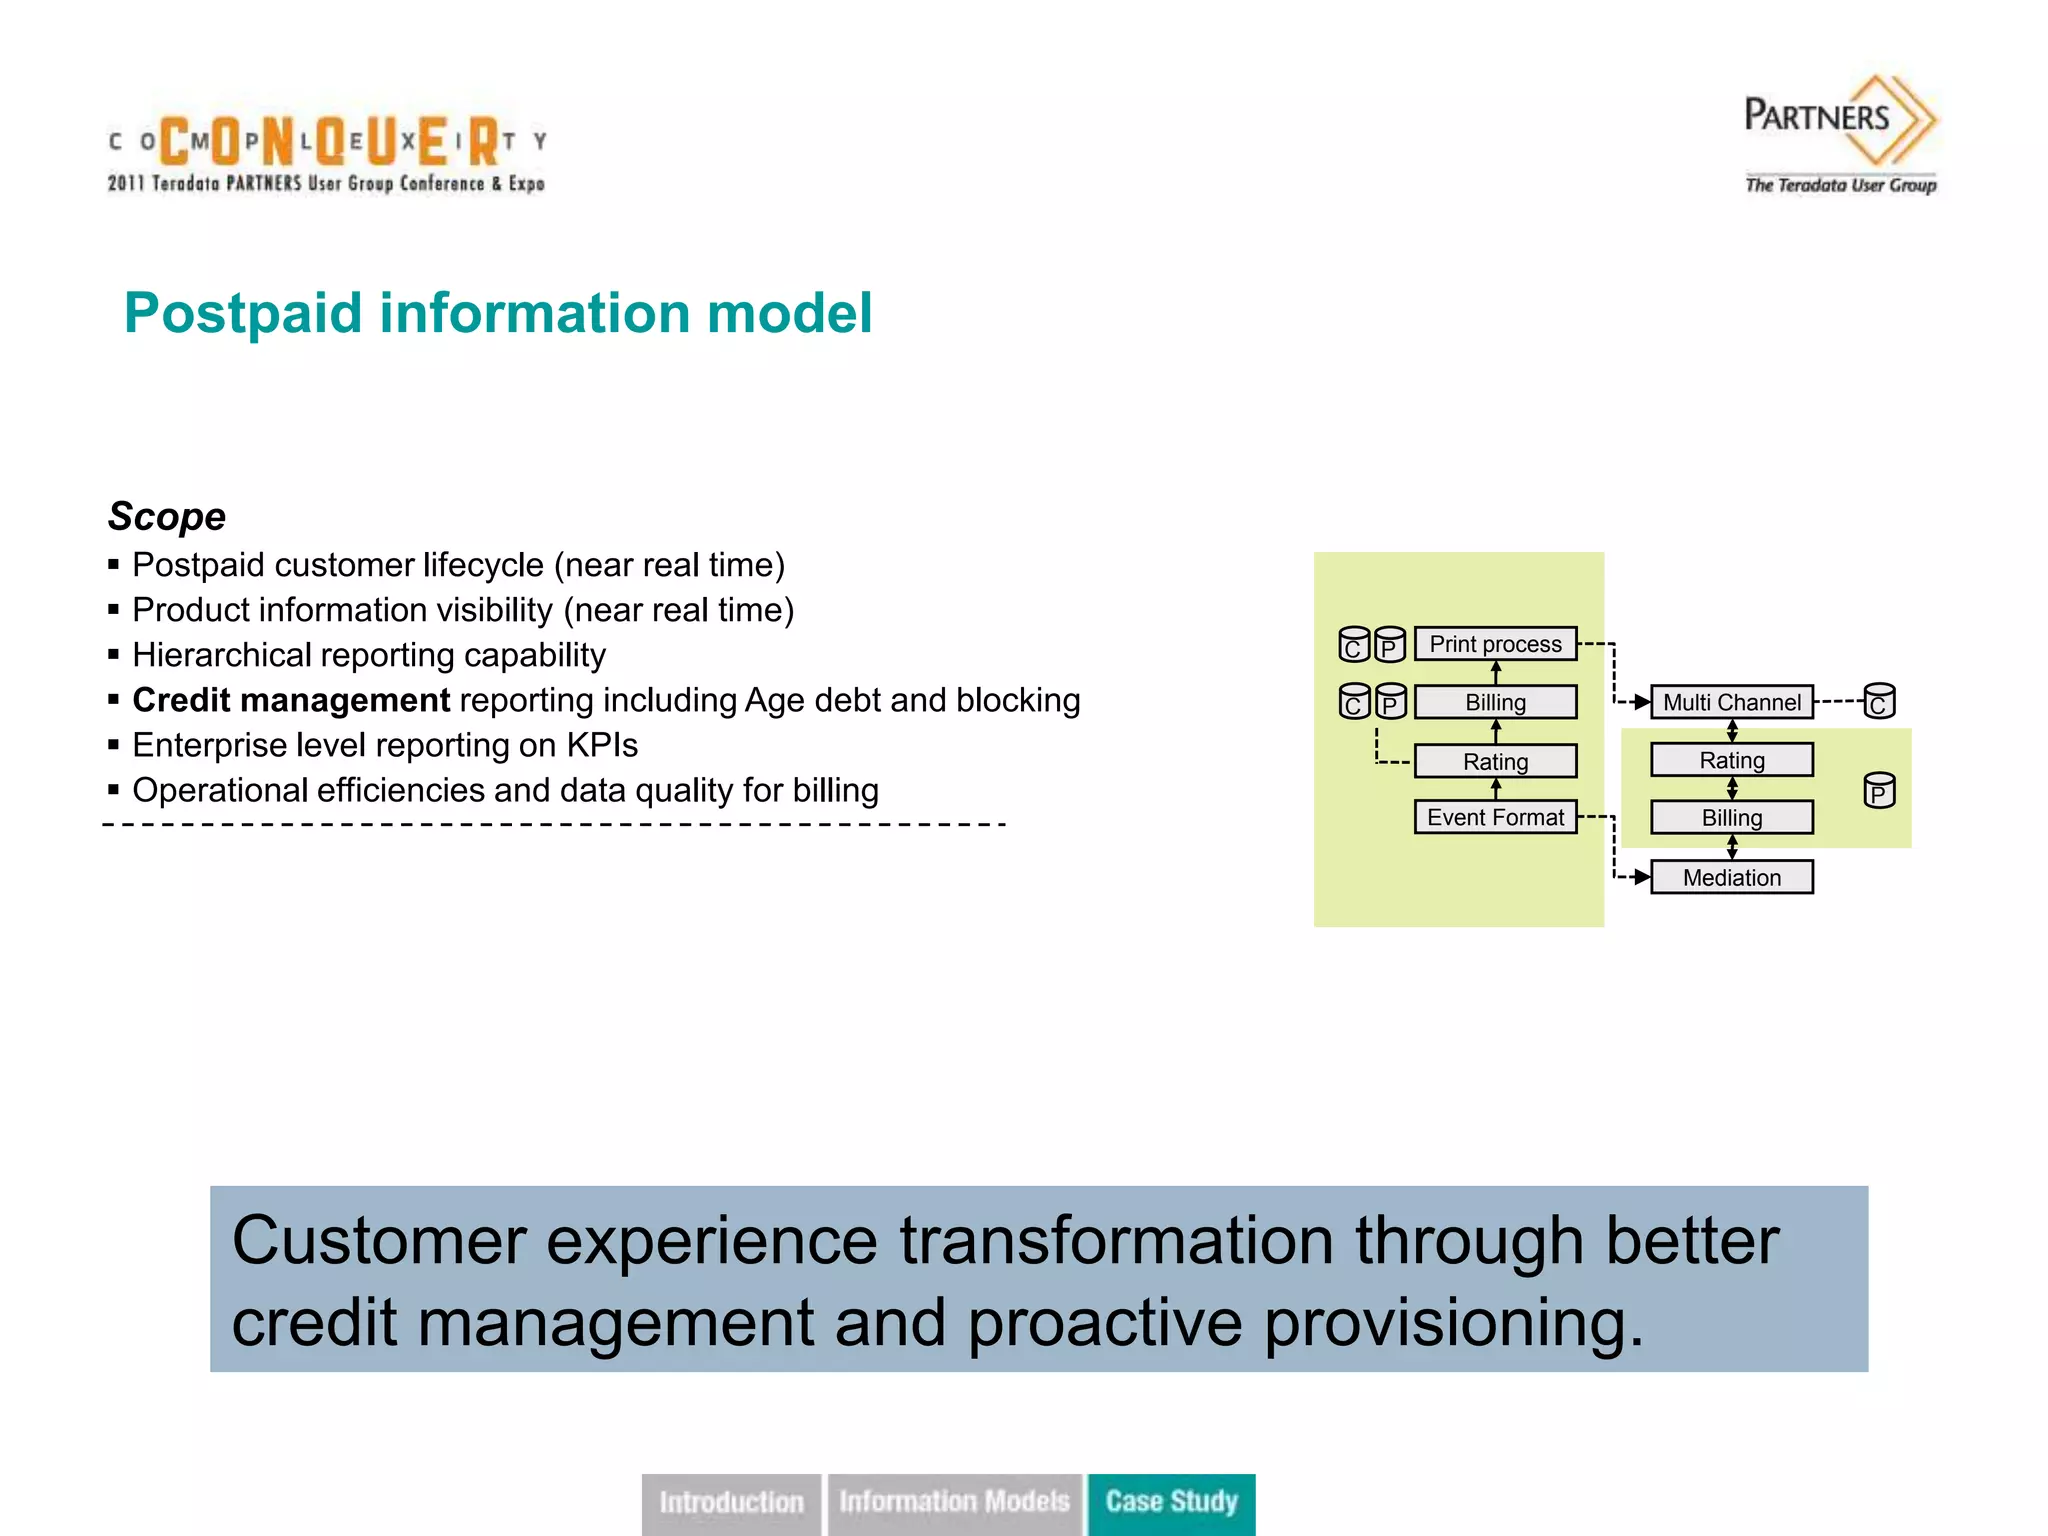
Information Models
Delivering agile, high impact BI


Ehtisham Rao, Director BI/Billing
Mobilink, Pakistan
Business group or
Next level of improvement? The                                                                                     BICC to be formed
                                                                                                                    to lead business
                                                                                                              Information initiative.
                                                                                                                      side Models
user layer         Top Down Approach; User centered
                   information Models built on context and
                                                                                                              - User Driven
                                objective driven requirements                                                 - Contextual
                                                                                                              - Predictive Analytics


                                                                                                                      Visualization
                                                                  PRESENTATION LAYER                                     Rules


                                                                                                                      Context Maps
                                                  Sales         Segments          Customer          MCOM/
                                                                                    Care            Others…
                                                                                                                       Controlled
              User                                                                                                     Vocabulary


                                                                                                                        Business
                                                 VOMS
                                                                  Semantic data layer                                    Rules


                                                                                                                      Formalization
            BI Layer                            Postpaid           Revenue              Analytics
                                                                                                                      Contextualize


                                                 Daily /         ADSs for Data          POS/RI            Mediation
                                                Monthly            Mining               (eFiCs)             Data
                                               Aggregates


       Data Layer/ DWH                           Billing/
                                                Charging
                                                                 CRM / Sales             VOMS           Other Source
                                                                                                          Systems
                                                  CDR
A look at the proposed Architecture
                                                              User defined information Architecture (terms,
                                                              dimensions, relevance, context)


                                                              Models target ‘organizational’ dimensions to enable
                                                              atomic contexts and rules


                                                              Semantic layer allows data to business object
                                                              correlation, sanity checks, rules and visualization
  VAS IM   Postpaid IM   Products IM   Analytics   Sales IM


                                                              Data Warehouse Architecture


 Data Warehouse Infrastructure (ETL & Sourcing)                         What information to source?
                                                                        Which system to source it from?
                                                                        What Rules to apply?
 Business /ETL Rules
User Experience Design
is the key
The top down design
approach
Mental Model
Alignment
               Mental model with
               above the line design
               grouping user tasks
               into conceptual
               groups


               Semantic data model
               broken down into
               business data objects
The UXD Deliverables
Case- sales information model
Daily KPI
              Daily Sales                        comparison at
               Volumes      Nationwide View       National and
                                                 Regional Level


  buying power of                Variance from            Retailer class
customers based on               previous week           measures their
recharge sales in the                                    selling potential
     past week
Summary Ticker
                                       Regional View
                                                                   Market float
                       quantitative           Regional Sales   indicates the stock
                          KPIs.                                  available in the
                                                Volumes
                                                                     market.


                                               Hourly sales
  Regions MTD             Weekly Journey                       Top 60 Franchises
                                                trends for
achievement with          Plan compliance.                       Nationwide by
                                             regional demand        Region.
respect to targets
                                                 pockets
Visible improvement
Some tips …
IN Swap & VAS information model
              Scope
               Like for like information SWAP            A   Subscriber level
               Migration of existing IN feature set to         attributes
 IN Swap        new IN
               Scalable subscriber based pricing
                                                                                 Convergent information architecture
                capability
                                                                                       Subscriber

                                                                                                    Package

                                                                                                              Feature
              Scope
               Product based information model                                                                 UC
               Designed to measure product
VAS/Product                                                                                                   Discount
                revenues, uptakes with respect to
  Model         location and subscriber level profiling
               To be launched in sync with IN Swap       B
                (followed by the swap)                        Product views
Postpaid information model


Scope
   Postpaid customer lifecycle (near real time)
   Product information visibility (near real time)
   Hierarchical reporting capability                             C P   Print process

   Credit management reporting including Age debt and blocking   C P      Billing      Multi Channel   C
   Enterprise level reporting on KPIs                                     Rating          Rating
   Operational efficiencies and data quality for billing                                               P
                                                                        Event Format       Billing

                                                                                         Mediation


          Customer experience transformation through better
          credit management and proactive provisioning.
Thank you.
I’d love to take your questions.
Twitter: @erao
Blog: www.aeracture.com

Infomation models for agile bi

  • 1.
    Information Models Delivering agile,high impact BI Ehtisham Rao, Director BI/Billing Mobilink, Pakistan
  • 8.
    Business group or Nextlevel of improvement? The BICC to be formed to lead business Information initiative. side Models user layer Top Down Approach; User centered information Models built on context and - User Driven objective driven requirements - Contextual - Predictive Analytics Visualization PRESENTATION LAYER Rules Context Maps Sales Segments Customer MCOM/ Care Others… Controlled User Vocabulary Business VOMS Semantic data layer Rules Formalization BI Layer Postpaid Revenue Analytics Contextualize Daily / ADSs for Data POS/RI Mediation Monthly Mining (eFiCs) Data Aggregates Data Layer/ DWH Billing/ Charging CRM / Sales VOMS Other Source Systems CDR
  • 9.
    A look atthe proposed Architecture User defined information Architecture (terms, dimensions, relevance, context) Models target ‘organizational’ dimensions to enable atomic contexts and rules Semantic layer allows data to business object correlation, sanity checks, rules and visualization VAS IM Postpaid IM Products IM Analytics Sales IM Data Warehouse Architecture Data Warehouse Infrastructure (ETL & Sourcing) What information to source? Which system to source it from? What Rules to apply? Business /ETL Rules
  • 10.
  • 11.
    The top downdesign approach
  • 12.
    Mental Model Alignment Mental model with above the line design grouping user tasks into conceptual groups Semantic data model broken down into business data objects
  • 13.
  • 15.
  • 17.
    Daily KPI Daily Sales comparison at Volumes Nationwide View National and Regional Level buying power of Variance from Retailer class customers based on previous week measures their recharge sales in the selling potential past week
  • 18.
    Summary Ticker Regional View Market float quantitative Regional Sales indicates the stock KPIs. available in the Volumes market. Hourly sales Regions MTD Weekly Journey Top 60 Franchises trends for achievement with Plan compliance. Nationwide by regional demand Region. respect to targets pockets
  • 20.
  • 22.
  • 23.
    IN Swap &VAS information model Scope  Like for like information SWAP A Subscriber level  Migration of existing IN feature set to attributes IN Swap new IN  Scalable subscriber based pricing Convergent information architecture capability Subscriber Package Feature Scope  Product based information model UC  Designed to measure product VAS/Product Discount revenues, uptakes with respect to Model location and subscriber level profiling  To be launched in sync with IN Swap B (followed by the swap) Product views
  • 24.
    Postpaid information model Scope  Postpaid customer lifecycle (near real time)  Product information visibility (near real time)  Hierarchical reporting capability C P Print process  Credit management reporting including Age debt and blocking C P Billing Multi Channel C  Enterprise level reporting on KPIs Rating Rating  Operational efficiencies and data quality for billing P Event Format Billing Mediation Customer experience transformation through better credit management and proactive provisioning.
  • 25.
    Thank you. I’d loveto take your questions. Twitter: @erao Blog: www.aeracture.com

Editor's Notes

  • #3 Fixed
  • #4 done
  • #5 Double checked and corrected
  • #6 See if it s ok now, stickies can be scaled and movedseperately if you want
  • #7 Quotation marks look incorrectly placed, can you check consistency since the start quotes are inverted whereas the closing quotes should be inverted….. Also kindly check consistency of the dotted line as they are pointing differently at targets…..let the bottom line items (one with crosses) appear after everything…..in the end. Fixed errors
  • #12 Make green box appear as default. Then animate “Align MM & SDM” and then in the end animate the last box “IA & ….” Done
  • #14 Looks ok except the headings seem to be out of place and there are two of them, one in black and the other in orange…. Placed inside the boxes
  • #16 It was regional in the given file, changed the colors, fixed quote errors.Text spaces in the quotes need to be fixed for example in the top box, on left aregional should be a regional. The VP sales quote is also not complete….use region in his quote rather than regional….also in the director distribution it should be region not regional. Let me know if there is an issue with the text I provided by sending me the file….
  • #17 Feel free to redesign
  • #18 Call outs are editable
  • #20 I cud not open the file do more.I have attached this picture, you can resize it to read easily. There are three sections which I have corner shaded (top left) to identify. Within each section there are scores presented. You can design them according to our template on this page. Please do not use the order I have provided and also don’t use the scale I have provided so you can read the content easily. Feel free to gel these in with the rest of the presentation on size color etc. also please use the do more picture with the result boxes for this slide if possible. the do more picture is attached with the email
  • #22 This is a copied slide and I need to use the scale from the next slide (image) in this style. You will need to use the top scale (2-10 instead of 6-10 here as shown in the next slide). you have to use the text on the right of the arrow in this slide as that has been modified for our presentation however the rest of the information will come from the image in the next slide.
  • #24 Leave this slide as it is as I will tweak it before the speech
  • #25 Leave this slide as it is. I will tweak it before the conference..