5 THINGS TO KNOW ABOUT U.S. OCTOBER PERFORMANCE DATA
•
0 likes•138 views

The United States hotel industry enjoyed another month of impressive performance. Here are five things to know about October data from STR, parent company of Hotel News Now.
Report
Share
Report
Share
Download to read offline
Recommended
5 THINGS TO KNOW ABOUT U.S. AUGUST PERFORMANCE DATA
Revenue-per-available-room growth for the United States hotel industry slowed during August. But Jan Freitag, senior VP of lodging insights for HNN’s parent company STR, said that’s partly because Labor Day weekend wasn’t during the same week as last year, and it also wasn’t even in the same month. Here are five things you need to know about August’s data.
5 THINGS TO KNOW ABOUT US JUNE PERFORMANCE DATA
With revenue per available room now growing for 64 months, June was another good month for the U.S. hotel industry, according to an analysis by STR’s Jan Freitag. Here are five things you need to know about the data.
HOLIDAY 2015 TRAVEL PREDICTION
With the holidays rapidly approaching, trends from hotel bookings from 2014 through the third quarter of 2015 are predictive of patterns this coming season. The good news is that there is still time to influence holiday travelers who are in pre-purchase mode, according to a data report from Adara.
10 ways to improve your hotel’s Pinterest strategy
Hotel marketers should consider Pinterest a priority since it plays a key role at both the aspirational and planning stages of the travel-decision-making process.
HOTEL MANAGEMENT SOFTWARE PURCHASE TRENDS
What do hoteliers want out of their hotel management software? Data was randomly collected from 385 hoteliers from April 2014 through June 2015 to find out.
JAN FREITAG’S 5 THINGS TO KNOW ABOUT U.S. SEPTEMBER PERFORMANCE DATA
Revenue per available room in the US hotel industry increased 8% in September, reversing the 2.2% growth seen in August. The Labor Day calendar shift positively impacted September numbers, unlike the effect of the August calendar shift. The forecast for annual revenue growth remains at 6.8%, implying some increase in the fourth quarter. Economy hotels increased room rates 6.3% while upper-upscale hotels grew rates 2.4%, and lower-rated chains outperformed high-end hotels.
5 THINGS TO KNOW ABOUT U.S. APRIL PERFORMANCE DATA
U.S. hotel performance indicators continued to reach all-time highs in April according to an analysis. RevPAR has now been growing for 62 consecutive months. New York City had the highest occupancy of any U.S. market at 86.9% in April. Supply growth hit a new low of +0.1% for the third straight month while three of the top 10 hottest under construction markets are located in Texas.
U.S. Branded Supply Pipeline Breakdown
Hotel supply in the United States is a hot topic of conversation. The industry had 407,413 branded guestrooms under contract
at the end of April, which represented a 18% jump over 2015 levels.
Where are those rooms going? We break down the current U.S. supply pipeline into top brand contributors and the leaders in each segment.
FREITAG'S 5 INFOGRAPHIC DECEMEBER 2014
November showed the impact a single day in calendar shift can have on the United States hotel
industry. November 2014 had one more Sunday (a low-demand day) and one less Friday (high demand)
than November 2013, resulting in the lowest demand growth since January, according to an analysis
from Jan Freitag, senior VP of strategic development for STR, parent company of HNN.
Marriott & Starwood by the numbers
Marriott International’s acquisition of Starwood Hotels & Resorts Worldwide resulted in a behemoth of 27 hotel brands.
Here’s a look at some of the numbers at play in the deal.
May Month in Review: US performance data
Jan Freitag—of “Freitag’s 5” fame—is out on paternity leave for the next two months. But that doesn’t mean the monthly U.S. data stops. Here are five things to know about May’s hotel performance data from STR, HNN’s parent company.
5 things to know about U.S. March performance data
After talking about the Easter shift and the corresponding softness in RevPAR it finally happened. Well, sort of. When you look at March’s growth versus the first two months of the year, March data was really not that bad, according to STR SVP of lodging insights Jan Freitag. Here are five things you need to know about the data.
5 THINGS TO KNOW ABOUT THE US PIPELINE
The U.S. hotel industry is seeing supply growth pick up, with the most significant spike expected to come in summer 2016, according Julie Gafney, VP of the database operations center for STR, parent company of Hotel News Now.
Social Media in Travel
Social Media in Travel. A look at Facebook and YouTube and how hoteliers use social media on a daily basis.
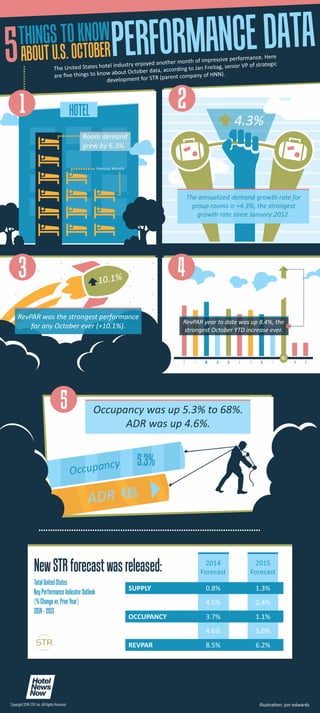
JAN FREITAG’S 5 THINGS TO KNOW ABOUT U.S. OCTOBER PERFORMANCE DATA
RevPAR growth for the US hotel industry in October was 6.5%, which is the fourth lowest for the year. While October RevPAR growth was positive, it was not as strong as in previous months despite having an extra Saturday. Five factors that influenced October hotel performance included: RevPAR growth for October being the highest since 2010; supply growth increasing for the third straight month; a lack of over 5% increases in average daily rate; and STR revising its forecasts down due to more muted RevPAR growth expected for the year.
5 things to know about Easter hotel performance
This document analyzes hotel performance data over the 2016 Easter holiday weekend. It reports that among major global markets, Kyoto, Japan and Macau, China had the highest Easter eve occupancy rates at 98.4% and 98.1% respectively. In the US, New York City and the Florida Keys had the highest Easter eve occupancy rates at 92.2% and 91.5%. Additionally, Easter eve average daily rates in the US have exceeded $100 for the past five years, with only 2008 previously reaching over $100. Globally, hotel occupancy and rates are typically higher on the Saturday before Easter than on Easter Sunday itself.
Consumers Don't Know Much About Cybersecurity
At a time when hotels need to take every precaution to avoid falling victim to a data breach and being branded as insecure, consumers don't seem to know much about the security issues that worry them.
The Biggest Hotel Companies by Market Cap
Marriott International and Hilton clearly lead the way for publicly listed hotel companies in terms of market capitalization, but both lag well behind the largest players in the overall world of travel.
3 Top Tech Trends for 2017
Sabre Labs has identified three emerging technologies that could influence the travel industry this year.
The In-Room Tech Guests Really Want
A recent survey of U.S. guests from Oracle Hospitality and Phocuswright shows that guests have strong opinions about in-room Wi-Fi. temperature and light controls, entertainment and technology-assisted housekeeping.
Jan Freitag’s 5 things to Know U.S. January Performance Data
Luxury and upper upscale hotel chains saw RevPAR growth of 7.1% and 4.3% respectively in January, driven by healthy increases in average daily rates. The inauguration of the US President led to double-digit RevPAR growth in 10 markets including Washington D.C. at 77.1%, boosting occupancy and rates. However, outside the top 25 markets, hotel occupancy remained below 50% for January.
The World's Largest
A glance at the world's largest hotel companies, brands, properties, pipelines and global markets by room count. All figures are as of December 2016, according to STR.
Some guests will share data for rewards
New research from GfK shows roughly a quarter of consumers are willing to be open with companies about their personal data if they're getting something in return.
Jan Freitag’s 5 things to Know U.S. December Performance Data
Closing out a year of both new records and disappointments, U.S. hotel performance in December was decidedly average.
New Year's Eve cocktails from around the world
Looking for a good hotel bar with great cocktails this New Year’s Eve? Look no further. Here are a few favorite cocktail recipes from hoteliers and F&B experts in NYE markets around the world.
How Corporate Travelers Use Mobile
Widespread adoption of smartphones has changed corporate travel habits, but behaviors vary between the U.S. and Europe.
Jan Freitag’s 5 things to Know U.S. October Performance Data
Key performance indicators, as expected, show the hotel industry riding out the curve in October, with RevPAR growing for the 80th straight month, but at the slowest rate this year.
5 things to know about Thanksgiving Travel
Data suggests hoteliers in top markets for Thanksgiving travel should prepare for a record number of guests this holiday weekend.
Defend against these types of data breaches
Hackers take numerous approaches to probe for and exploit weaknesses in corporate computer systems in their hunt for valuable personal and financial information.
The State of Chip and Pin Technology
A year after the launch of chip payment, businesses and consumers are still working to get a handle on the technology, while card processors say they’ve seen improvement.
More Related Content
Viewers also liked
FREITAG'S 5 INFOGRAPHIC DECEMEBER 2014
November showed the impact a single day in calendar shift can have on the United States hotel
industry. November 2014 had one more Sunday (a low-demand day) and one less Friday (high demand)
than November 2013, resulting in the lowest demand growth since January, according to an analysis
from Jan Freitag, senior VP of strategic development for STR, parent company of HNN.
Marriott & Starwood by the numbers
Marriott International’s acquisition of Starwood Hotels & Resorts Worldwide resulted in a behemoth of 27 hotel brands.
Here’s a look at some of the numbers at play in the deal.
May Month in Review: US performance data
Jan Freitag—of “Freitag’s 5” fame—is out on paternity leave for the next two months. But that doesn’t mean the monthly U.S. data stops. Here are five things to know about May’s hotel performance data from STR, HNN’s parent company.
5 things to know about U.S. March performance data
After talking about the Easter shift and the corresponding softness in RevPAR it finally happened. Well, sort of. When you look at March’s growth versus the first two months of the year, March data was really not that bad, according to STR SVP of lodging insights Jan Freitag. Here are five things you need to know about the data.
5 THINGS TO KNOW ABOUT THE US PIPELINE
The U.S. hotel industry is seeing supply growth pick up, with the most significant spike expected to come in summer 2016, according Julie Gafney, VP of the database operations center for STR, parent company of Hotel News Now.
Social Media in Travel
Social Media in Travel. A look at Facebook and YouTube and how hoteliers use social media on a daily basis.
JAN FREITAG’S 5 THINGS TO KNOW ABOUT U.S. OCTOBER PERFORMANCE DATA
RevPAR growth for the US hotel industry in October was 6.5%, which is the fourth lowest for the year. While October RevPAR growth was positive, it was not as strong as in previous months despite having an extra Saturday. Five factors that influenced October hotel performance included: RevPAR growth for October being the highest since 2010; supply growth increasing for the third straight month; a lack of over 5% increases in average daily rate; and STR revising its forecasts down due to more muted RevPAR growth expected for the year.
Viewers also liked (7)
5 things to know about U.S. March performance data
5 things to know about U.S. March performance data
JAN FREITAG’S 5 THINGS TO KNOW ABOUT U.S. OCTOBER PERFORMANCE DATA
JAN FREITAG’S 5 THINGS TO KNOW ABOUT U.S. OCTOBER PERFORMANCE DATA
More from HOTEL NEWS NOW (STR)
5 things to know about Easter hotel performance
This document analyzes hotel performance data over the 2016 Easter holiday weekend. It reports that among major global markets, Kyoto, Japan and Macau, China had the highest Easter eve occupancy rates at 98.4% and 98.1% respectively. In the US, New York City and the Florida Keys had the highest Easter eve occupancy rates at 92.2% and 91.5%. Additionally, Easter eve average daily rates in the US have exceeded $100 for the past five years, with only 2008 previously reaching over $100. Globally, hotel occupancy and rates are typically higher on the Saturday before Easter than on Easter Sunday itself.
Consumers Don't Know Much About Cybersecurity
At a time when hotels need to take every precaution to avoid falling victim to a data breach and being branded as insecure, consumers don't seem to know much about the security issues that worry them.
The Biggest Hotel Companies by Market Cap
Marriott International and Hilton clearly lead the way for publicly listed hotel companies in terms of market capitalization, but both lag well behind the largest players in the overall world of travel.
3 Top Tech Trends for 2017
Sabre Labs has identified three emerging technologies that could influence the travel industry this year.
The In-Room Tech Guests Really Want
A recent survey of U.S. guests from Oracle Hospitality and Phocuswright shows that guests have strong opinions about in-room Wi-Fi. temperature and light controls, entertainment and technology-assisted housekeeping.
Jan Freitag’s 5 things to Know U.S. January Performance Data
Luxury and upper upscale hotel chains saw RevPAR growth of 7.1% and 4.3% respectively in January, driven by healthy increases in average daily rates. The inauguration of the US President led to double-digit RevPAR growth in 10 markets including Washington D.C. at 77.1%, boosting occupancy and rates. However, outside the top 25 markets, hotel occupancy remained below 50% for January.
The World's Largest
A glance at the world's largest hotel companies, brands, properties, pipelines and global markets by room count. All figures are as of December 2016, according to STR.
Some guests will share data for rewards
New research from GfK shows roughly a quarter of consumers are willing to be open with companies about their personal data if they're getting something in return.
Jan Freitag’s 5 things to Know U.S. December Performance Data
Closing out a year of both new records and disappointments, U.S. hotel performance in December was decidedly average.
New Year's Eve cocktails from around the world
Looking for a good hotel bar with great cocktails this New Year’s Eve? Look no further. Here are a few favorite cocktail recipes from hoteliers and F&B experts in NYE markets around the world.
How Corporate Travelers Use Mobile
Widespread adoption of smartphones has changed corporate travel habits, but behaviors vary between the U.S. and Europe.
Jan Freitag’s 5 things to Know U.S. October Performance Data
Key performance indicators, as expected, show the hotel industry riding out the curve in October, with RevPAR growing for the 80th straight month, but at the slowest rate this year.
5 things to know about Thanksgiving Travel
Data suggests hoteliers in top markets for Thanksgiving travel should prepare for a record number of guests this holiday weekend.
Defend against these types of data breaches
Hackers take numerous approaches to probe for and exploit weaknesses in corporate computer systems in their hunt for valuable personal and financial information.
The State of Chip and Pin Technology
A year after the launch of chip payment, businesses and consumers are still working to get a handle on the technology, while card processors say they’ve seen improvement.
Jan Freitag’s 5 things to Know U.S. August Performance Data
As supply continues to increase and widen its lead over demand, the U.S. hotel industry reported continued occupancy declines, as occupancy fell 0.4% in August. Jan Freitag, SVP of lodging insights at STR, HNN’s parent company, gives his take on how the chain scales performed, which markets show above-average supply growth and more.
Expectations for mobile
A recent survey of executives from Open Mobile Media shows how the business community expects to prioritize mobile development.
Mobile is Everywhere for Hotel Guests
Mobile devices like smartphones are ranked as the most important travel accessory, and potential guests use them to book travel in various situations, according to data from Hotels.com.
Utilities & Labor Costs at a glance
The 2016 HOST Almanac indicates utility costs were down across the country in 2015 and were particularly low in the central regions. Labor costs are poised to increase in many markets over the next few years. Data from the 2016 HOST Almanac shows the regions with the highest labor costs were the Mid-Atlantic, Paci c and East North Central.
5 Takeaways from June’s U.S. Performance Data
The hotel industry has reached the halfway point in 2016 as the current cycle continues to unwind. Here’s a look at five things to know about June’s hotel performance data from STR, HNN’s parent company.
More from HOTEL NEWS NOW (STR) (20)
Jan Freitag’s 5 things to Know U.S. January Performance Data
Jan Freitag’s 5 things to Know U.S. January Performance Data
Jan Freitag’s 5 things to Know U.S. December Performance Data
Jan Freitag’s 5 things to Know U.S. December Performance Data
Jan Freitag’s 5 things to Know U.S. October Performance Data
Jan Freitag’s 5 things to Know U.S. October Performance Data
Jan Freitag’s 5 things to Know U.S. August Performance Data
Jan Freitag’s 5 things to Know U.S. August Performance Data
Recently uploaded
一比一原版(uom毕业证书)曼彻斯特大学毕业证如何办理
原版一模一样【微信:741003700 】【(uom毕业证书)曼彻斯特大学毕业证成绩单】【微信:741003700 】学位证,留信认证(真实可查,永久存档)原件一模一样纸张工艺/offer、雅思、外壳等材料/诚信可靠,可直接看成品样本,帮您解决无法毕业带来的各种难题!外壳,原版制作,诚信可靠,可直接看成品样本。行业标杆!精益求精,诚心合作,真诚制作!多年品质 ,按需精细制作,24小时接单,全套进口原装设备。十五年致力于帮助留学生解决难题,包您满意。
本公司拥有海外各大学样板无数,能完美还原。
1:1完美还原海外各大学毕业材料上的工艺:水印,阴影底纹,钢印LOGO烫金烫银,LOGO烫金烫银复合重叠。文字图案浮雕、激光镭射、紫外荧光、温感、复印防伪等防伪工艺。材料咨询办理、认证咨询办理请加学历顾问Q/微741003700
【主营项目】
一.毕业证【q微741003700】成绩单、使馆认证、教育部认证、雅思托福成绩单、学生卡等!
二.真实使馆公证(即留学回国人员证明,不成功不收费)
三.真实教育部学历学位认证(教育部存档!教育部留服网站永久可查)
四.办理各国各大学文凭(一对一专业服务,可全程监控跟踪进度)
如果您处于以下几种情况:
◇在校期间,因各种原因未能顺利毕业……拿不到官方毕业证【q/微741003700】
◇面对父母的压力,希望尽快拿到;
◇不清楚认证流程以及材料该如何准备;
◇回国时间很长,忘记办理;
◇回国马上就要找工作,办给用人单位看;
◇企事业单位必须要求办理的
◇需要报考公务员、购买免税车、落转户口
◇申请留学生创业基金
留信网认证的作用:
1:该专业认证可证明留学生真实身份
2:同时对留学生所学专业登记给予评定
3:国家专业人才认证中心颁发入库证书
4:这个认证书并且可以归档倒地方
5:凡事获得留信网入网的信息将会逐步更新到个人身份内,将在公安局网内查询个人身份证信息后,同步读取人才网入库信息
6:个人职称评审加20分
7:个人信誉贷款加10分
8:在国家人才网主办的国家网络招聘大会中纳入资料,供国家高端企业选择人才
办理(uom毕业证书)曼彻斯特大学毕业证【微信:741003700 】外观非常简单,由纸质材料制成,上面印有校徽、校名、毕业生姓名、专业等信息。
办理(uom毕业证书)曼彻斯特大学毕业证【微信:741003700 】格式相对统一,各专业都有相应的模板。通常包括以下部分:
校徽:象征着学校的荣誉和传承。
校名:学校英文全称
授予学位:本部分将注明获得的具体学位名称。
毕业生姓名:这是最重要的信息之一,标志着该证书是由特定人员获得的。
颁发日期:这是毕业正式生效的时间,也代表着毕业生学业的结束。
其他信息:根据不同的专业和学位,可能会有一些特定的信息或章节。
办理(uom毕业证书)曼彻斯特大学毕业证【微信:741003700 】价值很高,需要妥善保管。一般来说,应放置在安全、干燥、防潮的地方,避免长时间暴露在阳光下。如需使用,最好使用复印件而不是原件,以免丢失。
综上所述,办理(uom毕业证书)曼彻斯特大学毕业证【微信:741003700 】是证明身份和学历的高价值文件。外观简单庄重,格式统一,包括重要的个人信息和发布日期。对持有人来说,妥善保管是非常重要的。
PyData London 2024: Mistakes were made (Dr. Rebecca Bilbro)
To honor ten years of PyData London, join Dr. Rebecca Bilbro as she takes us back in time to reflect on a little over ten years working as a data scientist. One of the many renegade PhDs who joined the fledgling field of data science of the 2010's, Rebecca will share lessons learned the hard way, often from watching data science projects go sideways and learning to fix broken things. Through the lens of these canon events, she'll identify some of the anti-patterns and red flags she's learned to steer around.
[VCOSA] Monthly Report - Cotton & Yarn Statistics May 2024
We are pleased to share with you the latest VCOSA statistical report on the cotton and yarn industry for the month of May 2024.
Starting from January 2024, the full weekly and monthly reports will only be available for free to VCOSA members. To access the complete weekly report with figures, charts, and detailed analysis of the cotton fiber market in the past week, interested parties are kindly requested to contact VCOSA to subscribe to the newsletter.
06-18-2024-Princeton Meetup-Introduction to Milvus
06-18-2024-Princeton Meetup-Introduction to Milvus
tim.spann@zilliz.com
https://www.linkedin.com/in/timothyspann/
https://x.com/paasdev
https://github.com/tspannhw
https://github.com/milvus-io/milvus
Get Milvused!
https://milvus.io/
Read my Newsletter every week!
https://github.com/tspannhw/FLiPStackWeekly/blob/main/142-17June2024.md
For more cool Unstructured Data, AI and Vector Database videos check out the Milvus vector database videos here
https://www.youtube.com/@MilvusVectorDatabase/videos
Unstructured Data Meetups -
https://www.meetup.com/unstructured-data-meetup-new-york/
https://lu.ma/calendar/manage/cal-VNT79trvj0jS8S7
https://www.meetup.com/pro/unstructureddata/
https://zilliz.com/community/unstructured-data-meetup
https://zilliz.com/event
Twitter/X: https://x.com/milvusio https://x.com/paasdev
LinkedIn: https://www.linkedin.com/company/zilliz/ https://www.linkedin.com/in/timothyspann/
GitHub: https://github.com/milvus-io/milvus https://github.com/tspannhw
Invitation to join Discord: https://discord.com/invite/FjCMmaJng6
Blogs: https://milvusio.medium.com/ https://www.opensourcevectordb.cloud/ https://medium.com/@tspann
Expand LLMs' knowledge by incorporating external data sources into LLMs and your AI applications.
[VCOSA] Monthly Report - Cotton & Yarn Statistics March 2024
We are pleased to share with you the latest VCOSA statistical report on the cotton and yarn industry for the month of March 2024.
Starting from January 2024, the full weekly and monthly reports will only be available for free to VCOSA members. To access the complete weekly report with figures, charts, and detailed analysis of the cotton fiber market in the past week, interested parties are kindly requested to contact VCOSA to subscribe to the newsletter.
一比一原版悉尼大学毕业证如何办理
原版一模一样【微信:741003700 】【悉尼大学毕业证成绩单】【微信:741003700 】学位证,留信认证(真实可查,永久存档)原件一模一样纸张工艺/offer、雅思、外壳等材料/诚信可靠,可直接看成品样本,帮您解决无法毕业带来的各种难题!外壳,原版制作,诚信可靠,可直接看成品样本。行业标杆!精益求精,诚心合作,真诚制作!多年品质 ,按需精细制作,24小时接单,全套进口原装设备。十五年致力于帮助留学生解决难题,包您满意。
本公司拥有海外各大学样板无数,能完美还原。
1:1完美还原海外各大学毕业材料上的工艺:水印,阴影底纹,钢印LOGO烫金烫银,LOGO烫金烫银复合重叠。文字图案浮雕、激光镭射、紫外荧光、温感、复印防伪等防伪工艺。材料咨询办理、认证咨询办理请加学历顾问Q/微741003700
【主营项目】
一.毕业证【q微741003700】成绩单、使馆认证、教育部认证、雅思托福成绩单、学生卡等!
二.真实使馆公证(即留学回国人员证明,不成功不收费)
三.真实教育部学历学位认证(教育部存档!教育部留服网站永久可查)
四.办理各国各大学文凭(一对一专业服务,可全程监控跟踪进度)
如果您处于以下几种情况:
◇在校期间,因各种原因未能顺利毕业……拿不到官方毕业证【q/微741003700】
◇面对父母的压力,希望尽快拿到;
◇不清楚认证流程以及材料该如何准备;
◇回国时间很长,忘记办理;
◇回国马上就要找工作,办给用人单位看;
◇企事业单位必须要求办理的
◇需要报考公务员、购买免税车、落转户口
◇申请留学生创业基金
留信网认证的作用:
1:该专业认证可证明留学生真实身份
2:同时对留学生所学专业登记给予评定
3:国家专业人才认证中心颁发入库证书
4:这个认证书并且可以归档倒地方
5:凡事获得留信网入网的信息将会逐步更新到个人身份内,将在公安局网内查询个人身份证信息后,同步读取人才网入库信息
6:个人职称评审加20分
7:个人信誉贷款加10分
8:在国家人才网主办的国家网络招聘大会中纳入资料,供国家高端企业选择人才
办理悉尼大学毕业证【微信:741003700 】外观非常简单,由纸质材料制成,上面印有校徽、校名、毕业生姓名、专业等信息。
办理悉尼大学毕业证【微信:741003700 】格式相对统一,各专业都有相应的模板。通常包括以下部分:
校徽:象征着学校的荣誉和传承。
校名:学校英文全称
授予学位:本部分将注明获得的具体学位名称。
毕业生姓名:这是最重要的信息之一,标志着该证书是由特定人员获得的。
颁发日期:这是毕业正式生效的时间,也代表着毕业生学业的结束。
其他信息:根据不同的专业和学位,可能会有一些特定的信息或章节。
办理悉尼大学毕业证【微信:741003700 】价值很高,需要妥善保管。一般来说,应放置在安全、干燥、防潮的地方,避免长时间暴露在阳光下。如需使用,最好使用复印件而不是原件,以免丢失。
综上所述,办理悉尼大学毕业证【微信:741003700 】是证明身份和学历的高价值文件。外观简单庄重,格式统一,包括重要的个人信息和发布日期。对持有人来说,妥善保管是非常重要的。
一比一原版爱尔兰都柏林大学毕业证(本硕)ucd学位证书如何办理
原版一模一样【微信:741003700 】【爱尔兰都柏林大学毕业证(本硕)ucd成绩单】【微信:741003700 】学位证,留信认证(真实可查,永久存档)原件一模一样纸张工艺/offer、雅思、外壳等材料/诚信可靠,可直接看成品样本,帮您解决无法毕业带来的各种难题!外壳,原版制作,诚信可靠,可直接看成品样本。行业标杆!精益求精,诚心合作,真诚制作!多年品质 ,按需精细制作,24小时接单,全套进口原装设备。十五年致力于帮助留学生解决难题,包您满意。
本公司拥有海外各大学样板无数,能完美还原。
1:1完美还原海外各大学毕业材料上的工艺:水印,阴影底纹,钢印LOGO烫金烫银,LOGO烫金烫银复合重叠。文字图案浮雕、激光镭射、紫外荧光、温感、复印防伪等防伪工艺。材料咨询办理、认证咨询办理请加学历顾问Q/微741003700
【主营项目】
一.毕业证【q微741003700】成绩单、使馆认证、教育部认证、雅思托福成绩单、学生卡等!
二.真实使馆公证(即留学回国人员证明,不成功不收费)
三.真实教育部学历学位认证(教育部存档!教育部留服网站永久可查)
四.办理各国各大学文凭(一对一专业服务,可全程监控跟踪进度)
如果您处于以下几种情况:
◇在校期间,因各种原因未能顺利毕业……拿不到官方毕业证【q/微741003700】
◇面对父母的压力,希望尽快拿到;
◇不清楚认证流程以及材料该如何准备;
◇回国时间很长,忘记办理;
◇回国马上就要找工作,办给用人单位看;
◇企事业单位必须要求办理的
◇需要报考公务员、购买免税车、落转户口
◇申请留学生创业基金
留信网认证的作用:
1:该专业认证可证明留学生真实身份
2:同时对留学生所学专业登记给予评定
3:国家专业人才认证中心颁发入库证书
4:这个认证书并且可以归档倒地方
5:凡事获得留信网入网的信息将会逐步更新到个人身份内,将在公安局网内查询个人身份证信息后,同步读取人才网入库信息
6:个人职称评审加20分
7:个人信誉贷款加10分
8:在国家人才网主办的国家网络招聘大会中纳入资料,供国家高端企业选择人才
办理爱尔兰都柏林大学毕业证(本硕)ucd学位证书【微信:741003700 】外观非常简单,由纸质材料制成,上面印有校徽、校名、毕业生姓名、专业等信息。
办理爱尔兰都柏林大学毕业证(本硕)ucd学位证书【微信:741003700 】格式相对统一,各专业都有相应的模板。通常包括以下部分:
校徽:象征着学校的荣誉和传承。
校名:学校英文全称
授予学位:本部分将注明获得的具体学位名称。
毕业生姓名:这是最重要的信息之一,标志着该证书是由特定人员获得的。
颁发日期:这是毕业正式生效的时间,也代表着毕业生学业的结束。
其他信息:根据不同的专业和学位,可能会有一些特定的信息或章节。
办理爱尔兰都柏林大学毕业证(本硕)ucd学位证书【微信:741003700 】价值很高,需要妥善保管。一般来说,应放置在安全、干燥、防潮的地方,避免长时间暴露在阳光下。如需使用,最好使用复印件而不是原件,以免丢失。
综上所述,办理爱尔兰都柏林大学毕业证(本硕)ucd学位证书【微信:741003700 】是证明身份和学历的高价值文件。外观简单庄重,格式统一,包括重要的个人信息和发布日期。对持有人来说,妥善保管是非常重要的。
一比一原版澳洲西澳大学毕业证(uwa毕业证书)如何办理
原版一模一样【微信:741003700 】【澳洲西澳大学毕业证(uwa毕业证书)成绩单】【微信:741003700 】学位证,留信认证(真实可查,永久存档)原件一模一样纸张工艺/offer、雅思、外壳等材料/诚信可靠,可直接看成品样本,帮您解决无法毕业带来的各种难题!外壳,原版制作,诚信可靠,可直接看成品样本。行业标杆!精益求精,诚心合作,真诚制作!多年品质 ,按需精细制作,24小时接单,全套进口原装设备。十五年致力于帮助留学生解决难题,包您满意。
本公司拥有海外各大学样板无数,能完美还原。
1:1完美还原海外各大学毕业材料上的工艺:水印,阴影底纹,钢印LOGO烫金烫银,LOGO烫金烫银复合重叠。文字图案浮雕、激光镭射、紫外荧光、温感、复印防伪等防伪工艺。材料咨询办理、认证咨询办理请加学历顾问Q/微741003700
【主营项目】
一.毕业证【q微741003700】成绩单、使馆认证、教育部认证、雅思托福成绩单、学生卡等!
二.真实使馆公证(即留学回国人员证明,不成功不收费)
三.真实教育部学历学位认证(教育部存档!教育部留服网站永久可查)
四.办理各国各大学文凭(一对一专业服务,可全程监控跟踪进度)
如果您处于以下几种情况:
◇在校期间,因各种原因未能顺利毕业……拿不到官方毕业证【q/微741003700】
◇面对父母的压力,希望尽快拿到;
◇不清楚认证流程以及材料该如何准备;
◇回国时间很长,忘记办理;
◇回国马上就要找工作,办给用人单位看;
◇企事业单位必须要求办理的
◇需要报考公务员、购买免税车、落转户口
◇申请留学生创业基金
留信网认证的作用:
1:该专业认证可证明留学生真实身份
2:同时对留学生所学专业登记给予评定
3:国家专业人才认证中心颁发入库证书
4:这个认证书并且可以归档倒地方
5:凡事获得留信网入网的信息将会逐步更新到个人身份内,将在公安局网内查询个人身份证信息后,同步读取人才网入库信息
6:个人职称评审加20分
7:个人信誉贷款加10分
8:在国家人才网主办的国家网络招聘大会中纳入资料,供国家高端企业选择人才
办理澳洲西澳大学毕业证(uwa毕业证书)【微信:741003700 】外观非常简单,由纸质材料制成,上面印有校徽、校名、毕业生姓名、专业等信息。
办理澳洲西澳大学毕业证(uwa毕业证书)【微信:741003700 】格式相对统一,各专业都有相应的模板。通常包括以下部分:
校徽:象征着学校的荣誉和传承。
校名:学校英文全称
授予学位:本部分将注明获得的具体学位名称。
毕业生姓名:这是最重要的信息之一,标志着该证书是由特定人员获得的。
颁发日期:这是毕业正式生效的时间,也代表着毕业生学业的结束。
其他信息:根据不同的专业和学位,可能会有一些特定的信息或章节。
办理澳洲西澳大学毕业证(uwa毕业证书)【微信:741003700 】价值很高,需要妥善保管。一般来说,应放置在安全、干燥、防潮的地方,避免长时间暴露在阳光下。如需使用,最好使用复印件而不是原件,以免丢失。
综上所述,办理澳洲西澳大学毕业证(uwa毕业证书)【微信:741003700 】是证明身份和学历的高价值文件。外观简单庄重,格式统一,包括重要的个人信息和发布日期。对持有人来说,妥善保管是非常重要的。
一比一原版美国帕森斯设计学院毕业证(parsons毕业证书)如何办理
原版一模一样【微信:741003700 】【美国帕森斯设计学院毕业证(parsons毕业证书)成绩单】【微信:741003700 】学位证,留信认证(真实可查,永久存档)原件一模一样纸张工艺/offer、雅思、外壳等材料/诚信可靠,可直接看成品样本,帮您解决无法毕业带来的各种难题!外壳,原版制作,诚信可靠,可直接看成品样本。行业标杆!精益求精,诚心合作,真诚制作!多年品质 ,按需精细制作,24小时接单,全套进口原装设备。十五年致力于帮助留学生解决难题,包您满意。
本公司拥有海外各大学样板无数,能完美还原。
1:1完美还原海外各大学毕业材料上的工艺:水印,阴影底纹,钢印LOGO烫金烫银,LOGO烫金烫银复合重叠。文字图案浮雕、激光镭射、紫外荧光、温感、复印防伪等防伪工艺。材料咨询办理、认证咨询办理请加学历顾问Q/微741003700
【主营项目】
一.毕业证【q微741003700】成绩单、使馆认证、教育部认证、雅思托福成绩单、学生卡等!
二.真实使馆公证(即留学回国人员证明,不成功不收费)
三.真实教育部学历学位认证(教育部存档!教育部留服网站永久可查)
四.办理各国各大学文凭(一对一专业服务,可全程监控跟踪进度)
如果您处于以下几种情况:
◇在校期间,因各种原因未能顺利毕业……拿不到官方毕业证【q/微741003700】
◇面对父母的压力,希望尽快拿到;
◇不清楚认证流程以及材料该如何准备;
◇回国时间很长,忘记办理;
◇回国马上就要找工作,办给用人单位看;
◇企事业单位必须要求办理的
◇需要报考公务员、购买免税车、落转户口
◇申请留学生创业基金
留信网认证的作用:
1:该专业认证可证明留学生真实身份
2:同时对留学生所学专业登记给予评定
3:国家专业人才认证中心颁发入库证书
4:这个认证书并且可以归档倒地方
5:凡事获得留信网入网的信息将会逐步更新到个人身份内,将在公安局网内查询个人身份证信息后,同步读取人才网入库信息
6:个人职称评审加20分
7:个人信誉贷款加10分
8:在国家人才网主办的国家网络招聘大会中纳入资料,供国家高端企业选择人才
办理美国帕森斯设计学院毕业证(parsons毕业证书)【微信:741003700 】外观非常简单,由纸质材料制成,上面印有校徽、校名、毕业生姓名、专业等信息。
办理美国帕森斯设计学院毕业证(parsons毕业证书)【微信:741003700 】格式相对统一,各专业都有相应的模板。通常包括以下部分:
校徽:象征着学校的荣誉和传承。
校名:学校英文全称
授予学位:本部分将注明获得的具体学位名称。
毕业生姓名:这是最重要的信息之一,标志着该证书是由特定人员获得的。
颁发日期:这是毕业正式生效的时间,也代表着毕业生学业的结束。
其他信息:根据不同的专业和学位,可能会有一些特定的信息或章节。
办理美国帕森斯设计学院毕业证(parsons毕业证书)【微信:741003700 】价值很高,需要妥善保管。一般来说,应放置在安全、干燥、防潮的地方,避免长时间暴露在阳光下。如需使用,最好使用复印件而不是原件,以免丢失。
综上所述,办理美国帕森斯设计学院毕业证(parsons毕业证书)【微信:741003700 】是证明身份和学历的高价值文件。外观简单庄重,格式统一,包括重要的个人信息和发布日期。对持有人来说,妥善保管是非常重要的。
一比一原版加拿大渥太华大学毕业证(uottawa毕业证书)如何办理
原版一模一样【微信:741003700 】【渥太华大学毕业证(uottawa毕业证书)成绩单】【微信:741003700 】学位证,留信认证(真实可查,永久存档)原件一模一样纸张工艺/offer、雅思、外壳等材料/诚信可靠,可直接看成品样本,帮您解决无法毕业带来的各种难题!外壳,原版制作,诚信可靠,可直接看成品样本。行业标杆!精益求精,诚心合作,真诚制作!多年品质 ,按需精细制作,24小时接单,全套进口原装设备。十五年致力于帮助留学生解决难题,包您满意。
本公司拥有海外各大学样板无数,能完美还原。
1:1完美还原海外各大学毕业材料上的工艺:水印,阴影底纹,钢印LOGO烫金烫银,LOGO烫金烫银复合重叠。文字图案浮雕、激光镭射、紫外荧光、温感、复印防伪等防伪工艺。材料咨询办理、认证咨询办理请加学历顾问Q/微741003700
【主营项目】
一.毕业证【q微741003700】成绩单、使馆认证、教育部认证、雅思托福成绩单、学生卡等!
二.真实使馆公证(即留学回国人员证明,不成功不收费)
三.真实教育部学历学位认证(教育部存档!教育部留服网站永久可查)
四.办理各国各大学文凭(一对一专业服务,可全程监控跟踪进度)
如果您处于以下几种情况:
◇在校期间,因各种原因未能顺利毕业……拿不到官方毕业证【q/微741003700】
◇面对父母的压力,希望尽快拿到;
◇不清楚认证流程以及材料该如何准备;
◇回国时间很长,忘记办理;
◇回国马上就要找工作,办给用人单位看;
◇企事业单位必须要求办理的
◇需要报考公务员、购买免税车、落转户口
◇申请留学生创业基金
留信网认证的作用:
1:该专业认证可证明留学生真实身份
2:同时对留学生所学专业登记给予评定
3:国家专业人才认证中心颁发入库证书
4:这个认证书并且可以归档倒地方
5:凡事获得留信网入网的信息将会逐步更新到个人身份内,将在公安局网内查询个人身份证信息后,同步读取人才网入库信息
6:个人职称评审加20分
7:个人信誉贷款加10分
8:在国家人才网主办的国家网络招聘大会中纳入资料,供国家高端企业选择人才
办理渥太华大学毕业证(uottawa毕业证书)【微信:741003700 】外观非常简单,由纸质材料制成,上面印有校徽、校名、毕业生姓名、专业等信息。
办理渥太华大学毕业证(uottawa毕业证书)【微信:741003700 】格式相对统一,各专业都有相应的模板。通常包括以下部分:
校徽:象征着学校的荣誉和传承。
校名:学校英文全称
授予学位:本部分将注明获得的具体学位名称。
毕业生姓名:这是最重要的信息之一,标志着该证书是由特定人员获得的。
颁发日期:这是毕业正式生效的时间,也代表着毕业生学业的结束。
其他信息:根据不同的专业和学位,可能会有一些特定的信息或章节。
办理渥太华大学毕业证(uottawa毕业证书)【微信:741003700 】价值很高,需要妥善保管。一般来说,应放置在安全、干燥、防潮的地方,避免长时间暴露在阳光下。如需使用,最好使用复印件而不是原件,以免丢失。
综上所述,办理渥太华大学毕业证(uottawa毕业证书)【微信:741003700 】是证明身份和学历的高价值文件。外观简单庄重,格式统一,包括重要的个人信息和发布日期。对持有人来说,妥善保管是非常重要的。
一比一原版斯威本理工大学毕业证(swinburne毕业证)如何办理
原版一模一样【微信:741003700 】【斯威本理工大学毕业证(swinburne毕业证)成绩单】【微信:741003700 】学位证,留信认证(真实可查,永久存档)原件一模一样纸张工艺/offer、雅思、外壳等材料/诚信可靠,可直接看成品样本,帮您解决无法毕业带来的各种难题!外壳,原版制作,诚信可靠,可直接看成品样本。行业标杆!精益求精,诚心合作,真诚制作!多年品质 ,按需精细制作,24小时接单,全套进口原装设备。十五年致力于帮助留学生解决难题,包您满意。
本公司拥有海外各大学样板无数,能完美还原。
1:1完美还原海外各大学毕业材料上的工艺:水印,阴影底纹,钢印LOGO烫金烫银,LOGO烫金烫银复合重叠。文字图案浮雕、激光镭射、紫外荧光、温感、复印防伪等防伪工艺。材料咨询办理、认证咨询办理请加学历顾问Q/微741003700
【主营项目】
一.毕业证【q微741003700】成绩单、使馆认证、教育部认证、雅思托福成绩单、学生卡等!
二.真实使馆公证(即留学回国人员证明,不成功不收费)
三.真实教育部学历学位认证(教育部存档!教育部留服网站永久可查)
四.办理各国各大学文凭(一对一专业服务,可全程监控跟踪进度)
如果您处于以下几种情况:
◇在校期间,因各种原因未能顺利毕业……拿不到官方毕业证【q/微741003700】
◇面对父母的压力,希望尽快拿到;
◇不清楚认证流程以及材料该如何准备;
◇回国时间很长,忘记办理;
◇回国马上就要找工作,办给用人单位看;
◇企事业单位必须要求办理的
◇需要报考公务员、购买免税车、落转户口
◇申请留学生创业基金
留信网认证的作用:
1:该专业认证可证明留学生真实身份
2:同时对留学生所学专业登记给予评定
3:国家专业人才认证中心颁发入库证书
4:这个认证书并且可以归档倒地方
5:凡事获得留信网入网的信息将会逐步更新到个人身份内,将在公安局网内查询个人身份证信息后,同步读取人才网入库信息
6:个人职称评审加20分
7:个人信誉贷款加10分
8:在国家人才网主办的国家网络招聘大会中纳入资料,供国家高端企业选择人才
办理斯威本理工大学毕业证(swinburne毕业证)【微信:741003700 】外观非常简单,由纸质材料制成,上面印有校徽、校名、毕业生姓名、专业等信息。
办理斯威本理工大学毕业证(swinburne毕业证)【微信:741003700 】格式相对统一,各专业都有相应的模板。通常包括以下部分:
校徽:象征着学校的荣誉和传承。
校名:学校英文全称
授予学位:本部分将注明获得的具体学位名称。
毕业生姓名:这是最重要的信息之一,标志着该证书是由特定人员获得的。
颁发日期:这是毕业正式生效的时间,也代表着毕业生学业的结束。
其他信息:根据不同的专业和学位,可能会有一些特定的信息或章节。
办理斯威本理工大学毕业证(swinburne毕业证)【微信:741003700 】价值很高,需要妥善保管。一般来说,应放置在安全、干燥、防潮的地方,避免长时间暴露在阳光下。如需使用,最好使用复印件而不是原件,以免丢失。
综上所述,办理斯威本理工大学毕业证(swinburne毕业证)【微信:741003700 】是证明身份和学历的高价值文件。外观简单庄重,格式统一,包括重要的个人信息和发布日期。对持有人来说,妥善保管是非常重要的。
一比一原版南昆士兰大学毕业证如何办理
原版一模一样【微信:741003700 】【南昆士兰大学毕业证成绩单】【微信:741003700 】学位证,留信认证(真实可查,永久存档)原件一模一样纸张工艺/offer、雅思、外壳等材料/诚信可靠,可直接看成品样本,帮您解决无法毕业带来的各种难题!外壳,原版制作,诚信可靠,可直接看成品样本。行业标杆!精益求精,诚心合作,真诚制作!多年品质 ,按需精细制作,24小时接单,全套进口原装设备。十五年致力于帮助留学生解决难题,包您满意。
本公司拥有海外各大学样板无数,能完美还原。
1:1完美还原海外各大学毕业材料上的工艺:水印,阴影底纹,钢印LOGO烫金烫银,LOGO烫金烫银复合重叠。文字图案浮雕、激光镭射、紫外荧光、温感、复印防伪等防伪工艺。材料咨询办理、认证咨询办理请加学历顾问Q/微741003700
【主营项目】
一.毕业证【q微741003700】成绩单、使馆认证、教育部认证、雅思托福成绩单、学生卡等!
二.真实使馆公证(即留学回国人员证明,不成功不收费)
三.真实教育部学历学位认证(教育部存档!教育部留服网站永久可查)
四.办理各国各大学文凭(一对一专业服务,可全程监控跟踪进度)
如果您处于以下几种情况:
◇在校期间,因各种原因未能顺利毕业……拿不到官方毕业证【q/微741003700】
◇面对父母的压力,希望尽快拿到;
◇不清楚认证流程以及材料该如何准备;
◇回国时间很长,忘记办理;
◇回国马上就要找工作,办给用人单位看;
◇企事业单位必须要求办理的
◇需要报考公务员、购买免税车、落转户口
◇申请留学生创业基金
留信网认证的作用:
1:该专业认证可证明留学生真实身份
2:同时对留学生所学专业登记给予评定
3:国家专业人才认证中心颁发入库证书
4:这个认证书并且可以归档倒地方
5:凡事获得留信网入网的信息将会逐步更新到个人身份内,将在公安局网内查询个人身份证信息后,同步读取人才网入库信息
6:个人职称评审加20分
7:个人信誉贷款加10分
8:在国家人才网主办的国家网络招聘大会中纳入资料,供国家高端企业选择人才
办理南昆士兰大学毕业证【微信:741003700 】外观非常简单,由纸质材料制成,上面印有校徽、校名、毕业生姓名、专业等信息。
办理南昆士兰大学毕业证【微信:741003700 】格式相对统一,各专业都有相应的模板。通常包括以下部分:
校徽:象征着学校的荣誉和传承。
校名:学校英文全称
授予学位:本部分将注明获得的具体学位名称。
毕业生姓名:这是最重要的信息之一,标志着该证书是由特定人员获得的。
颁发日期:这是毕业正式生效的时间,也代表着毕业生学业的结束。
其他信息:根据不同的专业和学位,可能会有一些特定的信息或章节。
办理南昆士兰大学毕业证【微信:741003700 】价值很高,需要妥善保管。一般来说,应放置在安全、干燥、防潮的地方,避免长时间暴露在阳光下。如需使用,最好使用复印件而不是原件,以免丢失。
综上所述,办理南昆士兰大学毕业证【微信:741003700 】是证明身份和学历的高价值文件。外观简单庄重,格式统一,包括重要的个人信息和发布日期。对持有人来说,妥善保管是非常重要的。
06-20-2024-AI Camp Meetup-Unstructured Data and Vector Databases
Tech Talk: Unstructured Data and Vector Databases
Speaker: Tim Spann (Zilliz)
Abstract: In this session, I will discuss the unstructured data and the world of vector databases, we will see how they different from traditional databases. In which cases you need one and in which you probably don’t. I will also go over Similarity Search, where do you get vectors from and an example of a Vector Database Architecture. Wrapping up with an overview of Milvus.
Introduction
Unstructured data, vector databases, traditional databases, similarity search
Vectors
Where, What, How, Why Vectors? We’ll cover a Vector Database Architecture
Introducing Milvus
What drives Milvus' Emergence as the most widely adopted vector database
Hi Unstructured Data Friends!
I hope this video had all the unstructured data processing, AI and Vector Database demo you needed for now. If not, there’s a ton more linked below.
My source code is available here
https://github.com/tspannhw/
Let me know in the comments if you liked what you saw, how I can improve and what should I show next? Thanks, hope to see you soon at a Meetup in Princeton, Philadelphia, New York City or here in the Youtube Matrix.
Get Milvused!
https://milvus.io/
Read my Newsletter every week!
https://github.com/tspannhw/FLiPStackWeekly/blob/main/141-10June2024.md
For more cool Unstructured Data, AI and Vector Database videos check out the Milvus vector database videos here
https://www.youtube.com/@MilvusVectorDatabase/videos
Unstructured Data Meetups -
https://www.meetup.com/unstructured-data-meetup-new-york/
https://lu.ma/calendar/manage/cal-VNT79trvj0jS8S7
https://www.meetup.com/pro/unstructureddata/
https://zilliz.com/community/unstructured-data-meetup
https://zilliz.com/event
Twitter/X: https://x.com/milvusio https://x.com/paasdev
LinkedIn: https://www.linkedin.com/company/zilliz/ https://www.linkedin.com/in/timothyspann/
GitHub: https://github.com/milvus-io/milvus https://github.com/tspannhw
Invitation to join Discord: https://discord.com/invite/FjCMmaJng6
Blogs: https://milvusio.medium.com/ https://www.opensourcevectordb.cloud/ https://medium.com/@tspann
https://www.meetup.com/unstructured-data-meetup-new-york/events/301383476/?slug=unstructured-data-meetup-new-york&eventId=301383476
https://www.aicamp.ai/event/eventdetails/W2024062014
一比一原版(曼大毕业证书)曼尼托巴大学毕业证如何办理
原版一模一样【微信:741003700 】【(曼大毕业证书)曼尼托巴大学毕业证成绩单】【微信:741003700 】学位证,留信认证(真实可查,永久存档)原件一模一样纸张工艺/offer、雅思、外壳等材料/诚信可靠,可直接看成品样本,帮您解决无法毕业带来的各种难题!外壳,原版制作,诚信可靠,可直接看成品样本。行业标杆!精益求精,诚心合作,真诚制作!多年品质 ,按需精细制作,24小时接单,全套进口原装设备。十五年致力于帮助留学生解决难题,包您满意。
本公司拥有海外各大学样板无数,能完美还原。
1:1完美还原海外各大学毕业材料上的工艺:水印,阴影底纹,钢印LOGO烫金烫银,LOGO烫金烫银复合重叠。文字图案浮雕、激光镭射、紫外荧光、温感、复印防伪等防伪工艺。材料咨询办理、认证咨询办理请加学历顾问Q/微741003700
【主营项目】
一.毕业证【q微741003700】成绩单、使馆认证、教育部认证、雅思托福成绩单、学生卡等!
二.真实使馆公证(即留学回国人员证明,不成功不收费)
三.真实教育部学历学位认证(教育部存档!教育部留服网站永久可查)
四.办理各国各大学文凭(一对一专业服务,可全程监控跟踪进度)
如果您处于以下几种情况:
◇在校期间,因各种原因未能顺利毕业……拿不到官方毕业证【q/微741003700】
◇面对父母的压力,希望尽快拿到;
◇不清楚认证流程以及材料该如何准备;
◇回国时间很长,忘记办理;
◇回国马上就要找工作,办给用人单位看;
◇企事业单位必须要求办理的
◇需要报考公务员、购买免税车、落转户口
◇申请留学生创业基金
留信网认证的作用:
1:该专业认证可证明留学生真实身份
2:同时对留学生所学专业登记给予评定
3:国家专业人才认证中心颁发入库证书
4:这个认证书并且可以归档倒地方
5:凡事获得留信网入网的信息将会逐步更新到个人身份内,将在公安局网内查询个人身份证信息后,同步读取人才网入库信息
6:个人职称评审加20分
7:个人信誉贷款加10分
8:在国家人才网主办的国家网络招聘大会中纳入资料,供国家高端企业选择人才
办理(曼大毕业证书)曼尼托巴大学毕业证【微信:741003700 】外观非常简单,由纸质材料制成,上面印有校徽、校名、毕业生姓名、专业等信息。
办理(曼大毕业证书)曼尼托巴大学毕业证【微信:741003700 】格式相对统一,各专业都有相应的模板。通常包括以下部分:
校徽:象征着学校的荣誉和传承。
校名:学校英文全称
授予学位:本部分将注明获得的具体学位名称。
毕业生姓名:这是最重要的信息之一,标志着该证书是由特定人员获得的。
颁发日期:这是毕业正式生效的时间,也代表着毕业生学业的结束。
其他信息:根据不同的专业和学位,可能会有一些特定的信息或章节。
办理(曼大毕业证书)曼尼托巴大学毕业证【微信:741003700 】价值很高,需要妥善保管。一般来说,应放置在安全、干燥、防潮的地方,避免长时间暴露在阳光下。如需使用,最好使用复印件而不是原件,以免丢失。
综上所述,办理(曼大毕业证书)曼尼托巴大学毕业证【微信:741003700 】是证明身份和学历的高价值文件。外观简单庄重,格式统一,包括重要的个人信息和发布日期。对持有人来说,妥善保管是非常重要的。
一比一原版卡尔加里大学毕业证(uc毕业证)如何办理
原版一模一样【微信:741003700 】【卡尔加里大学毕业证(uc毕业证)成绩单】【微信:741003700 】学位证,留信认证(真实可查,永久存档)原件一模一样纸张工艺/offer、雅思、外壳等材料/诚信可靠,可直接看成品样本,帮您解决无法毕业带来的各种难题!外壳,原版制作,诚信可靠,可直接看成品样本。行业标杆!精益求精,诚心合作,真诚制作!多年品质 ,按需精细制作,24小时接单,全套进口原装设备。十五年致力于帮助留学生解决难题,包您满意。
本公司拥有海外各大学样板无数,能完美还原。
1:1完美还原海外各大学毕业材料上的工艺:水印,阴影底纹,钢印LOGO烫金烫银,LOGO烫金烫银复合重叠。文字图案浮雕、激光镭射、紫外荧光、温感、复印防伪等防伪工艺。材料咨询办理、认证咨询办理请加学历顾问Q/微741003700
【主营项目】
一.毕业证【q微741003700】成绩单、使馆认证、教育部认证、雅思托福成绩单、学生卡等!
二.真实使馆公证(即留学回国人员证明,不成功不收费)
三.真实教育部学历学位认证(教育部存档!教育部留服网站永久可查)
四.办理各国各大学文凭(一对一专业服务,可全程监控跟踪进度)
如果您处于以下几种情况:
◇在校期间,因各种原因未能顺利毕业……拿不到官方毕业证【q/微741003700】
◇面对父母的压力,希望尽快拿到;
◇不清楚认证流程以及材料该如何准备;
◇回国时间很长,忘记办理;
◇回国马上就要找工作,办给用人单位看;
◇企事业单位必须要求办理的
◇需要报考公务员、购买免税车、落转户口
◇申请留学生创业基金
留信网认证的作用:
1:该专业认证可证明留学生真实身份
2:同时对留学生所学专业登记给予评定
3:国家专业人才认证中心颁发入库证书
4:这个认证书并且可以归档倒地方
5:凡事获得留信网入网的信息将会逐步更新到个人身份内,将在公安局网内查询个人身份证信息后,同步读取人才网入库信息
6:个人职称评审加20分
7:个人信誉贷款加10分
8:在国家人才网主办的国家网络招聘大会中纳入资料,供国家高端企业选择人才
办理卡尔加里大学毕业证(uc毕业证)【微信:741003700 】外观非常简单,由纸质材料制成,上面印有校徽、校名、毕业生姓名、专业等信息。
办理卡尔加里大学毕业证(uc毕业证)【微信:741003700 】格式相对统一,各专业都有相应的模板。通常包括以下部分:
校徽:象征着学校的荣誉和传承。
校名:学校英文全称
授予学位:本部分将注明获得的具体学位名称。
毕业生姓名:这是最重要的信息之一,标志着该证书是由特定人员获得的。
颁发日期:这是毕业正式生效的时间,也代表着毕业生学业的结束。
其他信息:根据不同的专业和学位,可能会有一些特定的信息或章节。
办理卡尔加里大学毕业证(uc毕业证)【微信:741003700 】价值很高,需要妥善保管。一般来说,应放置在安全、干燥、防潮的地方,避免长时间暴露在阳光下。如需使用,最好使用复印件而不是原件,以免丢失。
综上所述,办理卡尔加里大学毕业证(uc毕业证)【微信:741003700 】是证明身份和学历的高价值文件。外观简单庄重,格式统一,包括重要的个人信息和发布日期。对持有人来说,妥善保管是非常重要的。
Senior Engineering Sample EM DOE - Sheet1.pdf
Sample Engineering Profiles from Product Companies DOE EM etc
Recently uploaded (20)
PyData London 2024: Mistakes were made (Dr. Rebecca Bilbro)
PyData London 2024: Mistakes were made (Dr. Rebecca Bilbro)
[VCOSA] Monthly Report - Cotton & Yarn Statistics May 2024
[VCOSA] Monthly Report - Cotton & Yarn Statistics May 2024
06-18-2024-Princeton Meetup-Introduction to Milvus
06-18-2024-Princeton Meetup-Introduction to Milvus
[VCOSA] Monthly Report - Cotton & Yarn Statistics March 2024
[VCOSA] Monthly Report - Cotton & Yarn Statistics March 2024
Econ3060_Screen Time and Success_ final_GroupProject.pdf
Econ3060_Screen Time and Success_ final_GroupProject.pdf
Senior Software Profiles Backend Sample - Sheet1.pdf
Senior Software Profiles Backend Sample - Sheet1.pdf
A gentle exploration of Retrieval Augmented Generation
A gentle exploration of Retrieval Augmented Generation
06-20-2024-AI Camp Meetup-Unstructured Data and Vector Databases
06-20-2024-AI Camp Meetup-Unstructured Data and Vector Databases
5 THINGS TO KNOW ABOUT U.S. OCTOBER PERFORMANCE DATA
- 1. 4.3% The annualized demand growth rate for group rooms is +4.3%, the strongest growth rate since January 2012. RevPAR year to date was up 8.4%, the strongest October YTD increase ever. OCT. J F M A M J J A S N D HOTEL Room demand grew by 6.3%. Previous Months RevPAR was the strongest performance for any October ever (+10.1%). Occupancy was up 5.3% to 68%. ADR was up 4.6%.