Download to read offline

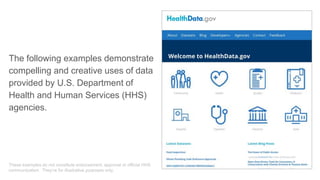
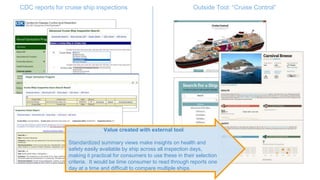
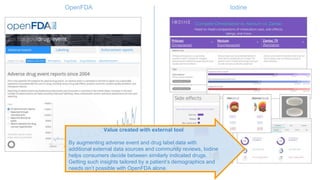
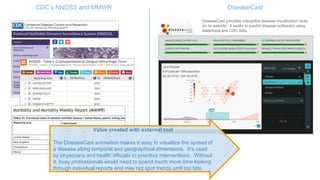
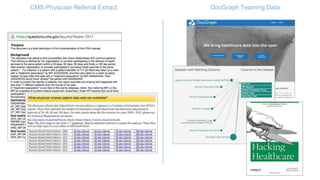
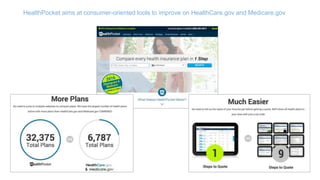
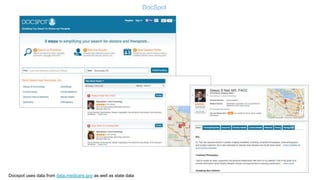
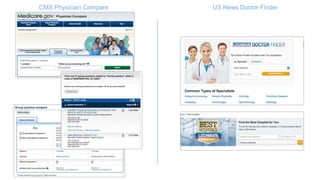
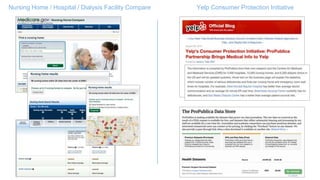
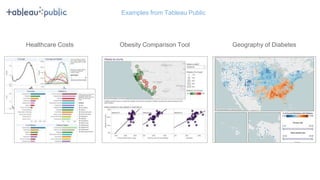
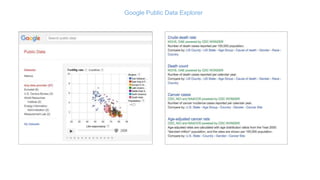

The document outlines various innovative uses of data from the U.S. Department of Health and Human Services (HHS) by different external tools to improve public health insights and consumer decision-making. Examples include tools for visualizing cruise ship inspection reports, predicting disease outbreaks, and comparing healthcare providers, which make critical health data accessible and actionable for both consumers and professionals. Each example showcases how these tools facilitate informed choices and enhance healthcare efficiency without endorsement from HHS.


