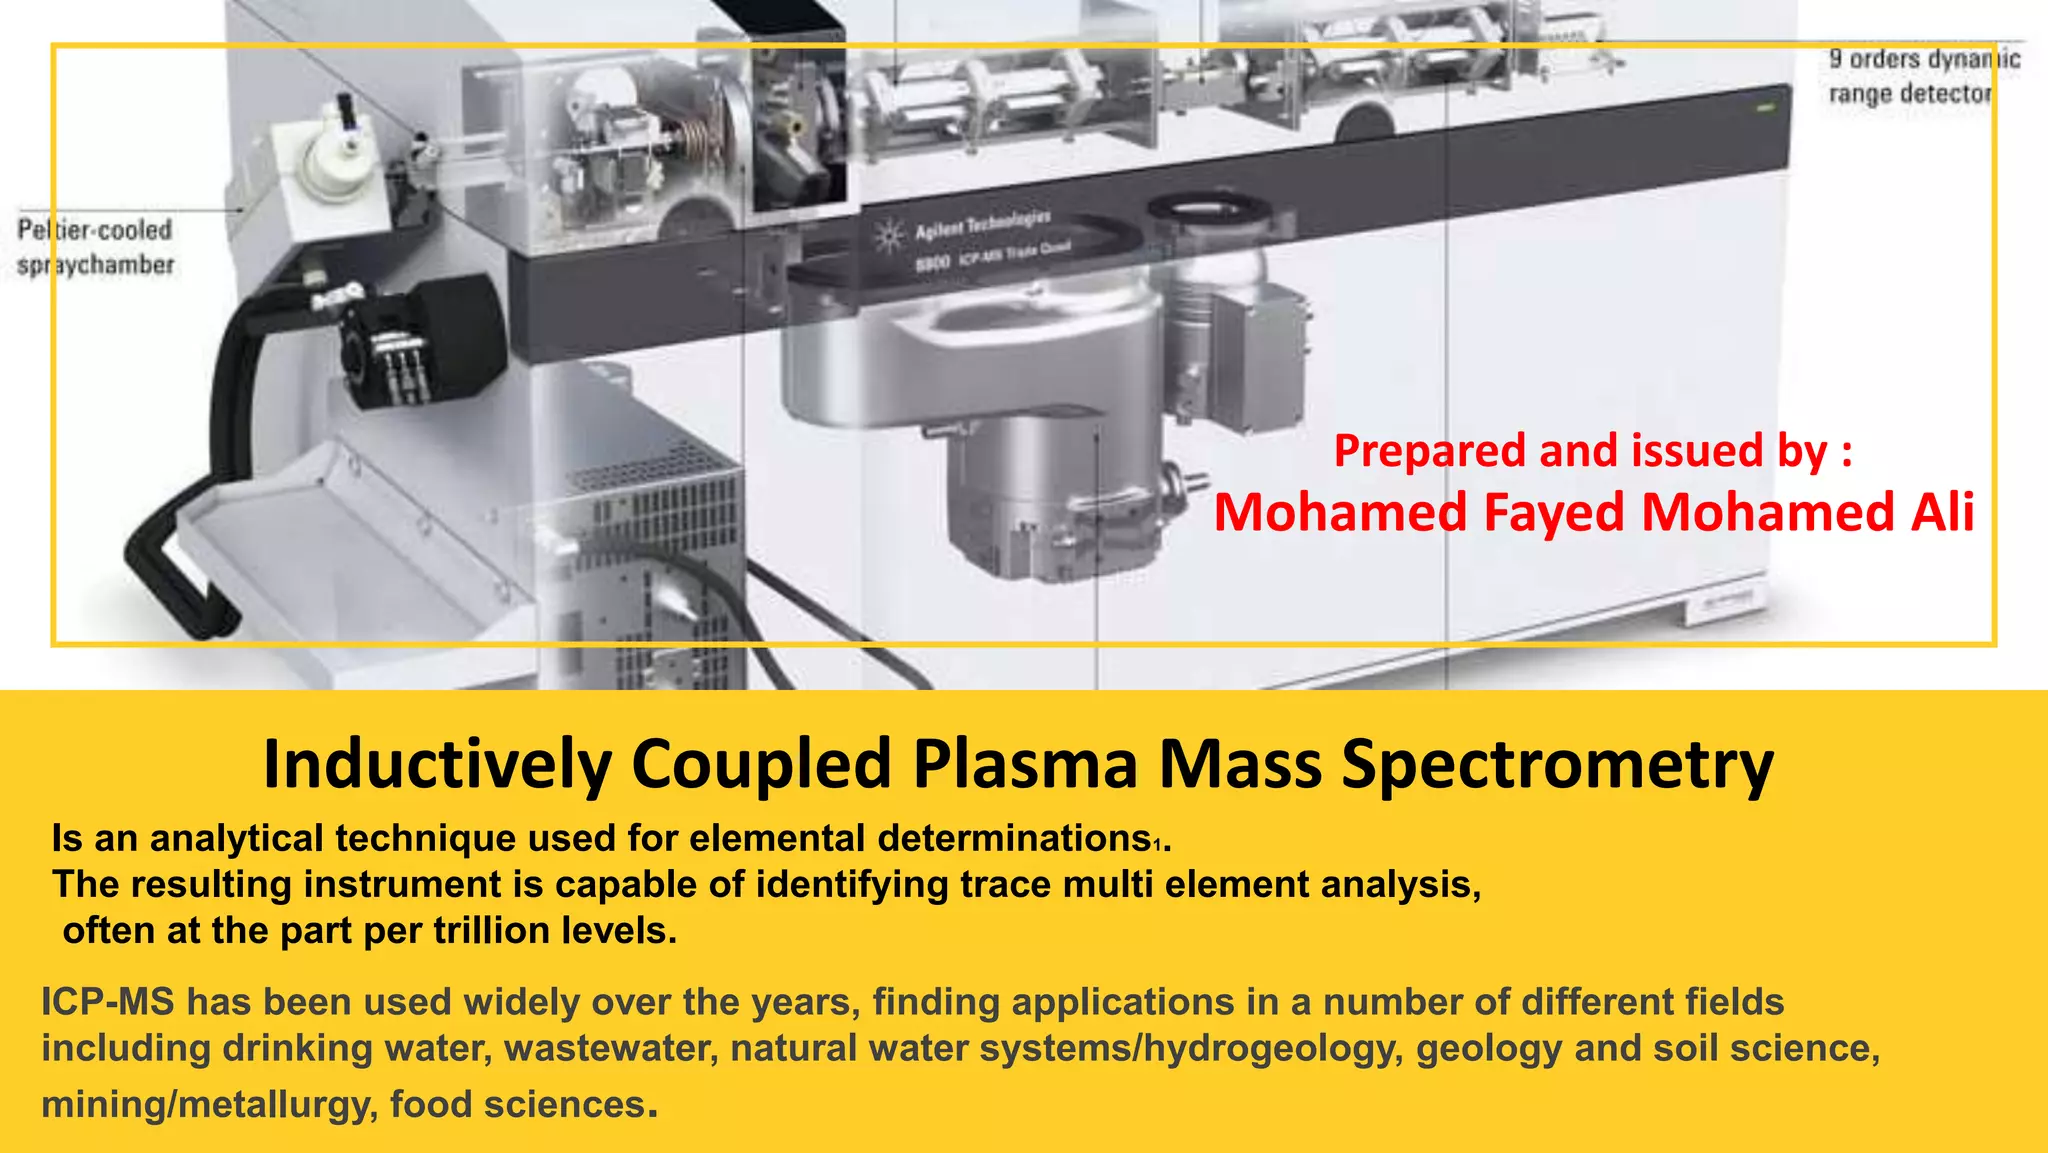
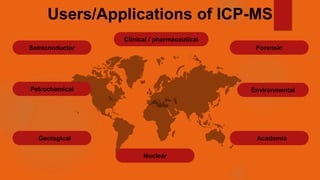
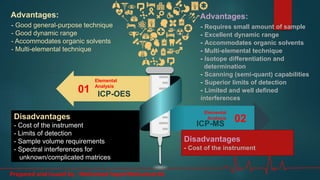
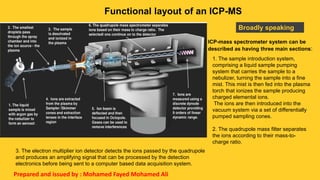
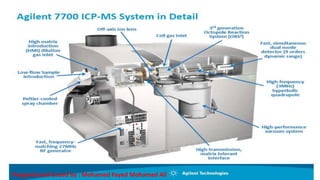
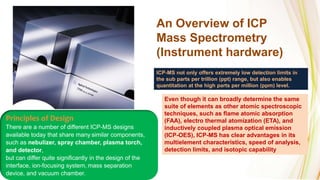
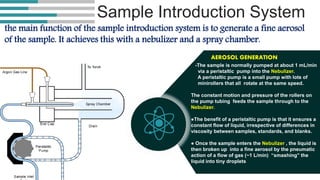
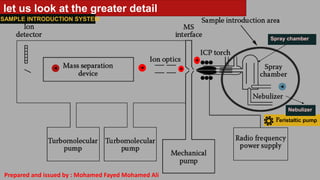
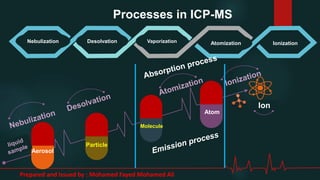
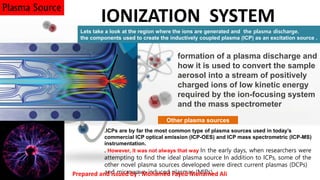
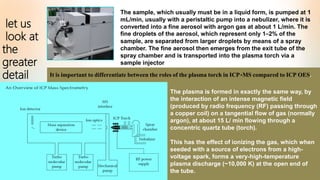
ICP-MS has been used widely over the years, finding applications in a number of different fields
including drinking water, wastewater, natural water systems/hydrogeology, geology and soil science,
mining/metallurgy, food sciences.
Inductively Coupled Plasma Mass Spectrometry
Is an analytical technique used for elemental determinations1.
The resulting instrument is capable of identifying trace multi element analysis,
often at the part per trillion levels.
Prepared and issued by :
Mohamed Fayed Mohamed Ali
Users/Applications of ICP-MS
Semiconductor
Geological
Clinical / pharmaceutical
Environmental
Academia
Petrochemical
Forensic
Nuclear
01
02
- Requires small amount of sample
- Excellent dynamic range
- Accommodates organic solvents
- Multi-elemental technique
- Isotope differentiation and
determination
- Scanning (semi-quant) capabilities
- Superior limits of detection
- Limited and well defined
interferences
Advantages:
01
02
Elemental
Analysis
ICP-MS
Elemental
Analysis
ICP-OES
Disadvantages
- Cost of the instrument
- Good general-purpose technique
- Good dynamic range
- Accommodates organic solvents
- Multi-elemental technique
Advantages:
Disadvantages
- Cost of the instrument
- Limits of detection
- Sample volume requirements
- Spectral interferences for
unknown/complicated matrices
Prepared and issued by : Mohamed Fayed Mohamed Ali
Functional layout of an ICP-MS
Broadly speaking
ICP-mass spectrometer system can be
described as having three main sections:
1. The sample introduction system,
comprising a liquid sample pumping
system that carries the sample to a
nebulizer, turning the sample into a fine
mist. This mist is then fed into the plasma
torch that ionizes the sample producing
charged elemental ions.
The ions are then introduced into the
vacuum system via a set of differentially
pumped sampling cones.
2. The quadrupole mass filter separates
the ions according to their mass-to-
charge ratio.
3. The electron multiplier ion detector detects the ions passed by the quadrupole
and produces an amplifying signal that can be processed by the detection
electronics before being sent to a computer based data acquisition system.
Prepared and issued by : Mohamed Fayed Mohamed Ali
An Overview of ICP
Mass Spectrometry
(Instrument hardware)
Even though it can broadly determine the same
suite of elements as other atomic spectroscopic
techniques, such as flame atomic absorption
(FAA), electro thermal atomization (ETA), and
inductively coupled plasma optical emission
(ICP-OES), ICP-MS has clear advantages in its
multielement characteristics, speed of analysis,
detection limits, and isotopic capability
ICP-MS not only offers extremely low detection limits in
the sub parts per trillion (ppt) range, but also enables
quantitation at the high parts per million (ppm) level.
Principles of Design
There are a number of different ICP-MS designs
available today that share many similar components,
such as nebulizer, spray chamber, plasma torch,
and detector,
but can differ quite significantly in the design of the
interface, ion-focusing system, mass separation
device, and vacuum chamber.
Sample Introduction System
the main function of the sample introduction system is to generate a fine aerosol
of the sample. It achieves this with a nebulizer and a spray chamber.
AEROSOL GENERATION
-The sample is normally pumped at about 1 mL/min
via a peristaltic pump into the Nebulizer.
A peristaltic pump is a small pump with lots of
minirollers that all rotate at the same speed.
The constant motion and pressure of the rollers on
the pump tubing feeds the sample through to the
Nebulizer.
●The benefit of a peristaltic pump is that it ensures a
constant flow of liquid, irrespective of differences in
viscosity between samples, standards, and blanks.
● Once the sample enters the Nebulizer , the liquid is
then broken up into a fine aerosol by the pneumatic
action of a flow of gas (~1 L/min) “smashing” the
liquid into tiny droplets
let us look at the greater detail
SAMPLE INTRODUCTION SYSTEM
Peristaltic pump
Spray chamber
Nebulizer
Prepared and issued by : Mohamed Fayed Mohamed Ali
Sample Introduction System
The most common of the pneumatic nebulizers
used in commercial ICP mass spectrometers are
the concentric and cross-flow design types.
Nebulizers
By far the most common design used for ICP-MS is the pneumatic nebulizer, which uses
mechanical forces of a gas flow (normally argon at a pressure of 20–30 psi) to generate
the sample aerosol.
. The concentric design is the most widely used
nebulizer for clean samples, whereas the cross-flow
is generally more tolerant to samples containing
higher solids and particulate matter.
However, recent advances in the concentric design
have allowed for the aspiration of these types of
samples.
The most common of the pneumatic
nebulizers used in commercial ICP mass
spectrometers are the concentric and cross-
flow design types.
The concentric design is the most widely used
nebulizer for clean samples, whereas the cross-
flow is generally more tolerant to samples
containing higher solids and particulate matter.
However, recent advances in the concentric
design have allowed for the aspiration of these
types of samples.
Prepared and issued by : Mohamed Fayed Mohamed Ali
Spray Chambers
● Because the plasma discharge is not very efficient at dissociating large droplets
● the function of the spray chamber is to reject the larger aerosol droplets and also to smooth out nebulization pulses produced by the
peristaltic pump
● In addition, some ICP-MS spray chambers are externally cooled for thermal stability of the sample and to reduce the amount of solvent
going into the plasma
By far the most common design of the double-pass
spray chamber is the Scott design, which selects
the small droplets by directing the aerosol into a
central tube.
The larger droplets emerge from the tube, and
by gravity exit the spray chamber via a drain
tube.
The liquid in the drain tube is kept at positive pressure
(usually by way of a loop), which forces the small
droplets back between the outer wall and the central
tube and emerges from the spray chamber into the
sample injector of the plasma torch.
Double-pass spray chambers come in a variety of
shapes, sizes, and materials, and are generally
considered the most rugged design for routine use
but the most common type is the double-pass
design, where the aerosol from the nebulizer is
directed into a central tube running the entire
length of the chamber
The droplets then travel the length of this tube,
where the large droplets (greater than ~10 μm dia.)
will fall out by gravity and exit through the drain tube
at the end of the spray chamber.
The fine droplets (<10 μm dia.) then pass between
the outer wall and the central tube.
, where they eventually emerge from the spray
chamber and are transported into the sample
injector of the plasma torch
Prepared and issued by : Mohamed Fayed Mohamed Ali
The fine aerosol then emerges from the exit tube of the spray chamber and is transported
into the plasma torch via a sample injector.
Principle of HMI is simple –
hardware comprises extra
gas line to dilute aerosol.
However, requires very
sophisticated software
algorithm to map plasma
conditions, and very
reproducible hardware to
allow conditions to be
recalled consistently
HMI 􀃆 Robust Plasma → Low Oxide Interferences
● In the ICP-OES , the
plasma which is normally
vertical is used to generate
photons of light by the
Excitation of Electrons of a
ground State atom to a
higher energy Level.
When Electrons fall back to
ground state , wavelength
specific photons are
emitted that are
characteristic of the
element of interest.
In the ICP-MS the plasma
torch ,which is positioned
horizontally , is used to
generate positively charged
ions and not photons
Prepared and issued by : Mohamed Fayed Mohamed Ali
Processes in ICP-MS
Nebulization Desolvation Vaporization Atomization Ionization
Aerosol
Particle
Molecule
Atom
Ion
Prepared and issued by : Mohamed Fayed Mohamed Ali
formation of a plasma discharge and
how it is used to convert the sample
aerosol into a stream of positively
charged ions of low kinetic energy
required by the ion-focusing system
and the mass spectrometer
IONIZATION SYSTEM
Lets take a look at the region where the ions are generated and the plasma discharge.
the components used to create the inductively coupled plasma (ICP) as an excitation source .
.ICPs are by far the most common type of plasma sources used in today’s
commercial ICP optical emission (ICP-OES) and ICP mass spectrometric (ICP-MS)
instrumentation.
. However, it was not always that way In the early days, when researchers were
attempting to find the ideal plasma source In addition to ICPs, some of the
other novel plasma sources developed were direct current plasmas (DCPs)
and microwave-induced plasmas (MIPs).
Plasma Source
Other plasma sources
Prepared and issued by : Mohamed Fayed Mohamed Ali
let us
look at
the
greater
detail
The sample, which usually must be in a liquid form, is pumped at 1
mL/min, usually with a peristaltic pump into a nebulizer, where it is
converted into a fine aerosol with argon gas at about 1 L/min. The
fine droplets of the aerosol, which represent only 1–2% of the
sample, are separated from larger droplets by means of a spray
chamber. The fine aerosol then emerges from the exit tube of the
spray chamber and is transported into the plasma torch via a
sample injector
It is important to differentiate between the roles of the plasma torch in ICP-MS compared to ICP OES.
The plasma is formed in exactly the same way, by
the interaction of an intense magnetic field
(produced by radio frequency (RF) passing through
a copper coil) on a tangential flow of gas (normally
argon), at about 15 L/ min flowing through a
concentric quartz tube (torch).
This has the effect of ionizing the gas, which when
seeded with a source of electrons from a high-
voltage spark, forms a very-high-temperature
plasma discharge (~10,000 K) at the open end of
the tube.
Plasma Source the basic components used to generate the source a plasma torch, radio-frequency
(RF) coil, and power supply.
The plasma torch consists of three concentric tubes, which are normally made from
quartz. (the outer tube, middle tube, and sample injector ).
The Plasma
Torch
The torch can either be one
piece, in which all three
tubes are connected, or it
can employ a demountable
design in which the tubes
and the sample injector
are separate.
The gas (usually argon)
that is used to form the
plasma (plasma gas) is
passed between the outer
and middle tubes at a
flow rate of ~12–17 L/min.
A second gas flow (auxiliary
gas) passes between the
middle tube and the sample
injector at ~1 L/min and is
used to change the position of
the base of the plasma relative
to the tube and the injector.
A third gas flow (nebulizer
gas), also at ~1 L/min,
brings the sample, in the
form of a fine-droplet
aerosol, from the sample
introduction system
although argon is the most suitable gas to use for all three flows, there are analytical
benefits in using other gas mixtures, especially in the nebulizer flow.
Formation of an ICP Discharge
These electrons, which are caught up and
accelerated in the magnetic field, then
collide with other argon atoms, stripping off
still more electrons. This collision-induced
ionization of the argon continues in a chain
reaction, breaking down the gas into argon atoms,
argon ions, and electrons, forming what is known
as an inductively coupled plasma (ICP) discharge.
The sample aerosol is then introduced into the plasma
through a third tube called the sample injector .
First, a tangential (spiral) flow of argon gas is directed between
the outer and middle tube of a quartz torch. A load coil
(usually copper) surrounds the top end of the torch
and is connected to an RF generator.
When RF power (typically 750–1500 W, depending
on the sample) is applied to the load coil,
an alternating current oscillates within the coil
at a rate corresponding to the frequency of
the generator.
EXCITATION
The Mechanism Of Formation Of The Plasma Discharge
In most ICP generators, this frequency is
either 27 or 40 MHz (commonly known as
megahertz or million cycles/second). This RF
oscillation of the current in the coil causes an
intense electromagnetic field to be created in
the area at the top of the torch. With argon gas
flowing through the torch, a high-voltage spark is
applied to the gas, causing some electrons to be
stripped from their argon atoms.
The amount of energy required to generate argon ions in
this process is on the order of 15.8 eV (first ionization
potential),
which is enough
energy to ionize
the majority of
the elements in
the periodic table.
Prepared and issued by : Mohamed Fayed Mohamed Ali
When the plasma is
coupled with the RF
coil inductively, the
plasma has only a slight
dc potential. However,
there is capacitive
coupling between the
plasma and the RF coil,
which creates a positive
plasma potential
oscillating at the radio
frequency of the
plasma source.Prepared and issued by : Mohamed Fayed Mohamed Ali
Interface Region
the process of taking a liquid
sample, generating an
aerosol that is suitable for ionization
in the plasma and then sampling a
representative
number of analyte ions, transporting
them through the interface,
focusing them via the ion optics into
the mass spectrometer, and finally
ending
up with detection and conversion to
an electronic signal is not a trivial
task. Each part of the journey has
its own unique problems to
overcome, but probably
the most challenging is the
movement of the ions from the
plasma into the
mass spectrometer.
Its ImportantThe role of the interface region
The Mechanism
is to transport the ions efficiently, consistently, and with electrical
integrity from the plasma, which is at atmospheric pressure (760 torr),
to the mass spectrometer analyzer region at approximately 10−6 torr.
This is first achieved by directing the
ions into the interface region. The
interface consists of two metallic cones
with very small orifices, which are
maintained at a vacuum of ~1–2 torr
with a mechanical roughing pump.
After the ions are generated in the
plasma, they pass into the first cone,
known as the sampler cone, which has
an orifice of 0.8–1.2 mm i.d.
From there, they travel a short distance
to the skimmer cone, which is generally
smaller and more pointed than the
sampler cone. Ion Extraction Interface
Sample Cones and Skimmer Cones
Both cones are usually made of nickel, but can be made of other materials such as platinum, which is far
more tolerant to corrosive liquids.
To reduce the effects of high-temperature plasma on the cones, the interface housing is water cooled and
made from a material that dissipates heat easily, such as copper or aluminum.
The ions then emerge from the skimmer cone, where they are directed through the ion optics and, finally,
guided into the mass separation device.
- The role of the ion-focusing system
One of the main contributing factors to the low
efficiency is the higher concentration of matrix
elements compared to the analyte, which has the
effect of defocusing the ions and altering the
transmission characteristics of the ion beam.
This is sometimes referred to as a space charge
effect, and can be particularly severe when the matrix
ions are of a heavier mass than the analyte ions.
The role of the ion-focusing system is therefore to
transport the maximum number of analyte ions from
the interface region to the mass separation device,
while rejecting as many of the matrix components and
non-analyte-based species as possible.
Ion Optics and Focusing Systems ( Extraction Lenses )
Sometimes known as the ion optics, it
comprises one or more ion lens components,
which electrostatically steer the analyte ions in
an axial (straight) or orthogonal (right-angled)
direction from the interface region into the
mass separation device.
- The strength of a well-designed ion-focusing
system is its ability to produce a flat signal
response over the entire mass range, low
background levels, good detection limits, and
stable signals in real-world sample matrices.
- a crucial area of the ICP mass spectrometer
where the ion beam is focused before it enters
the mass analyzer.
Prepared and issued by : Mohamed Fayed Mohamed Ali
The ions from the ICP source are then focused by the
electrostatic lenses in the system. Remember, the ions
coming from the system are positively charged, so the
electrostatic lens, which also has a positive charge, serves to
collimate the ion beam and focus it into the entrance
aperture or slit of the mass spectrometer. Different types
of ICP-MS systems have different types of lens systems. The
simplest employs a single lens, while more complex systems
may contain as many as 12 ion lenses. Each ion optic system
is specifically designed to work with the interface and mass
spectrometer design of the instrument.
Why an Octopole Works Best for Collision Mode and KED
Commercial ICP-MS instruments use a CRC containing a multipole ion guide, either a quadrupole (4 rods or
poles), hexapole (6 rods) or octopole (8 rods). Quadrupoles permit mass-selective rejection of ions (e.g. reaction
product ions or precursors to interfering polyatomics), using a user-selected bandpass window. But in order to
select the appropriate reaction gases and cell bandpass, the user must know the matrix composition of each
sample in advance, which is not possible for the unknown or variable samples analyzed in many laboratories.
In contrast, collision mode using He gas and KED is universal, as no analyte- or matrix-specific setup is required.
For effective collision mode operation, an octopole ion guide offers several key advantages:
• An octopole transmits ions over the entire
elemental mass range simultaneously, making it
much more suitable for multi-element analysis under
uniform conditions (no scanning bandpass needed)
• An octopole has a wide stability region (almost all
ions between the rods pass through the cell), and
scattering is minimized when the cell is pressurized.
The wide stability region means that a narrower ion
guide and therefore smaller volume cell can be used.
The narrow ion guide is also better aligned to the ion
beam diameter, meaning more consistent ion
transmission with and without cell gas,
compared to a lower order (quadrupole or hexapole)
ion guide.
Relative size, internal diameter and ion stability regions (in blue) for multipole
ion guides (octopole, hexapole and quadrupole)
Octopole Hexapole Quadrupole
The Importance of Ion Energy Distribution
Just as higher resolution (narrower peaks) allows better separation of
overlapping spectra, so narrower ion energy spread allows better separation of
overlapping ion energies, as illustrated in Figure
For accurate multi-element analysis of unknown and variable sample matrices, the advantages of He collision
mode using KED are indisputable. Effective KED requires an instrument with the technology to minimize initial ion
energy spread, simultaneously and efficiently transmit all masses through the cell, and maximize the number of
collisions while reducing losses due to scattering. This is achieved on the Agilent 7700 Series ICP-MS, using the
Shield Torch System, low voltage ion extraction and the unique octopole based ORS3 collision cell.
Energy achieved by the Ar ICP is
sufficient to cause the majority of
sample atoms passing through it
to exceed their first, but not
second, ionization potentials.
The significance of this is two-
fold: (1) elements from most of the
periodic table will be ionized to a
+1 state, and (2) because the ions
generated will principally differ by
mass, not charge, they can be
focused and separated on the
basis of their inertial masses
within an electrostatic field.
Making Singly Charged
(+1) Ions
Prepared and issued by : Mohamed Fayed Mohamed Ali
A quadrupole mass filter means that we apply both DC and
RF voltages to the quadrupole to create a specific mass
stability range and selectively filter masses of interest.
Other masses, that are not stable at the particular DC and
RF setting are ejected from the ion beam, collide with the
rods and eliminated from any further processes in the
system. A CRC typically uses only an RF field to control
the trajectory of ions through
this component and does
not apply a specific mass filter.
The Quadrupole Mass Spectrometer
Filtering Ions According to Mass-to-Charge (m/z) Ratio
In fact, every attempt is made to stop
the photons from reaching
the detector because they have
the potential to increase signal noise.
It is the production and detection of large
quantities of these ions that gives ICP-MS its
characteristic low-ppt detection capability
about three to four orders of magnitude
better than ICP-OES.
Prepared and issued by : Mohamed Fayed Mohamed Ali
The Quadrupole Mass Spectrometer
Filtering Ions According to Mass-to-Charge (m/z) Ratio
The operation of the Quadrupole Mass Spectrometer (QMS) is not quite so simple to understand as the magnetic sector design, but it is
extremely elegant and involves some beautiful mathematics, and therefore the details are worth appreciating. First, the overall layout:
A quadrupole consists of four parallel
poles, or rods, two that obtain a net
negative charge and two that obtain a
net positive charge. The polarity and
strength of the electromagnetic field
achieved by each set of opposing
rods results from the simultaneous
application of DC and RF (AC)
voltages, which can be increased or
decreased, but are always maintained
in a fixed ratio (typically on the order
of 1:6). The applied DC voltages are
constant but of opposite polarity –
one rod set positive, the other
negative. Meanwhile, the applied RF
current alternates between positive
and negative polarity in the range of
2-3 MHz, with the polarity alternations
maintained exactly out-of-phase
between the opposing rod sets .
In other words, while one set of opposing
rods has an applied positive RF potential,
the other set has an equally applied but
negative RF potential. It is when the
magnitude of the RF polarity field
strength exceeds that of the oppositely
applied DC polarity field strength that a
given set of opposing rods obtains its
effective net polarity, which then affects
ion paths as a function of their inertial
masses. Ion trajectories are ultimately
governed by both sets of rods, but are
more easily understood in terms of the
local electrostatic field between a given
rod set. In this simplification, one set
acts as a high-pass filter (high masses
stable through the quad). The other acts
as a low-pass filter (low masses stable
through the quad).
Upper diagram shows basic configuration of a quadrupole and possible
(spiral) ion flight paths for a given RF/DC. Lower diagram shows how
the voltage potentials applied to opposing rod sets vary through one
RF cycle. U is the unchanging DC potential; V is the variable RF (AC)
potential.
Prepared and issued by : Mohamed Fayed Mohamed Ali
In order to obtain the highest possible sensitivity from the system,
ideally we want the electron multiplier to detect every ion of the
selected mass that is passed by the quadrupole mass filter. How
efficiently the electron multiplier carries out this
task represents a potentially limiting factor on the overall
sensitivity of the system. The signal ions exit the quadrupole with
a broad spread of exit angles and with kinetic energies up to 25eV
When a signal ion strikes the first dynode of the multiplier, it liberates secondary electrons. The electron-optics of
the dynode design provides for acceleration of these secondary electrons to the next dynode in the multiplier, where
they produce more secondary electrons. This process is repeated at each dynode, generating a growing pulse of
electrons that are finally captured by the multiplier collector (or anode). The gain of each dynode depends on the
energy of the secondary electrons striking its surface and is controlled by the inter-dynode voltage. Thus, by
adjusting the high voltage supply, the multiplier can be set to the required gain.
One of the perennial aims of inductively coupled plasma-mass
spectrometer (ICP-MS) development is for higher ion sensitivities
and lower detection limits.
The electron multiplier ion detector plays a key role in determining
the overall detection limits that can be achieved by a mass
spectrometer, influencing both the ion sensitivity and the
background noise levels.
ION DETECTION IN ICP-MS
Prepared and issued by : Mohamed Fayed Mohamed Ali
Once the detector measures the ions, the computerized data system is used to
convert the measured signal intensities into concentrations of each element
and generate a report of the results.
Agilent 7700x Inductively Coupled Plasma
Mass Spectrometer
operation, data acquisition,
processing and reporting
Computer System and Software for System Control, Data Acquisition and Analysis.
Agilent 7700x Inductively Coupled Plasma Mass Spectrometer
operation, data acquisition, processing and reporting
INTRODUCTION
TO
MASS HUNTER
SOFTWARE
Agilent 7700x ICP-MS system is restricted for
use by, or under supervision of experienced
and properly trained personnel.
This Standard Operating Procedure (SOP) provides procedures
for the operation of the Agilent 7700x Inductively Coupled
Plasma Mass Spectrometer (ICP-MS), and for data acquisition,
processing and reporting using the MassHunter software.
Computer System and Software for System Control, Data Acquisition and Analysis.
Preparing for Analysis
-Things to check before analysis ‫التحليل‬ ‫في‬ ‫البدء‬ ‫قبل‬ ‫منه‬ ‫التحقق‬ ‫مايجب‬
Utilities
• Argon gas pressure: 500 to 700 kPa (700 - 500 kPa) ‫األرجون‬ ‫ضغط‬ ‫يتجاوز‬ ‫ال‬
•Cell gas (Helium): 90 to 130 kPa (130 - 90 kPa) ‫الهليوم‬ ‫ضغط‬ ‫يتجاوز‬ ‫ال‬
•Cell gas (Hydrogen): 20 to 60 kPa (700 - 500 kPa) ‫األرجون‬ ‫ضغط‬ ‫يتجاوز‬ ‫ال‬
•Exhaust duct (on) ‫التهوية‬ ‫حضانة‬ ‫فتح‬
•Cooling water (Chiller or heat exchanger on) ‫الحراري‬ ‫المبادل‬ ‫فتح‬
•Drain and rinse tank (not full) ‫بالجهاز‬ ‫الخاص‬ ‫الصرف‬ ‫خزان‬ ‫وتفريغ‬ ‫شطف‬
Peristaltic pump tubing ‫بالمضخه‬ ‫الخاص‬ ‫األنبوب‬
•Sample, drain, and internal standard lines
Computer System and Software for System Control, Data Acquisition and Analysis.
● turn on the instrument and the computer.
● Start the MassHunter software by double clicking ICP-MS Instrument Control icon on the
desktop.
● click Hardware icon on the Task Bar. The Instrument Control window with the diagram of
the instrument status will appear.
● Right-click the Mainframe icon and select Vacuum ON. Click Yes at the dialog box to
confirm.
● It usually takes about 40 minutes for the vacuum chamber to attain its correct pressure
of 5 x 10⁻⁴ Pa, depending on how long the vacuum chamber has been open to the
atmosphere. The LED on the top right side of the top cover and the indicator in the
Instrument Status Pane will be flashing until proper vacuum is achieved.
1- If the instrument is in SHUTDOWN mode
Computer System and Software for System Control, Data Acquisition and Analysis.
2-INSTRUMENT START-UP
2.1 Shield torch must be used all the time when using ICP-MS. For installation of the Shield Torch, refer to the Agilent 7700
Series ICP-MS Hardware Manual.
2.2 The autosampler (ASX-500 Series) should be properly installed and configured for automatic control using MassHunter
software (refer to the (Agilent 7700/7500 Series ICP-MS, ASX-500 Series Autosampler, manual). Turn the autosampler ON.
2.3 Start the ICP-MS MassHunter Workstation software by clicking the ICP-MS Control button
on the Windows desktop ( ). Select Hardware at the Task Bar (Figure 1).
2.4 Select the Autosampler Type (ASX 520) and set the Autosampler Rack configuration. Usually, the 60 positions racks are
used for 10-mL tubes and the 21 position racks are used for the 40-ml tubes.
2.5 Start rinsing the sample probe by clicking Instrument >> ALS Rinse port. The Rinse port should be filled with rinse
solution and drained properly into the waste bottle.
2.6 Fill Bottle 1 with fresh double deionised water (DDW), Bottle 2 with fresh 1% HNO3 and Bottle 3 with tuning solution (1
g/L Li, Y, Tl and Ce, in 2% HNO3). Click the arrow at button and go to Bottle 1
Computer System and Software for System Control, Data Acquisition and Analysis.
● Open the liquid argon (Ar) gas valve and the hydrogen (H2) and/or helium (He) gas cylinders valves.
● Make sure that the outlet pressure of liquid Ar Dewar is more than 100 psi
(or Dewar is more than 30% full) and the gas cylinders pressures are not below 500 psi.
NOTE: If the liquid Ar outlet pressure is lower than 100 psi, turn on the pressure-building valve on the
Dewar; it may have to be kept open during the analysis.
● Check the gas delivery pressures from the switchover gas line system. The Ar gas delivery pressure
should be between 110 -120 psi. Adjust the knob on the switchover system and check the reading of the
Ar pressure from the MassHunter until it is between 700 – 730 kPa.
The H2 or He gas outlet pressure should be 5 psi.
● Make sure that the chiller is ON. The water temperature should be 12 to 15 °C and the water delivery
pressure not less than 50 psi.
● Check the drain vessels of autosampler and instrument, and empty if necessary.
Ignite the plasma.
Computer System and Software for System Control, Data Acquisition and Analysis.
(Figure 1).
● Check the condition of the peristaltic pump tubes and replace if necessary.
Ensure that they are correctly clamped into the peristaltic pump.
● Ensure the autosampler needle is in the Bottle 1
● Complete the “Standby Mode” section of the logbook. The typical values for Ar delivery pressure,
backing pressure and analyser pressure are shown in Appendix A (Table A1).
NOTE: Meter readings are displayed in the Instrument Status Pane. Click View >> Meters… from the top panel and check the boxes of
meters you want to display.
● Select Instrument >> Plasma ON. Click No to confirmation dialog box: Run Startup after plasma ignition?
NOTE: Select Yes ONLY if an automated optimization of hardware components is deemed necessary.
If the instrument is in STANDBY mode, the LED on the top right side of the top
cover and the indicator in the Instrument Status Pane displays an orange light
Computer System and Software for System Control, Data Acquisition and Analysis.
Meter Typical Range Recommended range
Ar Gas Delivery Pressure 720 - 730 kPa 500 to 700 kPa
Backing Pressure 1 to 2 Pa 0.3 to 5 Pa
Analyzer Pressure 1 x 10⁻⁵ to 5 x 10⁻⁵ Pa 1 x 10⁻⁵ to 6 x 10⁻⁴ Pa
Table A1. Typical Range for 7700x instrument parameters at Standby Mode
● When changing to the ANALYSIS mode is completed, the LED on the top right side of the top
cover and the indicator in the Instrument Status Pane will display a green light. Check and
ensure the drain is flowing.
● Wait for at least 45 minutes for the system to stabilize. Then record in the “Analysis Mode”
section of the logbook the following meter readings from the MassHunter: Ar gas tank pressure,
forward and reflected power, interface and backing pressure (IF/BK pressure), analyzer
pressure, cooling water flow rate at the interface and RF generator (RF/WC/IF). The typical
values for these parameters are shown in Appendix A (Table A2).
Computer System and Software for System Control, Data Acquisition and Analysis.
Meter Typical Range Recommended Range
Ar Gas Delivery Pressure 720 - 730 kPa 500 to 700 kPa
Forward power 1400 to 1600 W 700 to 1600 W
Reflected power < 5 W < 20 W
Cooling water flow rate (RF/WC/IF) 1.0 to 2.0 L/min 1.0 to 2.0 L/min
Interface/Backing pressure (IF/BK) 250 to 300 Pa 250 to 490 Pa
Analyzer Pressure in no gas mode 1 x 10⁻⁴ to 2 x 10⁻³ Pa 1 x 10⁻⁴ to 2 x 10⁻³ Pa
Analyzer Pressure in gas mode 5 x 10⁻⁴ to 1 x 10⁻³ Pa NA
Table A2. Typical Range for 7700x instrument parameters at Analysis Mode
CREATING A BATCH
1- In the ICP-MS Instrument Control window click Batch icon on the Task Bar. The acquisition method
(including tuning, acquisition parameters and peripump program), data analysis method and sample list
for a batch are created and stored in a single batch folder
2- Click to validate the method. If there are no errors or warning found, click OK
Otherwise check the Method Error List at the bottom of the screen and make the necessary
corrections.
3- Click to save the batch in the C:AgilentICPMH1Batch Templates folder The
template is now ready and should be used for further analysis..
EXCECUTING THE QUEUE
1 Add the batch to the queue by clicking . Click Yes at the dialog box: Save
changes to the batch and add it to the queue? When the acquisition starts, the ICP-MS Data Analysis
window is opened automatically.
2 Click Queue in the task bar. The current progress status of the automatic acquisition is displayed
in the status bar at the bottom right of the screen. For more details on executing the queue, refer to
the Agilent 7700 Series ICP-MS MassHunter Workstation User's Guide (page 38).
3 In case the analysis cannot be completed before the end of the working hours, make sure to click
the button (it should be highlighted in yellow) so that the plasma will turn off
automatically.
PLASMA TURN-OFF
1 After completing the analysis, rinse the system with 2% HNO3 for at least 5 minutes,
followed by rinsing with DDW for 5 minutes.
2 Select Plasma OFF from the top panel of Instrument Control. A dialogue box will appear
confirming if you wish to turn off the plasma; click “Yes”. Release the peristaltic pump tubing.
3 Close all gas line valves.
4 Turn off the chiller if the instrument will not be used for 3 days or longer.
AUTOSAMPLER TURN-OFF
1 Turn off the autosampler at the end of the analysis by turning off the power switch located at the back of the autosampler.
2 Release the Tygon tubing at the autosampler’s peristaltic pump.
INSTRUMENT SHUT DOWN FOR MAINTENANCE
1 Shut down the instrument when maintenance inside the vacuum chamber is to be performed, or when the
instrument will not be used for a prolonged period of time, e.g. 2 months and longer.
2 To shut down the instrument, THE VACUUM MUST BE TURNED OFF FIRST and THE ARGON SUPPLY MUST
BE ON.
3 When the LED on the top right side of the top cover of the ICP-MS stops flashing (usually takes a few minutes),
turn off the power by pushing the power switch located at lower right of the instrument. Unplug the power supply if
necessary.
REFERENCES
Agilent Technologies, Agilent 7700 Series ICP-MS MassHunter Workstation User Guide, Rev.A, October 2011
Thomas, Robert. Practical guide to ICP-MS : a tutorial for beginners / Robert Thomas. -- 2nd ed. p. cm. --
(Practical spectroscopy)
A Beginner’s Guide to ICP-MS Part I ROBERT THOMAS
Agilent 7700x Inductively Coupled Plasma Mass Spectrometer operation, data acquisition, processing and
reporting Copy No: ## SOP No: 6.22/1.0/S Effective Date: May 13, 2013
Author, Valbona Celo. New document SOP 6.22/1.0/S
Technical Specifications for the procurement of Inductively Coupled Plasma Mass Spectrometer (ICP-MS)
The Easy Guide to: Inductively Coupled Plasma- Mass Spectrometry (ICP-MS)
By Arianne Bazilio & Jacob Weinrich December 2012
The Agilent 7700 Series ICP-MS Printed in USA July 13, 2010 5990-4025EN
Agilent 7500 Inductively Coupled Plasma Mass Spectrometry Course Number H8974A ChemStation Revision 01.XX NT Operating System
Student Manual Revision 1 Gas Chromatography Liquid
INTERNATIONAL JOURNAL OF RESEARCH IN PHARMACY AND CHEMISTRY IJRPC 2012, 2(3) Mahesh Batsala et al
ISSN: 2231 2781
Advanced Lab, Jan. 2008 Mass Spectrometry: Quadrupole Mass Filter
Thank you
Prepared and issued by : Mohamed Fayed Mohamed Ali

Inductively coupled plasma mass spectrometry

  • 1.
    ICP-MS has beenused widely over the years, finding applications in a number of different fields including drinking water, wastewater, natural water systems/hydrogeology, geology and soil science, mining/metallurgy, food sciences. Inductively Coupled Plasma Mass Spectrometry Is an analytical technique used for elemental determinations1. The resulting instrument is capable of identifying trace multi element analysis, often at the part per trillion levels. Prepared and issued by : Mohamed Fayed Mohamed Ali
  • 2.
    Users/Applications of ICP-MS Semiconductor Geological Clinical/ pharmaceutical Environmental Academia Petrochemical Forensic Nuclear
  • 3.
    01 02 - Requires smallamount of sample - Excellent dynamic range - Accommodates organic solvents - Multi-elemental technique - Isotope differentiation and determination - Scanning (semi-quant) capabilities - Superior limits of detection - Limited and well defined interferences Advantages: 01 02 Elemental Analysis ICP-MS Elemental Analysis ICP-OES Disadvantages - Cost of the instrument - Good general-purpose technique - Good dynamic range - Accommodates organic solvents - Multi-elemental technique Advantages: Disadvantages - Cost of the instrument - Limits of detection - Sample volume requirements - Spectral interferences for unknown/complicated matrices Prepared and issued by : Mohamed Fayed Mohamed Ali
  • 4.
    Functional layout ofan ICP-MS Broadly speaking ICP-mass spectrometer system can be described as having three main sections: 1. The sample introduction system, comprising a liquid sample pumping system that carries the sample to a nebulizer, turning the sample into a fine mist. This mist is then fed into the plasma torch that ionizes the sample producing charged elemental ions. The ions are then introduced into the vacuum system via a set of differentially pumped sampling cones. 2. The quadrupole mass filter separates the ions according to their mass-to- charge ratio. 3. The electron multiplier ion detector detects the ions passed by the quadrupole and produces an amplifying signal that can be processed by the detection electronics before being sent to a computer based data acquisition system. Prepared and issued by : Mohamed Fayed Mohamed Ali
  • 5.
    Prepared and issuedby : Mohamed Fayed Mohamed Ali
  • 6.
    An Overview ofICP Mass Spectrometry (Instrument hardware) Even though it can broadly determine the same suite of elements as other atomic spectroscopic techniques, such as flame atomic absorption (FAA), electro thermal atomization (ETA), and inductively coupled plasma optical emission (ICP-OES), ICP-MS has clear advantages in its multielement characteristics, speed of analysis, detection limits, and isotopic capability ICP-MS not only offers extremely low detection limits in the sub parts per trillion (ppt) range, but also enables quantitation at the high parts per million (ppm) level. Principles of Design There are a number of different ICP-MS designs available today that share many similar components, such as nebulizer, spray chamber, plasma torch, and detector, but can differ quite significantly in the design of the interface, ion-focusing system, mass separation device, and vacuum chamber.
  • 7.
    Sample Introduction System themain function of the sample introduction system is to generate a fine aerosol of the sample. It achieves this with a nebulizer and a spray chamber. AEROSOL GENERATION -The sample is normally pumped at about 1 mL/min via a peristaltic pump into the Nebulizer. A peristaltic pump is a small pump with lots of minirollers that all rotate at the same speed. The constant motion and pressure of the rollers on the pump tubing feeds the sample through to the Nebulizer. ●The benefit of a peristaltic pump is that it ensures a constant flow of liquid, irrespective of differences in viscosity between samples, standards, and blanks. ● Once the sample enters the Nebulizer , the liquid is then broken up into a fine aerosol by the pneumatic action of a flow of gas (~1 L/min) “smashing” the liquid into tiny droplets
  • 8.
    let us lookat the greater detail SAMPLE INTRODUCTION SYSTEM Peristaltic pump Spray chamber Nebulizer Prepared and issued by : Mohamed Fayed Mohamed Ali
  • 9.
    Sample Introduction System Themost common of the pneumatic nebulizers used in commercial ICP mass spectrometers are the concentric and cross-flow design types. Nebulizers By far the most common design used for ICP-MS is the pneumatic nebulizer, which uses mechanical forces of a gas flow (normally argon at a pressure of 20–30 psi) to generate the sample aerosol. . The concentric design is the most widely used nebulizer for clean samples, whereas the cross-flow is generally more tolerant to samples containing higher solids and particulate matter. However, recent advances in the concentric design have allowed for the aspiration of these types of samples. The most common of the pneumatic nebulizers used in commercial ICP mass spectrometers are the concentric and cross- flow design types. The concentric design is the most widely used nebulizer for clean samples, whereas the cross- flow is generally more tolerant to samples containing higher solids and particulate matter. However, recent advances in the concentric design have allowed for the aspiration of these types of samples. Prepared and issued by : Mohamed Fayed Mohamed Ali
  • 10.
    Spray Chambers ● Becausethe plasma discharge is not very efficient at dissociating large droplets ● the function of the spray chamber is to reject the larger aerosol droplets and also to smooth out nebulization pulses produced by the peristaltic pump ● In addition, some ICP-MS spray chambers are externally cooled for thermal stability of the sample and to reduce the amount of solvent going into the plasma By far the most common design of the double-pass spray chamber is the Scott design, which selects the small droplets by directing the aerosol into a central tube. The larger droplets emerge from the tube, and by gravity exit the spray chamber via a drain tube. The liquid in the drain tube is kept at positive pressure (usually by way of a loop), which forces the small droplets back between the outer wall and the central tube and emerges from the spray chamber into the sample injector of the plasma torch. Double-pass spray chambers come in a variety of shapes, sizes, and materials, and are generally considered the most rugged design for routine use but the most common type is the double-pass design, where the aerosol from the nebulizer is directed into a central tube running the entire length of the chamber The droplets then travel the length of this tube, where the large droplets (greater than ~10 μm dia.) will fall out by gravity and exit through the drain tube at the end of the spray chamber. The fine droplets (<10 μm dia.) then pass between the outer wall and the central tube. , where they eventually emerge from the spray chamber and are transported into the sample injector of the plasma torch Prepared and issued by : Mohamed Fayed Mohamed Ali
  • 11.
    The fine aerosolthen emerges from the exit tube of the spray chamber and is transported into the plasma torch via a sample injector.
  • 12.
    Principle of HMIis simple – hardware comprises extra gas line to dilute aerosol. However, requires very sophisticated software algorithm to map plasma conditions, and very reproducible hardware to allow conditions to be recalled consistently HMI 􀃆 Robust Plasma → Low Oxide Interferences
  • 14.
    ● In theICP-OES , the plasma which is normally vertical is used to generate photons of light by the Excitation of Electrons of a ground State atom to a higher energy Level. When Electrons fall back to ground state , wavelength specific photons are emitted that are characteristic of the element of interest. In the ICP-MS the plasma torch ,which is positioned horizontally , is used to generate positively charged ions and not photons Prepared and issued by : Mohamed Fayed Mohamed Ali
  • 15.
    Processes in ICP-MS NebulizationDesolvation Vaporization Atomization Ionization Aerosol Particle Molecule Atom Ion Prepared and issued by : Mohamed Fayed Mohamed Ali
  • 16.
    formation of aplasma discharge and how it is used to convert the sample aerosol into a stream of positively charged ions of low kinetic energy required by the ion-focusing system and the mass spectrometer IONIZATION SYSTEM Lets take a look at the region where the ions are generated and the plasma discharge. the components used to create the inductively coupled plasma (ICP) as an excitation source . .ICPs are by far the most common type of plasma sources used in today’s commercial ICP optical emission (ICP-OES) and ICP mass spectrometric (ICP-MS) instrumentation. . However, it was not always that way In the early days, when researchers were attempting to find the ideal plasma source In addition to ICPs, some of the other novel plasma sources developed were direct current plasmas (DCPs) and microwave-induced plasmas (MIPs). Plasma Source Other plasma sources Prepared and issued by : Mohamed Fayed Mohamed Ali
  • 17.
    let us look at the greater detail Thesample, which usually must be in a liquid form, is pumped at 1 mL/min, usually with a peristaltic pump into a nebulizer, where it is converted into a fine aerosol with argon gas at about 1 L/min. The fine droplets of the aerosol, which represent only 1–2% of the sample, are separated from larger droplets by means of a spray chamber. The fine aerosol then emerges from the exit tube of the spray chamber and is transported into the plasma torch via a sample injector It is important to differentiate between the roles of the plasma torch in ICP-MS compared to ICP OES. The plasma is formed in exactly the same way, by the interaction of an intense magnetic field (produced by radio frequency (RF) passing through a copper coil) on a tangential flow of gas (normally argon), at about 15 L/ min flowing through a concentric quartz tube (torch). This has the effect of ionizing the gas, which when seeded with a source of electrons from a high- voltage spark, forms a very-high-temperature plasma discharge (~10,000 K) at the open end of the tube.
  • 18.
    Plasma Source thebasic components used to generate the source a plasma torch, radio-frequency (RF) coil, and power supply. The plasma torch consists of three concentric tubes, which are normally made from quartz. (the outer tube, middle tube, and sample injector ). The Plasma Torch The torch can either be one piece, in which all three tubes are connected, or it can employ a demountable design in which the tubes and the sample injector are separate. The gas (usually argon) that is used to form the plasma (plasma gas) is passed between the outer and middle tubes at a flow rate of ~12–17 L/min. A second gas flow (auxiliary gas) passes between the middle tube and the sample injector at ~1 L/min and is used to change the position of the base of the plasma relative to the tube and the injector. A third gas flow (nebulizer gas), also at ~1 L/min, brings the sample, in the form of a fine-droplet aerosol, from the sample introduction system although argon is the most suitable gas to use for all three flows, there are analytical benefits in using other gas mixtures, especially in the nebulizer flow.
  • 20.
    Formation of anICP Discharge These electrons, which are caught up and accelerated in the magnetic field, then collide with other argon atoms, stripping off still more electrons. This collision-induced ionization of the argon continues in a chain reaction, breaking down the gas into argon atoms, argon ions, and electrons, forming what is known as an inductively coupled plasma (ICP) discharge. The sample aerosol is then introduced into the plasma through a third tube called the sample injector . First, a tangential (spiral) flow of argon gas is directed between the outer and middle tube of a quartz torch. A load coil (usually copper) surrounds the top end of the torch and is connected to an RF generator. When RF power (typically 750–1500 W, depending on the sample) is applied to the load coil, an alternating current oscillates within the coil at a rate corresponding to the frequency of the generator. EXCITATION The Mechanism Of Formation Of The Plasma Discharge In most ICP generators, this frequency is either 27 or 40 MHz (commonly known as megahertz or million cycles/second). This RF oscillation of the current in the coil causes an intense electromagnetic field to be created in the area at the top of the torch. With argon gas flowing through the torch, a high-voltage spark is applied to the gas, causing some electrons to be stripped from their argon atoms. The amount of energy required to generate argon ions in this process is on the order of 15.8 eV (first ionization potential), which is enough energy to ionize the majority of the elements in the periodic table. Prepared and issued by : Mohamed Fayed Mohamed Ali
  • 21.
    When the plasmais coupled with the RF coil inductively, the plasma has only a slight dc potential. However, there is capacitive coupling between the plasma and the RF coil, which creates a positive plasma potential oscillating at the radio frequency of the plasma source.Prepared and issued by : Mohamed Fayed Mohamed Ali
  • 22.
    Interface Region the processof taking a liquid sample, generating an aerosol that is suitable for ionization in the plasma and then sampling a representative number of analyte ions, transporting them through the interface, focusing them via the ion optics into the mass spectrometer, and finally ending up with detection and conversion to an electronic signal is not a trivial task. Each part of the journey has its own unique problems to overcome, but probably the most challenging is the movement of the ions from the plasma into the mass spectrometer. Its ImportantThe role of the interface region The Mechanism is to transport the ions efficiently, consistently, and with electrical integrity from the plasma, which is at atmospheric pressure (760 torr), to the mass spectrometer analyzer region at approximately 10−6 torr. This is first achieved by directing the ions into the interface region. The interface consists of two metallic cones with very small orifices, which are maintained at a vacuum of ~1–2 torr with a mechanical roughing pump. After the ions are generated in the plasma, they pass into the first cone, known as the sampler cone, which has an orifice of 0.8–1.2 mm i.d. From there, they travel a short distance to the skimmer cone, which is generally smaller and more pointed than the sampler cone. Ion Extraction Interface Sample Cones and Skimmer Cones
  • 23.
    Both cones areusually made of nickel, but can be made of other materials such as platinum, which is far more tolerant to corrosive liquids. To reduce the effects of high-temperature plasma on the cones, the interface housing is water cooled and made from a material that dissipates heat easily, such as copper or aluminum. The ions then emerge from the skimmer cone, where they are directed through the ion optics and, finally, guided into the mass separation device.
  • 24.
    - The roleof the ion-focusing system One of the main contributing factors to the low efficiency is the higher concentration of matrix elements compared to the analyte, which has the effect of defocusing the ions and altering the transmission characteristics of the ion beam. This is sometimes referred to as a space charge effect, and can be particularly severe when the matrix ions are of a heavier mass than the analyte ions. The role of the ion-focusing system is therefore to transport the maximum number of analyte ions from the interface region to the mass separation device, while rejecting as many of the matrix components and non-analyte-based species as possible. Ion Optics and Focusing Systems ( Extraction Lenses ) Sometimes known as the ion optics, it comprises one or more ion lens components, which electrostatically steer the analyte ions in an axial (straight) or orthogonal (right-angled) direction from the interface region into the mass separation device. - The strength of a well-designed ion-focusing system is its ability to produce a flat signal response over the entire mass range, low background levels, good detection limits, and stable signals in real-world sample matrices. - a crucial area of the ICP mass spectrometer where the ion beam is focused before it enters the mass analyzer. Prepared and issued by : Mohamed Fayed Mohamed Ali
  • 26.
    The ions fromthe ICP source are then focused by the electrostatic lenses in the system. Remember, the ions coming from the system are positively charged, so the electrostatic lens, which also has a positive charge, serves to collimate the ion beam and focus it into the entrance aperture or slit of the mass spectrometer. Different types of ICP-MS systems have different types of lens systems. The simplest employs a single lens, while more complex systems may contain as many as 12 ion lenses. Each ion optic system is specifically designed to work with the interface and mass spectrometer design of the instrument.
  • 27.
    Why an OctopoleWorks Best for Collision Mode and KED Commercial ICP-MS instruments use a CRC containing a multipole ion guide, either a quadrupole (4 rods or poles), hexapole (6 rods) or octopole (8 rods). Quadrupoles permit mass-selective rejection of ions (e.g. reaction product ions or precursors to interfering polyatomics), using a user-selected bandpass window. But in order to select the appropriate reaction gases and cell bandpass, the user must know the matrix composition of each sample in advance, which is not possible for the unknown or variable samples analyzed in many laboratories. In contrast, collision mode using He gas and KED is universal, as no analyte- or matrix-specific setup is required. For effective collision mode operation, an octopole ion guide offers several key advantages: • An octopole transmits ions over the entire elemental mass range simultaneously, making it much more suitable for multi-element analysis under uniform conditions (no scanning bandpass needed) • An octopole has a wide stability region (almost all ions between the rods pass through the cell), and scattering is minimized when the cell is pressurized. The wide stability region means that a narrower ion guide and therefore smaller volume cell can be used. The narrow ion guide is also better aligned to the ion beam diameter, meaning more consistent ion transmission with and without cell gas, compared to a lower order (quadrupole or hexapole) ion guide. Relative size, internal diameter and ion stability regions (in blue) for multipole ion guides (octopole, hexapole and quadrupole) Octopole Hexapole Quadrupole
  • 29.
    The Importance ofIon Energy Distribution Just as higher resolution (narrower peaks) allows better separation of overlapping spectra, so narrower ion energy spread allows better separation of overlapping ion energies, as illustrated in Figure For accurate multi-element analysis of unknown and variable sample matrices, the advantages of He collision mode using KED are indisputable. Effective KED requires an instrument with the technology to minimize initial ion energy spread, simultaneously and efficiently transmit all masses through the cell, and maximize the number of collisions while reducing losses due to scattering. This is achieved on the Agilent 7700 Series ICP-MS, using the Shield Torch System, low voltage ion extraction and the unique octopole based ORS3 collision cell.
  • 30.
    Energy achieved bythe Ar ICP is sufficient to cause the majority of sample atoms passing through it to exceed their first, but not second, ionization potentials. The significance of this is two- fold: (1) elements from most of the periodic table will be ionized to a +1 state, and (2) because the ions generated will principally differ by mass, not charge, they can be focused and separated on the basis of their inertial masses within an electrostatic field. Making Singly Charged (+1) Ions Prepared and issued by : Mohamed Fayed Mohamed Ali
  • 31.
    A quadrupole massfilter means that we apply both DC and RF voltages to the quadrupole to create a specific mass stability range and selectively filter masses of interest. Other masses, that are not stable at the particular DC and RF setting are ejected from the ion beam, collide with the rods and eliminated from any further processes in the system. A CRC typically uses only an RF field to control the trajectory of ions through this component and does not apply a specific mass filter. The Quadrupole Mass Spectrometer Filtering Ions According to Mass-to-Charge (m/z) Ratio In fact, every attempt is made to stop the photons from reaching the detector because they have the potential to increase signal noise. It is the production and detection of large quantities of these ions that gives ICP-MS its characteristic low-ppt detection capability about three to four orders of magnitude better than ICP-OES. Prepared and issued by : Mohamed Fayed Mohamed Ali
  • 33.
    The Quadrupole MassSpectrometer Filtering Ions According to Mass-to-Charge (m/z) Ratio The operation of the Quadrupole Mass Spectrometer (QMS) is not quite so simple to understand as the magnetic sector design, but it is extremely elegant and involves some beautiful mathematics, and therefore the details are worth appreciating. First, the overall layout: A quadrupole consists of four parallel poles, or rods, two that obtain a net negative charge and two that obtain a net positive charge. The polarity and strength of the electromagnetic field achieved by each set of opposing rods results from the simultaneous application of DC and RF (AC) voltages, which can be increased or decreased, but are always maintained in a fixed ratio (typically on the order of 1:6). The applied DC voltages are constant but of opposite polarity – one rod set positive, the other negative. Meanwhile, the applied RF current alternates between positive and negative polarity in the range of 2-3 MHz, with the polarity alternations maintained exactly out-of-phase between the opposing rod sets . In other words, while one set of opposing rods has an applied positive RF potential, the other set has an equally applied but negative RF potential. It is when the magnitude of the RF polarity field strength exceeds that of the oppositely applied DC polarity field strength that a given set of opposing rods obtains its effective net polarity, which then affects ion paths as a function of their inertial masses. Ion trajectories are ultimately governed by both sets of rods, but are more easily understood in terms of the local electrostatic field between a given rod set. In this simplification, one set acts as a high-pass filter (high masses stable through the quad). The other acts as a low-pass filter (low masses stable through the quad). Upper diagram shows basic configuration of a quadrupole and possible (spiral) ion flight paths for a given RF/DC. Lower diagram shows how the voltage potentials applied to opposing rod sets vary through one RF cycle. U is the unchanging DC potential; V is the variable RF (AC) potential. Prepared and issued by : Mohamed Fayed Mohamed Ali
  • 34.
    In order toobtain the highest possible sensitivity from the system, ideally we want the electron multiplier to detect every ion of the selected mass that is passed by the quadrupole mass filter. How efficiently the electron multiplier carries out this task represents a potentially limiting factor on the overall sensitivity of the system. The signal ions exit the quadrupole with a broad spread of exit angles and with kinetic energies up to 25eV When a signal ion strikes the first dynode of the multiplier, it liberates secondary electrons. The electron-optics of the dynode design provides for acceleration of these secondary electrons to the next dynode in the multiplier, where they produce more secondary electrons. This process is repeated at each dynode, generating a growing pulse of electrons that are finally captured by the multiplier collector (or anode). The gain of each dynode depends on the energy of the secondary electrons striking its surface and is controlled by the inter-dynode voltage. Thus, by adjusting the high voltage supply, the multiplier can be set to the required gain. One of the perennial aims of inductively coupled plasma-mass spectrometer (ICP-MS) development is for higher ion sensitivities and lower detection limits. The electron multiplier ion detector plays a key role in determining the overall detection limits that can be achieved by a mass spectrometer, influencing both the ion sensitivity and the background noise levels. ION DETECTION IN ICP-MS Prepared and issued by : Mohamed Fayed Mohamed Ali
  • 35.
    Once the detectormeasures the ions, the computerized data system is used to convert the measured signal intensities into concentrations of each element and generate a report of the results.
  • 37.
    Agilent 7700x InductivelyCoupled Plasma Mass Spectrometer operation, data acquisition, processing and reporting Computer System and Software for System Control, Data Acquisition and Analysis.
  • 38.
    Agilent 7700x InductivelyCoupled Plasma Mass Spectrometer operation, data acquisition, processing and reporting INTRODUCTION TO MASS HUNTER SOFTWARE Agilent 7700x ICP-MS system is restricted for use by, or under supervision of experienced and properly trained personnel. This Standard Operating Procedure (SOP) provides procedures for the operation of the Agilent 7700x Inductively Coupled Plasma Mass Spectrometer (ICP-MS), and for data acquisition, processing and reporting using the MassHunter software. Computer System and Software for System Control, Data Acquisition and Analysis.
  • 39.
    Preparing for Analysis -Thingsto check before analysis ‫التحليل‬ ‫في‬ ‫البدء‬ ‫قبل‬ ‫منه‬ ‫التحقق‬ ‫مايجب‬ Utilities • Argon gas pressure: 500 to 700 kPa (700 - 500 kPa) ‫األرجون‬ ‫ضغط‬ ‫يتجاوز‬ ‫ال‬ •Cell gas (Helium): 90 to 130 kPa (130 - 90 kPa) ‫الهليوم‬ ‫ضغط‬ ‫يتجاوز‬ ‫ال‬ •Cell gas (Hydrogen): 20 to 60 kPa (700 - 500 kPa) ‫األرجون‬ ‫ضغط‬ ‫يتجاوز‬ ‫ال‬ •Exhaust duct (on) ‫التهوية‬ ‫حضانة‬ ‫فتح‬ •Cooling water (Chiller or heat exchanger on) ‫الحراري‬ ‫المبادل‬ ‫فتح‬ •Drain and rinse tank (not full) ‫بالجهاز‬ ‫الخاص‬ ‫الصرف‬ ‫خزان‬ ‫وتفريغ‬ ‫شطف‬ Peristaltic pump tubing ‫بالمضخه‬ ‫الخاص‬ ‫األنبوب‬ •Sample, drain, and internal standard lines Computer System and Software for System Control, Data Acquisition and Analysis.
  • 40.
    ● turn onthe instrument and the computer. ● Start the MassHunter software by double clicking ICP-MS Instrument Control icon on the desktop. ● click Hardware icon on the Task Bar. The Instrument Control window with the diagram of the instrument status will appear. ● Right-click the Mainframe icon and select Vacuum ON. Click Yes at the dialog box to confirm. ● It usually takes about 40 minutes for the vacuum chamber to attain its correct pressure of 5 x 10⁻⁴ Pa, depending on how long the vacuum chamber has been open to the atmosphere. The LED on the top right side of the top cover and the indicator in the Instrument Status Pane will be flashing until proper vacuum is achieved. 1- If the instrument is in SHUTDOWN mode Computer System and Software for System Control, Data Acquisition and Analysis.
  • 41.
    2-INSTRUMENT START-UP 2.1 Shieldtorch must be used all the time when using ICP-MS. For installation of the Shield Torch, refer to the Agilent 7700 Series ICP-MS Hardware Manual. 2.2 The autosampler (ASX-500 Series) should be properly installed and configured for automatic control using MassHunter software (refer to the (Agilent 7700/7500 Series ICP-MS, ASX-500 Series Autosampler, manual). Turn the autosampler ON. 2.3 Start the ICP-MS MassHunter Workstation software by clicking the ICP-MS Control button on the Windows desktop ( ). Select Hardware at the Task Bar (Figure 1). 2.4 Select the Autosampler Type (ASX 520) and set the Autosampler Rack configuration. Usually, the 60 positions racks are used for 10-mL tubes and the 21 position racks are used for the 40-ml tubes. 2.5 Start rinsing the sample probe by clicking Instrument >> ALS Rinse port. The Rinse port should be filled with rinse solution and drained properly into the waste bottle. 2.6 Fill Bottle 1 with fresh double deionised water (DDW), Bottle 2 with fresh 1% HNO3 and Bottle 3 with tuning solution (1 g/L Li, Y, Tl and Ce, in 2% HNO3). Click the arrow at button and go to Bottle 1 Computer System and Software for System Control, Data Acquisition and Analysis.
  • 42.
    ● Open theliquid argon (Ar) gas valve and the hydrogen (H2) and/or helium (He) gas cylinders valves. ● Make sure that the outlet pressure of liquid Ar Dewar is more than 100 psi (or Dewar is more than 30% full) and the gas cylinders pressures are not below 500 psi. NOTE: If the liquid Ar outlet pressure is lower than 100 psi, turn on the pressure-building valve on the Dewar; it may have to be kept open during the analysis. ● Check the gas delivery pressures from the switchover gas line system. The Ar gas delivery pressure should be between 110 -120 psi. Adjust the knob on the switchover system and check the reading of the Ar pressure from the MassHunter until it is between 700 – 730 kPa. The H2 or He gas outlet pressure should be 5 psi. ● Make sure that the chiller is ON. The water temperature should be 12 to 15 °C and the water delivery pressure not less than 50 psi. ● Check the drain vessels of autosampler and instrument, and empty if necessary. Ignite the plasma. Computer System and Software for System Control, Data Acquisition and Analysis.
  • 43.
  • 44.
    ● Check thecondition of the peristaltic pump tubes and replace if necessary. Ensure that they are correctly clamped into the peristaltic pump. ● Ensure the autosampler needle is in the Bottle 1 ● Complete the “Standby Mode” section of the logbook. The typical values for Ar delivery pressure, backing pressure and analyser pressure are shown in Appendix A (Table A1). NOTE: Meter readings are displayed in the Instrument Status Pane. Click View >> Meters… from the top panel and check the boxes of meters you want to display. ● Select Instrument >> Plasma ON. Click No to confirmation dialog box: Run Startup after plasma ignition? NOTE: Select Yes ONLY if an automated optimization of hardware components is deemed necessary. If the instrument is in STANDBY mode, the LED on the top right side of the top cover and the indicator in the Instrument Status Pane displays an orange light Computer System and Software for System Control, Data Acquisition and Analysis. Meter Typical Range Recommended range Ar Gas Delivery Pressure 720 - 730 kPa 500 to 700 kPa Backing Pressure 1 to 2 Pa 0.3 to 5 Pa Analyzer Pressure 1 x 10⁻⁵ to 5 x 10⁻⁵ Pa 1 x 10⁻⁵ to 6 x 10⁻⁴ Pa Table A1. Typical Range for 7700x instrument parameters at Standby Mode
  • 45.
    ● When changingto the ANALYSIS mode is completed, the LED on the top right side of the top cover and the indicator in the Instrument Status Pane will display a green light. Check and ensure the drain is flowing. ● Wait for at least 45 minutes for the system to stabilize. Then record in the “Analysis Mode” section of the logbook the following meter readings from the MassHunter: Ar gas tank pressure, forward and reflected power, interface and backing pressure (IF/BK pressure), analyzer pressure, cooling water flow rate at the interface and RF generator (RF/WC/IF). The typical values for these parameters are shown in Appendix A (Table A2). Computer System and Software for System Control, Data Acquisition and Analysis. Meter Typical Range Recommended Range Ar Gas Delivery Pressure 720 - 730 kPa 500 to 700 kPa Forward power 1400 to 1600 W 700 to 1600 W Reflected power < 5 W < 20 W Cooling water flow rate (RF/WC/IF) 1.0 to 2.0 L/min 1.0 to 2.0 L/min Interface/Backing pressure (IF/BK) 250 to 300 Pa 250 to 490 Pa Analyzer Pressure in no gas mode 1 x 10⁻⁴ to 2 x 10⁻³ Pa 1 x 10⁻⁴ to 2 x 10⁻³ Pa Analyzer Pressure in gas mode 5 x 10⁻⁴ to 1 x 10⁻³ Pa NA Table A2. Typical Range for 7700x instrument parameters at Analysis Mode
  • 46.
    CREATING A BATCH 1-In the ICP-MS Instrument Control window click Batch icon on the Task Bar. The acquisition method (including tuning, acquisition parameters and peripump program), data analysis method and sample list for a batch are created and stored in a single batch folder 2- Click to validate the method. If there are no errors or warning found, click OK Otherwise check the Method Error List at the bottom of the screen and make the necessary corrections. 3- Click to save the batch in the C:AgilentICPMH1Batch Templates folder The template is now ready and should be used for further analysis.. EXCECUTING THE QUEUE 1 Add the batch to the queue by clicking . Click Yes at the dialog box: Save changes to the batch and add it to the queue? When the acquisition starts, the ICP-MS Data Analysis window is opened automatically. 2 Click Queue in the task bar. The current progress status of the automatic acquisition is displayed in the status bar at the bottom right of the screen. For more details on executing the queue, refer to the Agilent 7700 Series ICP-MS MassHunter Workstation User's Guide (page 38). 3 In case the analysis cannot be completed before the end of the working hours, make sure to click the button (it should be highlighted in yellow) so that the plasma will turn off automatically.
  • 47.
    PLASMA TURN-OFF 1 Aftercompleting the analysis, rinse the system with 2% HNO3 for at least 5 minutes, followed by rinsing with DDW for 5 minutes. 2 Select Plasma OFF from the top panel of Instrument Control. A dialogue box will appear confirming if you wish to turn off the plasma; click “Yes”. Release the peristaltic pump tubing. 3 Close all gas line valves. 4 Turn off the chiller if the instrument will not be used for 3 days or longer. AUTOSAMPLER TURN-OFF 1 Turn off the autosampler at the end of the analysis by turning off the power switch located at the back of the autosampler. 2 Release the Tygon tubing at the autosampler’s peristaltic pump. INSTRUMENT SHUT DOWN FOR MAINTENANCE 1 Shut down the instrument when maintenance inside the vacuum chamber is to be performed, or when the instrument will not be used for a prolonged period of time, e.g. 2 months and longer. 2 To shut down the instrument, THE VACUUM MUST BE TURNED OFF FIRST and THE ARGON SUPPLY MUST BE ON. 3 When the LED on the top right side of the top cover of the ICP-MS stops flashing (usually takes a few minutes), turn off the power by pushing the power switch located at lower right of the instrument. Unplug the power supply if necessary.
  • 48.
    REFERENCES Agilent Technologies, Agilent7700 Series ICP-MS MassHunter Workstation User Guide, Rev.A, October 2011 Thomas, Robert. Practical guide to ICP-MS : a tutorial for beginners / Robert Thomas. -- 2nd ed. p. cm. -- (Practical spectroscopy) A Beginner’s Guide to ICP-MS Part I ROBERT THOMAS Agilent 7700x Inductively Coupled Plasma Mass Spectrometer operation, data acquisition, processing and reporting Copy No: ## SOP No: 6.22/1.0/S Effective Date: May 13, 2013 Author, Valbona Celo. New document SOP 6.22/1.0/S Technical Specifications for the procurement of Inductively Coupled Plasma Mass Spectrometer (ICP-MS) The Easy Guide to: Inductively Coupled Plasma- Mass Spectrometry (ICP-MS) By Arianne Bazilio & Jacob Weinrich December 2012 The Agilent 7700 Series ICP-MS Printed in USA July 13, 2010 5990-4025EN Agilent 7500 Inductively Coupled Plasma Mass Spectrometry Course Number H8974A ChemStation Revision 01.XX NT Operating System Student Manual Revision 1 Gas Chromatography Liquid INTERNATIONAL JOURNAL OF RESEARCH IN PHARMACY AND CHEMISTRY IJRPC 2012, 2(3) Mahesh Batsala et al ISSN: 2231 2781 Advanced Lab, Jan. 2008 Mass Spectrometry: Quadrupole Mass Filter Thank you Prepared and issued by : Mohamed Fayed Mohamed Ali