2
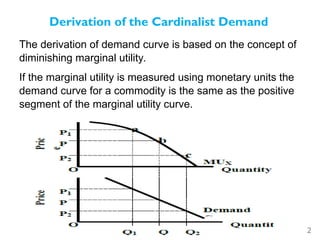
Derivation of theCardinalist Demand
The derivation of demand curve is based on the concept of
diminishing marginal utility.
If the marginal utility is measured using monetary units the
demand curve for a commodity is the same as the positive
segment of the marginal utility curve.
3.
3
Limitation of theCardinalist approach
1. The assumption of cardinal utility is doubtful
because utility may not be quantified.
2. Utility can not be measured absolutely
(objectively). The satisfaction obtained from
different commodities can not be measured
objectively.
3. The assumption of constant MU of money is
unrealistic because as income increases, the
marginal utility of money changes.
4.
4
The ordinal utilitytheory
The ordinal utility theory is also known as the indifference
curve approach.
It is not possible for consumers to express the utility of
various commodities they consume in absolute terms, like 1
util, 2 utils, or 3 utils,
But it is possible to express the utility in relative terms (in
ordinal terms).
Consumers can rank commodities in the order of their
preferences as 1st, 2nd, 3rd and so on.
Therefore, the consumer need not know in specific units the
utility of various commodities to make his choice.
5.
5
Assumptions of ordinalutility theory
1. Consumers are rational
2. Utility is ordinal - utility is not absolutely (cardinally)
measurable.
3. Diminishing marginal rate of substitution (MRS): MRS
is the rate at which a consumer is willing to substitute
one commodity for another commodity so that his total
satisfaction remains the same.
4. The total utility of a consumer is measured by the
quantities of all items he/she consumes from his/her
consumption basket.
5. Consumer’s preferences are consistent and transitive.
6.
6
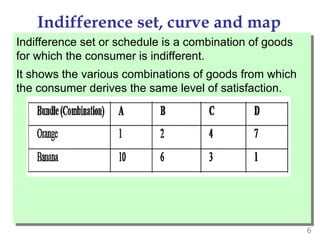
Indifference set, curveand map
Indifference set or schedule is a combination of goods
for which the consumer is indifferent.
It shows the various combinations of goods from which
the consumer derives the same level of satisfaction.
7.
7
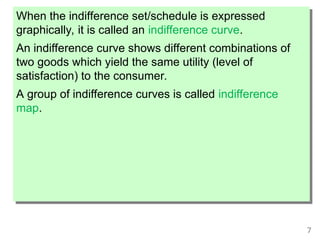
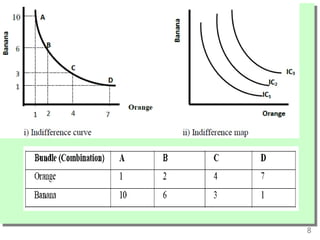
When the indifferenceset/schedule is expressed
graphically, it is called an indifference curve.
An indifference curve shows different combinations of
two goods which yield the same utility (level of
satisfaction) to the consumer.
A group of indifference curves is called indifference
map.
9
Properties of indifferencecurves (ICs)
1. Indifference curves have negative slope
Implies the consumption one good can be increased only
by reducing the consumption of the other.
To keep the utility constant, as the quantity of one good is
increased the other must be decreased.
Shows trade-off and substitution between goods
2. ICs are convex to the origin
implies that slope of an IC decreases as we move along
the curve from the left to the right.
Also, implies that MRS diminishes.
Commodities can substitute one another at any point on an
indifference curve but are not perfect substitutes.
10.
10
3. A higherindifference curve is always preferred to a
lower one
The further away from the origin an indifferent curve lies,
the higher the level of utility it denotes.
A higher indifference curve contains more of the two
commodities than the lower ones.
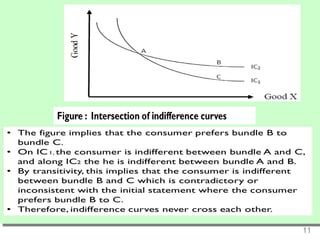
4. Indifference curves never cross each other (cannot
intersect).
Intersection of ICs rules out the assumptions of
consistency and transitivity
The figure below shows the violations of the assumptions
of preferences due to the intersection of indifference
curves.
12
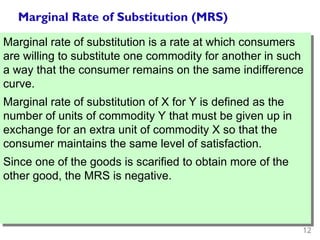
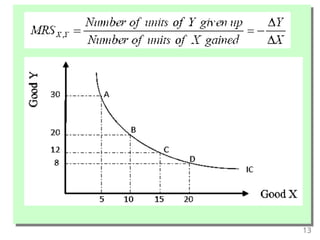
Marginal Rate ofSubstitution (MRS)
Marginal rate of substitution is a rate at which consumers
are willing to substitute one commodity for another in such
a way that the consumer remains on the same indifference
curve.
Marginal rate of substitution of X for Y is defined as the
number of units of commodity Y that must be given up in
exchange for an extra unit of commodity X so that the
consumer maintains the same level of satisfaction.
Since one of the goods is scarified to obtain more of the
other good, the MRS is negative.
14
Special Indifference Curves
Convexityor down ward sloping is among the
characteristics of indifference curve and this shape of
indifference curve is for most goods.
In this situation, we assume that two commodities such as
x and y can substitute one another to a certain extent but
are not perfect substitutes.
However, the shape of the indifference curve will be
different if commodities have some other unique
relationship.
15.
15
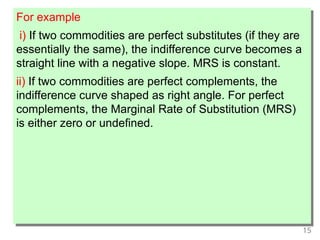
For example
i) Iftwo commodities are perfect substitutes (if they are
essentially the same), the indifference curve becomes a
straight line with a negative slope. MRS is constant.
ii) If two commodities are perfect complements, the
indifference curve shaped as right angle. For perfect
complements, the Marginal Rate of Substitution (MRS)
is either zero or undefined.
16.
16
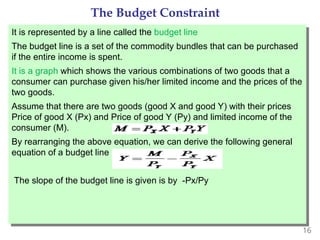
The Budget Constraint
Itis represented by a line called the budget line
The budget line is a set of the commodity bundles that can be purchased
if the entire income is spent.
It is a graph which shows the various combinations of two goods that a
consumer can purchase given his/her limited income and the prices of the
two goods.
Assume that there are two goods (good X and good Y) with their prices
Price of good X (Px) and Price of good Y (Py) and limited income of the
consumer (M).
By rearranging the above equation, we can derive the following general
equation of a budget line
The slope of the budget line is given is by -Px/Py
17.
17
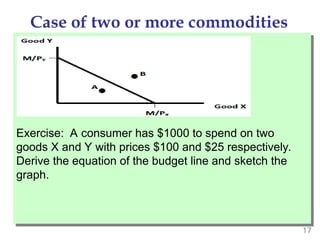
Case of twoor more commodities
Exercise: A consumer has $1000 to spend on two
goods X and Y with prices $100 and $25 respectively.
Derive the equation of the budget line and sketch the
graph.
18.
18
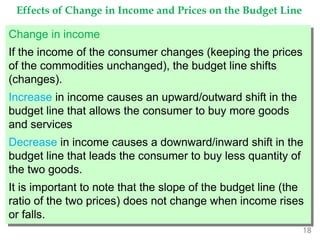
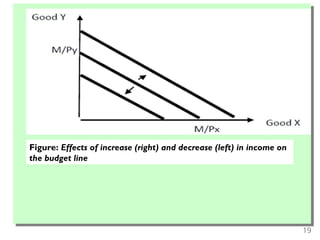
Effects of Changein Income and Prices on the Budget Line
Change in income
If the income of the consumer changes (keeping the prices
of the commodities unchanged), the budget line shifts
(changes).
Increase in income causes an upward/outward shift in the
budget line that allows the consumer to buy more goods
and services
Decrease in income causes a downward/inward shift in the
budget line that leads the consumer to buy less quantity of
the two goods.
It is important to note that the slope of the budget line (the
ratio of the two prices) does not change when income rises
or falls.
19.
19
Figure: Effects ofincrease (right) and decrease (left) in income on
the budget line
20.
20
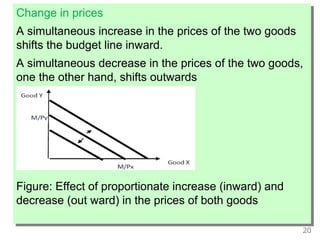
Change in prices
Asimultaneous increase in the prices of the two goods
shifts the budget line inward.
A simultaneous decrease in the prices of the two goods,
one the other hand, shifts outwards
Figure: Effect of proportionate increase (inward) and
decrease (out ward) in the prices of both goods
21.
21
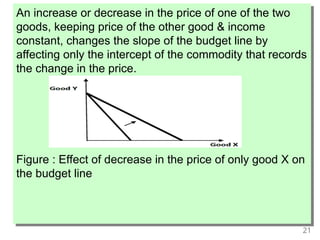
An increase ordecrease in the price of one of the two
goods, keeping price of the other good & income
constant, changes the slope of the budget line by
affecting only the intercept of the commodity that records
the change in the price.
Figure : Effect of decrease in the price of only good X on
the budget line