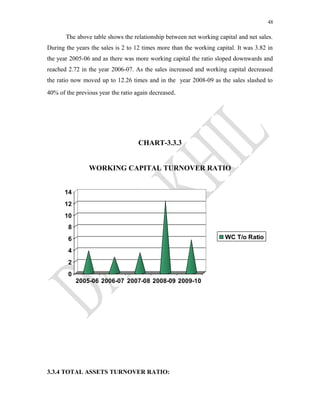
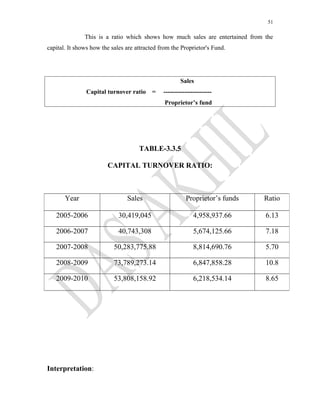
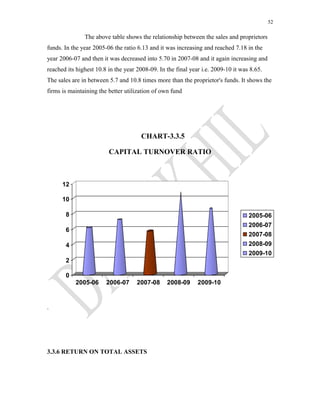
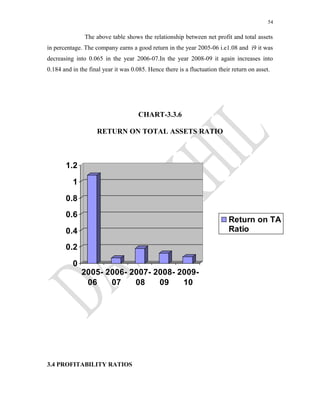
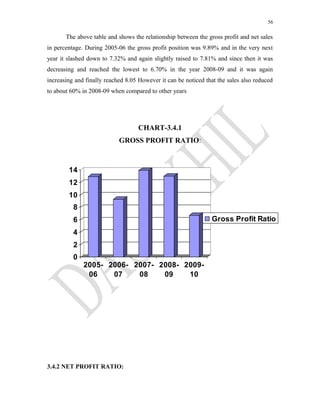
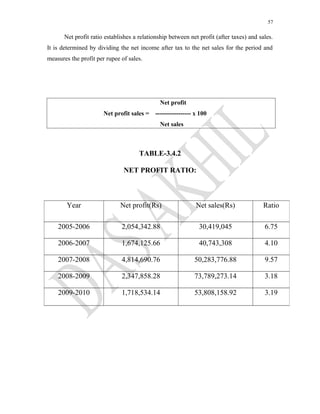
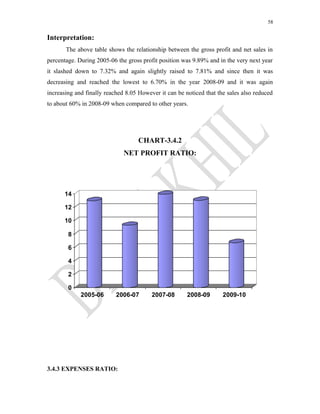
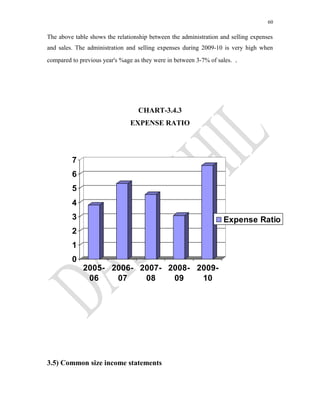
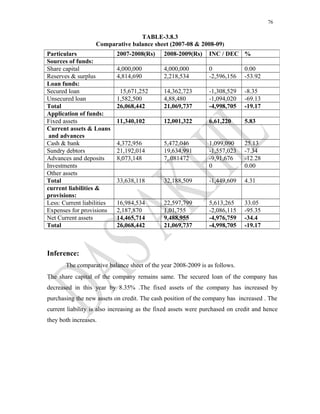
CONTENTS
LIST OF TABLES
S.NO TITLE PAGE NO
1.
Abstract
List of tables
List of figure
1 Introduction
1.1 Industry Profile
1.2 Company Profile
1.3 Objectives of the study
1.4 Scope of the study
1.5 Limitations of the study
1. 6Review of literature
01
04
11
16
17
17
18
2. Research Methodology 21
3. Data Analysis and Interpretation 23
4. Findings 72
5. Suggestion 74
6. Conclusion 75
Appendix 76
Bibliography 77
TABLE
NO
PARTICULRS
PAGE
NO
3.1.1 Current ratio
24
3.1.2 Liquid ratio 26
3.1.3 Absolute liquidity ratio 28
3.2.1 Debt equity ratio
30
3.2.2 Proprietary ratio
32
3.3.1 Stock turnover ratio
34
3.3.2 Fixed assets turnover ratio
36
3.3.3 Working capital turnover ratio
38
3.3.4 Total assets turnover ratio
40
3.3.5 Capital turnover ratio
42
3.3.6 Return on total assets
44
3.4.1 Gross profit ratio
46
3.4.2 Net profit ratio
48
3.4.3 Expenses ratio
50
3.5.1 Common Size Income Statement (2006, 2007)
52
3.5.2 Common Size Income Statement (2007, 2008)
53
3.5.3 Common Size Income Statement (2008, 2009)
54
3.5.4 Common Size Income Statement (2009, 2010)
55
3.6.1 Common Size Balance Sheet (2006, 2007)
56
3.6.2 Common Size Balance Sheet (2007, 2008)
57
3.6.3 Common Size Balance Sheet (2008, 2009)
58
3.6.4 Common Size Balance Sheet (2009, 2010)
59
3.7.1 Comparative income Statement (2006, 2007)
60
3.7.2 Comparative income Statement (2007, 2008)
61
3.7.3 Comparative income Statement (2008, 2009)
62
LIST OF CHARTS
FIGURE
NO
PARTICULRS PAGE NO
3.1.1 Current ratio 25
3.1.2 Liquid ratio 27
3.1.3 Absolute liquidity ratio 29
3.2.1 Debt equity ratio 31
3.2.2 Proprietary ratio 33
3.3.1 Stock turnover ratio 35
3.3.2 Fixed assets turnover ratio 37
3.3.3 Working capital turnover ratio 39
3.3.4 Total assets turnover ratio 41
3.3.5 Capital turnover ratio 43
3.3.6 Return on total assets 45
3.4.1 Gross profit ratio 47
3.4.2 Net profit ratio 49
3.4.3 Expenses ratio 51
ABSTRACT
ABSTRACT
Finance has been described as a lubricant of economic activity, without which the
entire business will grind to a halt. And money has been aptly described by monitory
economist called Geoffrey Crowther, “Finance as the essential invitation on which all the
rest is based. With unlimited wants and limited financial resources, the financier is
concerned with what is produced, requirements of funds (liquid and illiquid ), allocation
of funds selection of developmental priorities, determination of gestation periods, proper
monitoring of accounts to avoid cash flow problems and to ensure the profitability of the
enterprises.
The main objective of financial performance analysis to judge the financial health
the undertaking and to judge the earning performance of the organization and to provide
the company with appraise for investment opportunity or potentiality. This analysis is
carried over about five years. This project deals with the financial performance analysis
in the organization. The ratio analysis, comparative analysis and trend analysis are the
tools to analyze the financial performance of the company.
The study reveals that the financial performance of the organization has been
better. But the company's profit over the last two years has been decreasing when
compared to previous years. So the management should take necessary steps to improve
their financial position
.
.
1
INTRODUCTION
2
CHAPTER-I
INTRODUCTION OF THE STUDY
Financial statement:
Financial statements contain a wealth of information, which if properly read,
analyzed or interpreted can provide valuable insights into a firm’s performance and
position. Also it is the starting point for making plan, before using any sophisticated
forecasting and planning procedure. By analyzing these statements, firm can evaluate its
past, present, projected performance etc.
Usually management would be particularly interested in knowing the financial
strength of firm to make their best use and to be able to spot out the financial weakness of
the firm to take suitable corrective action. The future plan of the firm should be laid down
in view of the firm’s financial strength and weakness. In short, through financial analysis
and interpretation it helps effectively the user for decision-making process
Meaning of financial management
Financial management is that managerial activity which is concerned with the
planning and controlling of the company’s financial resources.
In other words the financial management is basically concerned with two important
aspects:
1) Raising of the required funds at the lower cost ;
2) Making optimum use of funds so raised
The finance manager has to ensure the rational decision making efforts at the each
any every successive stages of pre – investment and post investment. In the absence of
proper appraisal system and evaluation of managerial abilities, there will be misallocation
morality and lopsided growth in undesired way leading to holocaust of economic wealth
3
Financial statement
A financial statement is an organized collection of data according to logical and
consistent accounting procedures. Its purpose is to convey an understanding of some
financial aspects of a business firm. It may show a position at a moment of time as in the
case of a balance sheet, or may reveal a series of activities over a given period of time, as
in the case of an income statement.
Thus, the term financial statement generally refers to the basis statements;
i) The income statement
ii) The balance sheet
iii) A statement of retained earnings
iv) A statement of charge in financial position in addition to the above two
statement.
Financial statement analysis:
It is the process of identifying the financial strength and weakness of a firm from
the available accounting data and financial statement. The analysis is done by properly
establishing the relationship between the items of balance sheet and profit and loss
account the first task of financial analyst is to determine the information relevant to the
decision under consideration from the total information contained in the financial
statement. The second step is to arrange information in a way to highlight significant
relationship. The final step is interpretation and drawing of inferences and conclusion.
Thus financial analysis is the process of selection relating and evaluation of the
accounting data/information.
Traditional approach to financial statement
The theory of finance, both on the corporate and on the individual investor level also
largely ignores financial statement analysis and interpretation. For example, the extensive
portfolio theory literature is practically devoid of studies integrating financial statement
information with the input requirements of the portfolio model. One of the major
contributors to portfolio theory, the financial analyst, Sharpe provides in this book that
none of which deals with financial statement analysis. It is also interesting to note that
regarding collection on theory on finance usually do not include studies  related to
4
financial statement analysis. financial statement analysis remains in the initial state of
development of the science of financial management
New Approach to Financial statement Analysis
Recent research on the area signifies the beginning of a new approach which is
mainly characterized by the emphasis on development of financial analysis techniques
within the context of formal decision models. L. Financial statement is thus viewed as
information – processing system designed to provide Data for Decision making models,
such as the portfolio selection model. Bank lending decision models and corporate
financial management models. The purpose of financial statement analysis is to provide
the data required by the model (e.g., predictions of future returns) in the most efficient
(less costly) way.
Importance of Financial Analysis and Interpretation
Financial statements contain a wealth of information, which if properly read, analyzed or
interpreted can provide valuable insights into a firm’s performance and position. Also it
is the starting point for making plan, before using any sophisticated forecasting and
planning procedure. By analyzing these statements, firm can evaluate its past, present,
projected performance etc.
Usually management would be particularly interested in knowing the financial strength
of firm to make their best use and to be able to spot out the financial weakness of the firm
to take suitable corrective action. The future plan of the firm should be laid down in view
of the firm’s financial strength and weakness. In short, through financial analysis and
interpretation it helps effectively the user for decision-making process
This studying contain following analysis:
1) comparative analysis statement
2) common-size analysis statement
3) Ratio analysis
4) Trend analysis.
5
INDUSTRY
PROFILE
6
1.1 INDUSTRY PROFILE
Footwear is estimated to have started its long history of human use during the
“ICE AGE”, some five million years ago un kind weather conditions are said to have
created necessity for footwear. Other evidence shows that footwear came to use at the end
of the Paleolithic period at about the same time the early human learned the art of leather
training.
Early pieces of footwear were made of wrapping usually made of leather or dried
grasses later on the pieces were developed from an oval piece of leather, which is bound
by a piece of strong leather thongs, sandals which are the first crafted footwear, are the
success of this wrappings.
In Egyptian funeral champers, paintings show the different stages in the
preparation of leather and footwear. The images also show that in Egypt, footwear
depicted power and close the characteristics which are missing in commoner’s footwear.
Egyptian sandals were crafted using straw, papyrus or palm fiber. Later on Egyptian
women adorned their footwear with precious and jewels.
Material evidences shows that Greeks loved and took good care of their feet by
using different footwear for different activities. Greek women wearing sandals to signify
their social classes. Their footwear signified beauty, elegance, refinement and extra
vagance. Some Greek women used to wear elevated sandals, which created a clacking
sound when the wearer moves.
In Mesopotamia leather wrappings are tied to the feet by a strip of the same
material. Romans on the other hand created other durable leather thongs so their legions
can travel to place on foot. It also believed that foot fetishes began with the Romans.
In Roma, footwear also exhibition social class. The consults were white shoes, the
senators were brown shoes, and the uniform footwear for rest of the regions was a short
pair of books that uncovered the shoes.
But in all those early civilizations, footwear indicated social status. Footwear
consists of garments that are worn over the feet. They are worn mainly for protection and
hygienic, but also for fashion and adornment. Footwear items come from a wide range of
7
materials including leather, rubber canvas, wood and plastic. But early pieces are made
from available materials like straw, leather, crow hide and grasses. When footwear is
assembled, the main components are adhesive, cushion, counter fort heel, insole, laces,
sole, steel, shank, tack, teo puff, tread and welt. Generally footwear is classified in to
books, industrial footwear, shoes and sandals.
Boots are available as cowboy books, galoshes, ski boots, thigh, and length boots
and so on. Industrial footwear includes plastic and rubber loafers, which are used in
laboratories, construction sites and production lines.
Shoes include athletic shoes (or running shoes), climbing shoes, clogs, high heels, marry
janes, moccasins, maker loafers, tap shoes and cross training shoes, sandals on the other
hand includes espadrilles, flip fops thongs, slide one and slippers.
Footwear is considered as an extension of ones personality well maintained
footwear size things about the owner with cleanliness as the most important concern.
INDIAN FOOTWEAR INDUSTRY
India is engrossed with different civilizations, cultures, religious customers and
conversions, climate and socio economic conditions. The esteem conditions one tracks
may be the prime causes for footwear wearing habits.
All over the country, different types of traditional footwear are being produced to
meet the consumer’s preference.
In Maharashtra, ordinary chapels with leather soles and uppers or chapels made
out of leather uppers with leather source called as ‘kothapuri’, ‘gadag’, and
‘karundavadi’. In Gujarat and Rajasthan ‘leather juti’ and ‘Gujarat nagara’, in Orissa,
“kataki chapels”, and in Punjab “plain Panjabi juti” are popular traditional names.
In Punjab, the demand for traditional footwear called as “saadi” and “kisan juti” and the
ladies variety known as janana juti is quite popular. The plain juti type of artistic
footwear made out of tanned leather has great demand in urban and rural areas.
The second popular pattern of footwear in Punjab and Rajasthan is “khasida juti
or embroided upper juti” both the states are well known for this variety artistic footwear.
It is observe that though this pattern is attractive, the comfort is lacking because there is
difference in the contraction of the right or left of the footwear. However those who are
8
habituated to wear the local type from childhood do not express any difficulty since they
do not use any other type of footwear.
In Kerala, Tamilnadu and other parts of the country, customer’s preference for footwear
is mostly determined by fashion, conformability etc..rather than tradition.
INDIAN LEATHER INDUSTRY
The Indian leather industry occupies a place of prominence in the country’s
economy in view of its massive potential for employment, growth and exports. Thus has
been increasing emphasis on its planned development, aimed at optimum utilization of
available raw material for maximize returns especially from exports.
India is the largest livestock holding country 21 percentages, large animals and 11
percent small animals.
• Annual production value over as 4 billion.
• Annual export value over as 2 billion.
• Export growth (AGR) 8.20 percent (2000-2004).
• About 2.50 million workforces (30% women).
• Promising technology inflow and foreign direct investment.
• Top priority to occupied safety and work environment.
• Material concern for consumer safety.
PRODUCTS EXPORTED
• Leather footwear
• Footwear component (shoes, uppers, soler etc.)
• Leather garments
• Leather goods
• Finished leather
9
MAJOR ITEMS OF INDIAN FOOTWEAR
• Hides
• Skins
• Leather footwear
• Leather shoe uppers
• Non leather footwear
• Leather garments
• Leather goods
• Industrial gloves
• Saddler
Indian footwear industry – A critical analysis
In India, the footwear production was in the hands of individual or small scale
sector. In olden day’s rural areas the footwear made was exchange under barter system.
The urbanization, mechanization and change in life style have demanded for mass
production resulted in whole sale and retail sales.
The footwear industry is a significant segment of the leather industry in India.
India ranks second among the footwear producing countries next to China. The industry
is a labour intensive and is concentrated in large scale units, the sandals and uppers
produced in the household and cottage sector.
India produces more of gent’s footwear while the world’s major production is
being ladies footwear. In the case of chapels and sandals, use of non leather material is
prevalent in the domestic market. The major production centers in India are Chennai,
Rainpet, Ambar in Tamilnadu, Mumbai, Kanpur in UP, Jalander in Punjab and Agra. The
following table indicating concentration of units in various parts of the country
10
Region Large & Medium
scale industry
Small-scale industry House hold
Tamilnadu 64 31 7
Delhi up north 4 8 2
Agra, Kanpur 9 34 14
Calcutta 1 3 19
Bangalore 6 3 4
Mumbai 3 11 0
Others 13 10 3
The estimated annual footwear production capacity 1736 million pairs (776
million pairs of leather footwear and 960 million pairs of non leather footwear).
Region using share of total estimated capacities are as follows
Region Leather
shoes
Non leather
shoes
Leather
shoe upper
Leather
sandals
Non
leather
sandals
Tamilnadu 26 5 54 1 0
Delhi and
up north
10 77 4 1 60
Agra,
Kanpur
45 0 32 62 0
Calcutta 12 0 2 3 0
Bangalore 3 3 4 0 0
Others 0 13 3 1 40
Total 100 100 100 100 100
IMPORT
The global import of footwear (leather and non leather) in terms of value was
around US dolor 43278 billion, accounting a share 63.42 % in the total import of leather
product out of this, import of leather footwear alone accounted for US dolor 26379
million and non leather footwear US dolor 16899 million.
11
EXPORT
India’s export of leather footwear touched US $ 33/million, recording an increase
of 3.29 percent over the preceding year. India thus holds a share of 1.25 percent in the
global import of leather footwear. The major markets for India leather footwear one the
UK, USA, Germany, Italy, France, Middle east and Russia nearly 71 % of India’s exports
of leather footwear is to Germany, UK and Italy. The India’s footwear industry is
provided with institutional infrastructural support through premier institutions like central
leather research institute, Chennai footwear design and development institute, Nodia
national institute of fashion technology New Delhi etc..in the areas of technological
development, design and product development and human resource development.
Now a days wearing footwear is a necessity rather than a fashion for the human
beings. Hence the demand for footwear is also increasing day by day. The different
classes of people using different types of quality of footwear’s depending on their
purchasing power. The middle and lower income groups prefer low cost durable, wear
and tear resistant footwear that can be used in all domestic condition where as the high
income groups prefer the latest type of footwear which are highly costlier. The first
preference of the middle and lower income groups is the poly viny 1 (horide PVC
footwear) which will satisfy all their conditions with regard to the footwear’s.
Popularity of PVC chapels is increasing among the people and it will lead to the demand
for their chapels. As a result almost all footwear companies are trying to shift their
chapels from rubber to the PVC chapels
PVC CHAPPALS
Development in polymer technology coursed the invention of multi purpose raw
material, PVC is a very friendly material and we can convert it in to appropriate form and
size with suitable could comparing to their chemicals, their product has no harmfulness in
human body. At the same time, it is very attractive and becomes an essential product in
human life.
12
The leading of PVC chapels manufacture from North India especially Delhi, UP,
West Bengal, Bihar etc. in Kerala repressed PVC chapels are products in many part of the
state. Bata’s ,sandals and Actions micro all the alternatives in Kerala market.
The PVC footwear will provide longer life, low cost; wearing comfort and durability to
the footwear can be used in all seasons especially in rainy season. By considering all this,
one of the leading footwear company in Kerala, CV footwear manufactures PVC
footwear from virgin materials which after better style, comfort, colors, durability etc.
HILLWOOD GROUP of companies is a partnership firm which is constituted by
Mr.V.Shareef the chairman of the company at Chungam, Feroke. The manufacturing unit
is constituted by him with an investment of Rs.1, 80,000000. The company is concerned
with producing sofitel and soft pu footwear’s and in timber manufacturing, building
works and building materials. The unit is started with producing both Sofitel and Soft Pu
in 2005 itself. It is highly demanded by market.
13
COMPANY PROFILE
14
1.2 COMPANY PROFILE
HILLWOOD group of companies is today a leading business entity in south India. This
group has been in the forefront of timber trading and manufacturing business for almost
30 years. The foresighted vision of its promoters and their commitment to quality and
customer satisfaction has been earned the group a reputation among its customers and
clients.
This company has branches in Pollachi and Selam at Tamilnadu which is managed by
Mr.Shareef. The HILLWOOD group of companies is one of the leading companies in
footwear manufacturing in the state of Kerala.
The rich legacy of the group is successfully carry forward by their third generation and
today the group has diversified interest in real estate, transportation and global trade.
HILLWOOD, the pioneering wood exporting company in Kerala located in Feroke near
Calicut. This business is exclusively exporting and importing wood. They have been
trusted world over by their valuable customers. Their commitment to quality and timely
delivery propelled their growth. This company is well experienced in timber logs and
distribution focused on dependable service and on filling the special needs of their
overseas customers.
They also cater to the requirements of customers in India too. Wood supplied by
HILLWOOD is widely used in India, abroad for quality furniture, interior decoration and
other constructions and is much sought after across the globe.
OTHER COMPANIES UNDER THE HILLWOOD GROUP OF COMPANIES
 HILLWOOD IMPORT AND EXPORT PVT.LTD.
 HILLWOOD FURNITURE PVT.LTD.
 CONCORD POLYMERS
 SAS POLYMERS
15
 HILLWOOD BUILDING MATRIALS
 HILLWOOD COLLANADE
DIVISIONS OF HILLWOOD GROUP OF COMPANIES
FOOTWEAR DIVISION
CEE VEE FOOTWEAR
It is the largest manufacturers and exporters of quality fashionable footwear for
men, women and kids especially in southern region of India. They have an extensive
network of reputed suppliers, who provide them with the finest quality of inputs and
material. They are always open to developing new range of footwear as required by their
customers, according to latest fashion trends and styles. They focus on quality and aim to
achieve total customer satisfaction. They use very advanced modern technologies for the
production process.
Their footwear is specially manufactured to face different climates and is
available in different styles types and sizes. In addition the attractive and affordable
prices of the footwear have made them a huge hit among the admirers of quality
footwear.
TIMBER DIVISION
HILLWOOD imports and exports, the pioneering wood exporting company in
Kerala, located in Feroke, Calicut. HILLWOOD is exclusively exporting and importing
wood. They are well experienced in timber logs and distribution focused on dependable
service and filling the special needs of their valuable customers.
Wood supplied by HILLWOOD is widely used in India and abroad for quality
furniture, interior decoration and other constructions.
HILLWOOD furniture is a company that continuous to lead the industry in
today’s home and office furnishings. They set new trends in life style with quality
benchmark products, redefining the wood piece of furniture to a life style product which
dictates pride of processing it.
BUILDERS DIVISION
16
HILLWOOD builders are one of the renowned names in the construction
segment. Their buildings are testimony for the quality and timely completion of projects
has enabled the HILLWOOD to become one of the sought after companies for all
construction requirements. HILLWOOD is backed by an in-house team of architects and
engineers, a dictated and thoroughly committed workforce. HILLWOOD builders follow
the best practices in the industry like producing quality raw materials, conformance to
international standards and a commitment to schedules.
Carefully chosen locations, their buildings are aesthetically appealing,
functionally efficient and decidedly up market. Comfortable abodes, countryside
aesthetics contemporary amenities. It offers a classic lifestyle to its customers.
BUILDING MATERIALS
HILLWOOD building materials is a one stop solution for all our building
construction needs. They help the customers to find the finest brand, trendy designs,
latest news and events in the construction industry.
Construction materials need to be well selected as it is an asset for a lifetime.
HILLWOOD provides all the sufficient details regarding the constructions in
HILLWOOD. Each of the building construction material includes as a separate category
as it makes easy to navigate through the essential construction material. HILLWOOD
group of companies furnishes the details of wooden tiles, window frames, door frames
and interior decorative woods.
PROFILE OF CEE VEE
The CEE VEE footwear has constituted a manufacturing unit by name SOFITEL
footwear’s proposed to be set up at Chungam, Feroke. Footwear manufacturing industries
is one of the flourishing industries in India. The demand for quality footwear is increasing
day by day. It is proposed to manufacture out of virgin PVC materials by using latest
technology. There are very similar units in south India. The market demand for such
quality footwear’s are met out of supply from manufacturing unit in Delhi. Therefore
there is an excellent scope for such units in Kerala. The promoters of the project
HILLWOOD group is headed by V. Shareef has already successfully established similar
units in Feroke by name “CEE VEE FOOTWEAR PVT.LTD”. The great success of this
project and inability to supply products as per market demand promoted by the promoters
to set up a similar new unit and adjacent to existing company.
17
LOCATION
The unit is located at land adjacent to National Highway, Chungam, and Feroke.
The land is owned by managing partner V.Shareef and his given to the firm on else. The
location is deal all infrastructural facilities like road, water, electricity, labour force
etc.are available. Since the unit is located adjacent to M/S CEE VEE footwear pvt.ltd.
This is similar to the proposed unit, promoters more operational, convenience and
economy.
CONSTITUTION
The unit SOEITEL footwear’s is constituted as a partnership firm with V.Shareef
as a managing partner and C.P. Najbudheen and C.P Suhara as co partners. They are the
promoters of CEE VEE footwear pvt.ltd as well as HILLWOOD group of companies.
INVESTMENT REQUIREMENTS
The working capital requirements works out 75,00,000 with building, plant and
machinery and other equipments including mould works 120 lakhs.
18
ORGANIZATIONAL CHART
Board of directors
Managing director Executive director
Personnel
Production Finance
Marketing
Sales promotion Advertisement
Office assisstantsSupervisor
Channel of distribution Market
research
Un skilled laborsSemi skilled laborsSkilled labors
Accountants
Chairman
19
OBJECTIVES OF THE
20
STUDY
1.3 OBJECTIVES OF THE STUDY
 The basic objective of studying the ratios of the company is to know the financial
position of the company.
 To know the borrowings of the company as well as the liquidity position of the
company.
 To study the current assets and current liabilities so as to know whether the
shareholders could invest in Foot wears Ltd or not.
 To study the profits of the business and net sales of the business and to know
the stock reserve for sales of the business.
 To know the solvency of the business and the capacity to give interest to the
long term loan lenders (debenture holders) and dividend to the share holders.
 To study the balance of cash and credit in the organization
21
22
SCOPE AND LIMITATIONS OF THE
STUDY
SCOPE OF THE STUDY
The scope of the study involves the financial analysis of APCO SUZUKI Pvt ltd,
with the help of ratio analysis for 5 years. The study was extended to finance department
in particular and for the study confiner to APCO SUZUKI Pvt ltd the . The study also
includes Trend analysis
1.5 LIMITATIONS OF THE STUDY
 The analysis was made with the help of the secondary data collected from the
company.
 All the limitations of ratio analysis, common-size statement, comparative statements,
and trend analysis and interpret are applicable to this study.
 The period study is only 5 years from 2005-06 to 2009-10
23
24
REVIEW OF LITERATURE
1.6 REVIEW OF LITERATURE
a) Environmental and Financial Performance Literature
"We review the growing literature relating corporate environmental
performance to financial performance. We seek to identify achievements and limitations
of this literature and to highlight areas for further research. Our primary interest is to
assess the adequacy of the literature in informing corporate managers how, when, and
where to make pro-environment investments that will pay off with financial returns for
long-term shareholders. To do so, we create a conceptual framework that maps the
influence of regulators, public health scientists, environmental advocates, consumers,
employees, and other interested parties upon corporate financial returns. Our discussion
has relevance to all parties interested in influencing corporate actions that affect the
environment."
By Donald P. Cram, on March 27, 2000
Source: http://web.mit.edu/doncram/www/environmental/envir-fin-literature.html
b) An Investigation of the Perceived Financial Performance
"This paper is primarily based on Rogers’ diffusion of innovations theory and
Auger’s empirical study. An empirical research study was conducted to investigate the
perceived financial performance of commercial printing firms for conducting business-to-
customer (B2C) activities using Web technology. Financial performance was measured
using four financial indicators: sales, profits, costs, and return-on-investment (ROI). The
diffusion of innovations theory states that an innovation brings changes to a company.
25
Web technology is an innovation that affects company’s performance. This paper
investigates the effect of Web technology on commercial printing firms’ financial
performance."
Journal of Industrial Technology • Volume 19, Number 2 • February 2003 to
April 2003 Page2, by Dr. Devang P. Mehta
Source: http://72.14.235.132/search?q=cache:EIGjtsUJQeEJ:www.nait.org/jit/Art
icles/mehta011603.pdf+review+of+literature+on+financial+performance&hl=en&ct
=clnk&cd=2
c) Strategic and Financial Performance Implications of Global Sourcing
Strategy: A Contingency Analysis
"Using a contingency model of global sourcing strategy, this study investigated
the moderating effects of sourcing-related factors on the relationship between sourcing
strategy and a product's strategic and financial performance. The results lent some
support to the contingency model of global sourcing strategy in that product innovation,
process innovation and asset specificity were significant moderator variables for
financial, but not strategic, performance. However, the results provided no support for
bargaining power of suppliers and transaction frequency as moderator variables. In other
words, in achieving high financial performance for a product, whether a particular
sourcing strategy should be used for a particular product depended on the levels of
product innovation, process innovation and asset specificity."
Journal of International Business Studies (1995), Vol 26, Page 181–202, By
Janet Y. Murray, Masaaki Kotabe & Albert R. Wildt
Source:http://www.palgrave-journals.com/jibs/journal/v26/n1/abs/8490171a.htm
d). Implications for financial performance and corporate social
responsibility
"We investigate whether CEO implicit motives predict corporate social
performance and financial performance. Using longitudinal data on 258 CEOs from 118
firms, and controlling for country and industry effects, we found that motives significant
predicted both financial performance (Tobin's Q and the CAPM) and social
responsibility. In general, need for power and responsibility disposition were positively
predictive whereas need for achievement and affiliation were negatively predictive of
26
outcomes. Contrary to previous theorizing, corporate social responsibility had no link to
financial performance. Our findings suggest that executive characteristics have important
consequences for the top level outcomes.
Implications for financial performance and corporate social
responsibility, by Philippe Jacquart, Catherine Ramus & John Antonakis, on
May 23, 2004.
Source: http://www1.icp2008.org/guest/AbstractView?ABSID=10821
e) Financial statement analysis: A data envelopment analysis approach
"Ratio analysis is a commonly used analytical tool for verifying the performance
of a firm. While ratios are easy to compute, which in part explains their wide appeal, their
interpretation is problematic, especially when two or more ratios provide conflicting
signals. Indeed, ratio analysis is often criticized on the grounds of subjectivity, that is the
analyst must pick and choose ratios in order to assess the overall performance of a firm.
In this paper we demonstrate that Data Envelopment Analysis (DEA) can
augment the traditional ratio analysis. DEA can provide a consistent and reliable measure
of managerial or operational efficiency of a firm. We test the null hypothesis that there is
no relationship between DEA and traditional accounting ratios as measures of
performance of a firm. Our results reject the null hypothesis indicating that DEA can
provide information to analysts that is additional to that provided by traditional ratio
analysis. We also apply DEA to the oil and gas industry to demonstrate how financial
analysts can employ DEA as a complement to ratio analysis
Journal of the Operational Research Society (2003) Vol-54,Pages 48–58,
By E H Feroz
Source:http://www.palgrave-journals.com/jors/journal/v54/n1/abs/2601475a.html
27
28
RESEARCH METHODOLOGY
CHAPTER-II
RESEARCH METHODOLOGY
2.1 Research
Research can be defined as the search for knowledge or any systematic
investigation to establish facts. The primary purpose for applied research (as opposed to
basic research) is discovering, interpreting, and the development of methods and systems
29
for the advancement of human knowledge on a wide variety of scientific matters of our
world and the universe.
According to Clifford woody research comprises defining and redefining
problems, formulating hypothesis or suggested solutions; collecting, organising and
evaluating data; making deductions and reaching conclusions; and at the last carefully
testing the conclusions to determine whether they fit the formulating hypothesis.
2.2 Research Methodology
Research is a diligent and systematic inquiry or investigation into a subject in order
to discover or revise facts, theories, applications, etc... Methodology is the system of
methods followed by a particular discipline. Thus Research methodology is the way how
we conduct our research.
2.3 Research problem
The research problem in this study is to analyse the financial performance of the
organization..
2.4 Research design:
The descriptive form of research method is adopted for study.
The major purpose of descriptive research is description of state of affairs of
the institution as it exists at present. The nature and characteristics of the financial
statements of CEE VEE PVT LTD have been described in this study.
2.5 Nature of data:
The data required for the study has been collected from secondary source .The
relevant information were taken from annual reports, journals and internet.
2.6 Methods of data collection
30
This study is based on the annual report of CEE VEE Foot wears pvt Ltd. Hence
the information related to, profitability, short term and long term solvency and turnover
were very much required for attaining the objectives of the present study.
In order to fulfill the objectives of the study the data has been collected from both-
• Primary Data
• Secondary Data
a) Primary Data
To generate primary data for the analysis, direct personal interview and discussion
was made with company assistant manager of finance, accountants and other officials.
The data collected from the interview are coordinated and analyzed in an integrated
fashion throughout the dissertation.
b) Secondary Data
For gathering secondary data various other source were used, they are-
• Different accounting records of the company.
• Magazines and journals
• Internets and other publication
2.7 Tools applied:
To have a meaningful analysis and interpretation of various data collected, the
following tools were made for this study.
 Ratio analysis
 Common-size statement
 Comparative statement
 Trend analysis
31
DATA ANALYSIS AND
INTERPRETATION
3.1 RATIO ANALYSIS:
32
Ratio analysis is a widely used tool of financial analysis. The term ratio in it
refers to the relationship expressed in mathematical terms between two individual figures
or group of figures connected with each other in some logical manner and are selected
from financial statements of the concern. The ratio analysis is based on the fact that a
single accounting figure by it self may not communicate any meaningful information but
when expressed as a relative to some other figure, it may definitely provide some
significant information the relationship between two or more accounting figure/groups is
called a financial ratio helps to express the relationship between two accounting figures in
such a way that users can draw conclusions about the performance, strengths and
weakness of a firm.
Classification of ratios:
A) Liquidity ratios
B) Leverage ratios
C) Activity ratios
D) Profitability rati0
3.1) Liquidity ratios
33
These ratios portray the capacity of the business unit to meet its short term
obligation from its short-term resources (e.g.) current ratio, quick ratio.
3.1.1) Current ratio:
Current ratio may be defined as the relation ship between current assets and
current liabilities it is the most common ratio for measuring liquidity. It is calculated by
dividing current assets and current liabilities. Current assets are those, the amount of
which can be realized with in a period of one year. Current liabilities are those amounts
which are payable with in a period of one year.
Current assets
Current assets = -------------------------
Current liabilities
TABLE -3.1.1
CURRENT RATIO
Interpretation
Year Current asset(Rs) Current
liabilities(Rs)
Ratio
2005-2006 13,879,890.78 5,925,850 2.35
2006-2007 26,277,693 11,344,762.12 2.31
2007-2008 33,638,118.16 19,172,404.12 1.75
2008-2009 31,883,563.24 25,862,450.68 1.42
2009-2010 32,188,509.64 22,699,554.60 1.23
34
The above table shows that the current ratio in the year 2005-06 was 2.35 and
then it decreases to 2.16 in the year 2006-07, further move downwards to 1.75 and in the
year 2007-08 it slashed down to 1.42 and finally in the year 2007-08 it again decreases to
1.23. The normal current ratio is 2:1. The above table shows current ratio is more than
2% in all the first two years. But in the last three years the current ratio is lower than the
normal. This shows that the company is not enjoying credit worthiness.
CHART-3.1.1
CURRENT RATIO
0
0.5
1
1.5
2
2.5
2005-06 2006-07 2007-08 2008-09 2009-10
Current ratio
3.1.2) LIQUID RATIO:
35
The term ‘liquidity’ refers to the ability of a firm to pay its short-term
obligation as and when they become due. The term quick assets or liquid assets refers
current assets which can be converted into cash immediately it comprises all current
assets except stock and prepaid expenses it is determined by dividing quick assets by
quick liabilities.
Liquid assets
Liquid ratio = -------------------------
Liquid liabilities
TABLE-3.1.2
LIQUID RATIO:
Year Liquid assets(Rs) Liquid liabilities(Rs) Ratio
2005-2006 11,586,553.78 5,925,850 1.96
2006-2007 24,243159.78 11,344,762.12 2.13
2007-2008 30,560,618.16 19,172,404.12 1.6
2008-2009 30,046,138.24 25,862,450.68 1.16
2009-2010 29,431,698.64 22,699,554.60 1.3
36
Interpretation :
The above table and shows the liquid ratio during the study period except.
In all the year the ratio is more than the normal (i.e.) 1:1.It was 1.96 in the year 2005-06
and reached the highest in 2006-07 to 2.13 and then came down to 1.13 in the year 2008-
09.Hence the firm is controlling its stock position because there linear relationship
between current ratio and liquid ratio
CHART-3.1.2
LIQUID RATIO:
0
0.5
1
1.5
2
2.5
2005-06 2006-07 2007-08 2008-09 2009-10
Liquid Ratio
.
37
3.1.3) ABSOLUTE LIQUIDITY RATIO:
Absolute liquid assets include cash, bank, and marketable securities. This ratio
obtained by dividing cash and bank and marketable securities by current liabilities.
Cash + bank +marketable securities
Absolute liquidity ratio = ----------------------------------------------
Current liabilities
TABLE-3.1.3
ABSOLUTE LIQUID RATIO:
Interpretation:
Year Cash and securities(Rs) Current liabilities(Rs0 Ratio
2005-2006 88,887.75 5,925,850 0.02
2006-2007 2,26,895 11,344,762.12 0.02
2007-2008 5,75,172 19,172,404.12 0.03
2008-2019 5,17,249 25,862,450.68 0.02
2009-2010 1,134,977.7 22,699,554.64 0.05
38
The above table shows the absolute ratio for the study period 2005-06 to 2009-10. There
is fluctuation in the absolute ratio. It was 0.02 in the year 2005-06&2006-07 In 2007-08
and it was 0.03 and it reaches .05 in the year 2009-10
CHART-3.1.3
ABSOLUTE LIQUID RATIO:
0
0.005
0.01
0.015
0.02
0.025
0.03
0.035
0.04
0.045
0.05
2005-06 2006-07 2007-08 2008-09 2009-10
Absolute Ratio
3.2 LEVERAGE RATIOS
39
Many financial analyses are interested in the relative use of debt and equity in
the firm. The term ‘solvency’ refers to the ability of a concern to meet its long-term
obligation. Accordingly, long-term solvency ratios indicate a firm’s ability to meet the
fixed interest and costs and repayment schedules associated with its long-term
borrowings. (E.g.) debt equity ratio, proprietary ratio, etc….
3.2.1 DEBT EQUITY RATIO:
It expresses the relationship between the external equities and internal equities
or the relationship between borrowed funds and ‘owners’ capital. It is a popular measure
of the long-term financial solvency of a firm. This relationship is shown by the debt
equity ratio. This ratio indicates the relative proportion of dept and equity in financing the
assets of a firm. This ratio is computed by dividing the total debt of the firm by its equity
(i.e.) net worth.
Outsider’s funds
Debt equity ratio = ------------------------------
Proprietor’s funds
TABLE-3.2.1
DEBT EQUITY RATIO:
Interpretation and Analysis:
Year Outsider’s
funds(Rs)
Proprietor’s
funds(Rs)
Ratio
2005-2006 13950857 4958937.66 2.8
2006-2007 19996093 5674125.6 3.52
2007-2008 17253752.1 8814690,76 1.95
2008-2009 11956999.29 6847858.28 1.74
2009-2010 14851203.7 6218534.14 2.38
40
The above table shows the debt equity relationship of the company during the
study period. It was 2.38 in the 2005-06and then reached its highest in the next year3.52
and from there it began to slope downwards and in the year 2009-10 it again move
upwards to 2.38 in the year 2009-10
In all the years the equity is less when compared with borrowings. Hence the
company is not maintaining its debt position
CHART-3.2.1
DEBT EQUITY RATIO:
0
0.5
1
1.5
2
2.5
3
3.5
4
2005-
06
2006-
07
2007-
08
2008-
09
2009-
10
Debt Equity Ratio
.
3.2.2 PROPRIETARY RATIO:
41
Proprietary ratio relates to the proprietors funds to total assets. It reveals the
owners contribution to the total value of assets. This ratio shows the long-time solvency
of the business it is calculated by dividing proprietor’s funds by the total tangible assets.
Proprietor’s funds
Proprietary ratio = ---------------------------
Total tangible assets
TABLE-3.2.2
PROPRIETARY RATIO
Interpretation:
Year Proprietor’s funds(Rs) Total assets(Rs) Ratio
2005-2006 4,958,937.66 18,909,794.78 0.26
2006-2007 5,674,125.66 25,670,218.66 0.22
2007-2008 8,814,690.76 26,068,448.86 0.33
2008-2009 6,847,858.28 18,804,857.57 0.36
2009-2010 6,218,534.14 21,069,737.84 0.30
42
The above table shows the proprietary ratio during the study period. In all the years
the owner's contribution to the total assets was not appropriate and they maintain their share
in the company's assets.
In all the years the proprietor's contribution in to the total assets is less than 50%
CHART-3.2.2
PROPRIETARY RATIO
0
0.1
0.2
0.3
0.4
0.5
0.6
0.7
0.8
2005-
06
2006-
07
2007-
08
2008-
09
2009-
10
Proprietary Ratio
3.3 ACTIVITY RATIOS:
43
These ratios evaluate the use of the total resources of the business concern along
with the use of the components of total assets. They are intended to measure the
effectiveness of the assets management the efficiency with which the assts are used
would be reflected in the speed and rapidity with which the assets are converted into
sales. The greater the rate of turnover, the more efficient the management would be (E.g.)
stock turnover ratio, fixed assets turnover ratios etc….
3.3.1 STOCK TURNOVER RATIO:
This ratio indicates whether investment is inventory is efficiently used or not it
explains whether investment in inventories in with in proper limits or not. It also
measures the effectiveness of the firms’ sales efforts the ratio is calculated as follows.
Cost of goods sold
Stock turnover ratio = -----------------------------
Average stock
Opening Stock + Closing Stock
Average stock = -----------------------------------------
2
TABLE-3.3.1
STOCK TURNOVER RATIO:
Year Cost of goods sold(Rs) Average stock(Rs) Ratio
2005-2006 23,590,125.12 2896130 8.14
2006-2007 34,579,881 2,163,930.5 15.98
2007-2008 38,256,374 2,556,012 14.96
2008-2009 66,238,872.02 4,673,236 14.17
2009-2010 47,477,950.98 3,567,604 13.30
44
Interpretation:
The above table and diagram shows the relationship between costs of goods sold and
average stock. During the year 2006-07 it is 15.98% which shows higher position of cost
of goods sold. In the years of study it is shown above that the cost of goods sold are
almost 15-16times of the average stock. But at the same time during 2005-06 it is only
8.14 which shows that more stock was remaining in the company
CHART-3.3.1
STOCK TURNOVER RATIO:
0
2
4
6
8
10
12
14
16
2005-
06
2006-
07
2007-
08
2008-
09
2009-
10
Stock Turnover
Ratio
..
3.3.2 FIXED ASSETS TURNOVER RATIO:
45
The ratio indicates the extent to which the investments in fixed assets contribute
towards sales. If compared with a pervious year. It indicates whether the investment
infixed assets has been judicious or not the ratio is calculated as follows.
Net sales
Fixed assets turnover ratio = -------------------
Fixed assets
TABLE-3.3.2
FIXED ASSET TURNOVER RATIO:
Interpretation:
The above table shows the relationship between the fixed assets and sales. The
sale is2.81 times more than the fixed assets 2005-06 and in 2006-07 it increases into 4
Year Net sales(Rs) Fixed assets(Rs) Ratio
2005-2006 30,419,045 10,818,040 2.81
2006-2007 40,743,308 10,437,346 3.90
2007-2008 50,283,776.88 11,340,101.82 4.43
2008-2009 73,789273.14 12,005,171.01 6.14
2009-2010 53,808,158.92 10,700,453.79 5.03
46
times. It is more than 4 times during 2007-08 . It is more than 6 times during 2008-09 and
more than 5 times during the period of 2009-10. It can be observed that in the year
2008-09 the fixed assets value increased a lot and which shows that there is an additions
made to the fixed assets, similarly the sales was also increased from 50282776.88 (2008-
09) to 73789273.14 (2006-07).
CHART-3.3.2
FIXED ASSET TURNOVER RATIO:
0
1
2
3
4
5
6
7
2005-
06
2006-
07
2007-
08
20098-
09
2009-
10
Fixed Assets Turnover
Ratio
3.3.3 WORKING CAPITAL TURNOVER RATIO:
47
Working capital turnover ratio indicates the velocity of the utilization of net
working capital. This ratio indicates the number of times the working capital is turned
over in the course of a year. It is a good measure over –trading and under-trading.
Net sales
Working capital turnover ratio = ----------------------------
Net working capital
TABLE-3.3.3.
WORKING CAPITAL TURNOVER RATIO:
Interpretation:
Year Net sales(Rs) Net working capital9Rs) Ratio
2005-2006 30,419,045 7,954,040.78 3.82
2006-2007 40,743,308 14,932,931.66 2.72
2007-2008 50,283,776.88 14,465,714.04 3.48
2008-2009 73,789,273.14 6,021,112.56 12.26
2009-2010 53,808,158.92 9,488,955.04 5.68
48
The above table shows the relationship between net working capital and net sales.
During the years the sales is 2 to 12 times more than the working capital. It was 3.82 in
the year 2005-06 and as there was more working capital the ratio sloped downwards and
reached 2.72 in the year 2006-07. As the sales increased and working capital decreased
the ratio now moved up to 12.26 times and in the year 2008-09 as the sales slashed to
40% of the previous year the ratio again decreased.
CHART-3.3.3
WORKING CAPITAL TURNOVER RATIO
0
2
4
6
8
10
12
14
2005-06 2006-07 2007-08 2008-09 2009-10
WC T/o Ratio
3.3.4 TOTAL ASSETS TURNOVER RATIO:
49
This ratio is an indicator of how the resources of the organization utilized
for increasing the turnover. It shows the ratio between the total assets and the net sales of
the company. From this ratio one can understand how the assets are performing and being
utilized in achieving the objectives of the company.
Total assets
Total assets turnover ratio = -------------------
Net assets
TABLE-3.3.4
TOTAL ASSETS TURNOVER RATIO:
Interpretation:
Year Total assets(Rs) Net sales(Rs) Ratio
2005-2006 18,909,794.78 30,419,045 0.62
2006-2007 25,670,218.66 40,743,308 0.63
2007-2008 26,068,442.86 50,283,776.88 0.52
2008-2009 18,804,857.57 73,789,273.14 0.25
2009-2010 21,069,737.84 53,808,158.92 0.39
50
The above table shows the relationship between the total assets to net sales. The
relationship between sales to total assets is high. The ratio decreased from 0.62 (2005-06)
to 0.25 (2008-09) and then it was again decreasing and reached to again 0.39 in the year
2009-10. and raised to 0.81 in the year 2007-08 due to the heavy fall in the sales. Thus
the company's sales were almost directly disproportionate in the first three years of the
study and then started to perform well
CHART-3.3.4
TOTAL ASSETS TURNOVER RATIO
0
0.1
0.2
0.3
0.4
0.5
0.6
0.7
2005-06 2006-07 2007-08 2008-09 2009-10
Total assets T/o Ratio
.
3.3.5 CAPITAL TURNOVER RATIO:
51
This is a ratio which shows how much sales are entertained from the
capital. It shows how the sales are attracted from the Proprietor's Fund.
Sales
Capital turnover ratio = -----------------------
Proprietor’s fund
TABLE-3.3.5
CAPITAL TURNOVER RATIO:
Interpretation:
Year Sales Proprietor’s funds Ratio
2005-2006 30,419,045 4,958,937.66 6.13
2006-2007 40,743,308 5,674,125.66 7.18
2007-2008 50,283,775.88 8,814,690.76 5.70
2008-2009 73,789,273.14 6,847,858.28 10.8
2009-2010 53,808,158.92 6,218,534.14 8.65
52
The above table shows the relationship between the sales and proprietors
funds. In the year 2005-06 the ratio 6.13 and it was increasing and reached 7.18 in the
year 2006-07 and then it was decreased into 5.70 in 2007-08 and it again increasing and
reached its highest 10.8 in the year 2008-09. In the final year i.e. 2009-10 it was 8.65.
The sales are in between 5.7 and 10.8 times more than the proprietor's funds. It shows the
firms is maintaining the better utilization of own fund
CHART-3.3.5
CAPITAL TURNOVER RATIO
0
2
4
6
8
10
12
2005-06 2006-07 2007-08 2008-09 2009-10
2005-06
2006-07
2007-08
2008-09
2009-10
.
3.3.6 RETURN ON TOTAL ASSETS
53
Profitability can be measured in terms of relationship between net profit and
total assets. It measures the profitability of investment. The overall profitability can be
known by applying this ratio.
Net profit
Return on total assets = ----------------------------- x100
Total assets
TABLE-3.3.6
RETURN ON TOTAL ASSETS RATIO
Interpretation:
Year Net profit(Rs) Total assets(Rs) Ratio
2005-2006 2,054,342.88 18,909,794.78 1.08
2006-2007 1,674,l25.66 25,670,218.66 0.065
2007-2008 4,814,690.76 106,552,413 0.184
2008-2009 2,347,858.28 98,670,106 0.124
2009-2010 1,718,534.14 91,660,973 .0815
54
The above table shows the relationship between net profit and total assets
in percentage. The company earns a good return in the year 2005-06 i.e1.08 and i9 it was
decreasing into 0.065 in the year 2006-07.In the year 2008-09 it again increases into
0.184 and in the final year it was 0.085. Hence there is a fluctuation their return on asset.
CHART-3.3.6
RETURN ON TOTAL ASSETS RATIO
0
0.2
0.4
0.6
0.8
1
1.2
2005-
06
2006-
07
2007-
08
2008-
09
2009-
10
Return on TA
Ratio
3.4 PROFITABILITY RATIOS
55
The profitability ratios of a business concern can be measured by the profitability
ratios. These ratios highlight the end result of business activities by which alone the over
all efficiency of a business unit can be judged, (E.g.) gross ratios, Net profit ratio.
3.4.1 GROSS PROFIT RATIO:
This ratio expresses the relationship between Gross profit and sales. It indicated
the efficiency of production or trading operation. A high gross profit ratio is a good
management as it implies that cost of production is relatively low.
Gross profit
Gross profit ratio = ----------------------------------- x 100
Net sales
TABLE-3.4.1
GROSS PROFIT RATIO:
Interpretation:
Year Gross profit(Rs) Net sales(Rs) Ratio
2005-2006 3,011,231.02 30,419,045 9.89
2006-2007 2,983,846 40,743,308 7.32
2007-2008 3,931,358 50,283,776.88 7.81
2008-2009 2,003,806 73,789,273.14 2.70
2009-2010 4,333,251 53,808,158.92 8.05
56
The above table and shows the relationship between the gross profit and net sales
in percentage. During 2005-06 the gross profit position was 9.89% and in the very next
year it slashed down to 7.32% and again slightly raised to 7.81% and since then it was
decreasing and reached the lowest to 6.70% in the year 2008-09 and it was again
increasing and finally reached 8.05 However it can be noticed that the sales also reduced
to about 60% in 2008-09 when compared to other years
CHART-3.4.1
GROSS PROFIT RATIO:
0
2
4
6
8
10
12
14
2005-
06
2006-
07
2007-
08
2008-
09
2009-
10
Gross Profit Ratio
3.4.2 NET PROFIT RATIO:
57
Net profit ratio establishes a relationship between net profit (after taxes) and sales.
It is determined by dividing the net income after tax to the net sales for the period and
measures the profit per rupee of sales.
Net profit
Net profit sales = ----------------- x 100
Net sales
TABLE-3.4.2
NET PROFIT RATIO:
Year Net profit(Rs) Net sales(Rs) Ratio
2005-2006 2,054,342.88 30,419,045 6.75
2006-2007 1,674,125.66 40,743,308 4.10
2007-2008 4,814,690.76 50,283,776.88 9.57
2008-2009 2,347,858.28 73,789,273.14 3.18
2009-2010 1,718,534.14 53,808,158.92 3.19
58
Interpretation:
The above table shows the relationship between the gross profit and net sales in
percentage. During 2005-06 the gross profit position was 9.89% and in the very next year
it slashed down to 7.32% and again slightly raised to 7.81% and since then it was
decreasing and reached the lowest to 6.70% in the year 2008-09 and it was again
increasing and finally reached 8.05 However it can be noticed that the sales also reduced
to about 60% in 2008-09 when compared to other years.
CHART-3.4.2
NET PROFIT RATIO:
0
2
4
6
8
10
12
14
2005-06 2006-07 2007-08 2008-09 2009-10
3.4.3 EXPENSES RATIO:
59
This ratio establishes the relationship between various indirect expenses to net
sales.
A) ADMINISTRATIVE EXPENSES RATIO:
Administrative expenses
Administrative expenses ratio = ------------------------------- x 100
Sales
b) SELLING &DISTRIBUTION EXPENSES RATIO:
Selling &distribution expenses
Selling &distribution expenses ratio = ----------------------------------------- x 100
Sales
TABLE-3.4.3
EXPENSES RATIO:
Administration expenses + selling expenses
Expenses ratio = _______________________________________ x 100
Sales
Interpretation:
Year Administration&
Selling
expenses(Rs)
Sales(Rs) Ratio
2005-2006 1,162,910 30,419,045 3.82
2006-2007 2,178,901 40,743,308 5.34
2007-2008 2,295,306.8 50,283,776.88 4.56
2008-2009 2,275,581.2 73,789,273.14 3.08
2009-2010 3,553,033.39 53,808,158.92 6.60
60
The above table shows the relationship between the administration and selling expenses
and sales. The administration and selling expenses during 2009-10 is very high when
compared to previous year's %age as they were in between 3-7% of sales. .
CHART-3.4.3
EXPENSE RATIO
0
1
2
3
4
5
6
7
2005-
06
2006-
07
2007-
08
2008-
09
2009-
10
Expense Ratio
3.5) Common size income statements
61
TABLE-3.5.1
Common size income statement (2005-06 &2006-07)
Inference:
The common size income statement for the year 2005 to 2006 reveals the
following. The sales figure increasing year after year. It increased about Rs.40,324,263.
Administrative and other expenses were also increasing. The other income of the company
was increased year by year.
TABLE-3.5.2
Common size income statement (2006-07 & 2007-08)
Particulars 2005-2006 (Rs) % 2006-200(Rs) %
Income:
Sales 30,419,045 92.93 40,743,308 95.06
Other income 17,626 0.053 83,067 0.19
Closing stock 2,293,337 7.006 2,034,524 4.75
Total income 32,730,008 100 42,860,899 100
Expenditure:
Opening stock 3,498,923 11.3 2,293,337 5.93
Purchases 21,045,864 67.97 26,507,305 68.64
Direct expenses 2,446,415 5.05 5,367,094 11.15
Administration
expenses
1,238,368 1.15 2,785,170 1.71
Selling Expenses 8,07,055 2.60 2,575,833 3.92
Depreciation 1,638,952 3.22 1,658,035 4.29
Total expenses 30,675,576 94.32 41,186,774 95.20
Net profit 2,054,342 5.68 1,674,125 4.34
Total 32,730,008 100 42,860,899 100
62
Inference:
The common size income statement for the year 2006 to 2007 reveals the
following. The sales figure increasing year after year. In the year 2006-07, cost of sales is
3.14% of the total expenditure. Administrative and other expenses are fluctuating. There
is heavy increase in the net profit of the organization. The net profit hiked from 4.34% to
9.62% . The company must adopt correct pricing and control the unnecessary expenses to
attain high profits.
TABLE-3.5.3
Common size income statement (2007-08 & 2008-09)
Particulars 2006-2007 (Rs) % 2007-2008 (Rs) %
Income:
Sales 40,743,308 95.06 50,283,776 94.2
Other income 83,067 0.19 2,999 0.006
Closing stock 2,034,524 4.75 3,077,500 5.76
Total income 42,860,899 100 53,364,275 100
Expenditure:
Opening stock 2,293,337 5.93 2,034,524 4.06
Purchases 26,507,305 68.64 37,632,183 75.17
Direct expenses 5,367,094 11.15 3,227,328 3.14
Administration
expenses
2,785,170 1.71 2,503,321 1.7
Selling Expenses 2,575,833 3.92 1,443,300 2.88
Depreciation 1,658,035 4.29 1,708,929 3.41
Total expenses 41,186,774 95.20 48,549,585 90.38
Net profit 1,674,125 4.34 4,814,690 9.62
Total 42,860,899 100 53,364,275 100
63
Particulars 2007-2008
(Rs)
% 2008-2009
(Rs)
%
Income:
Sales 50,283,776 94.2 73,789,273.14 94.35
Other income 2,999 0.006 36,832.42 0.05
Closing stock 3,077,500 5.76 4,378,388 5.6
Total income 53,364,275 100 78,204,493.56 100
Expenditure:
Opening stock 2,034,524 4.06 3,077,500 4.38
Purchases 37,632,183 75.17 57,996,976 83.2
Direct expenses 3,227,328 3.14 5,154,960 3.56
Administration expenses 2,503,321 1.7 4,484,750 1.38
Selling Expenses 1,443,300 2.88 3,289,854 1.82
Depreciation 1,708,929 3.41 1,852,595 2.54
Total expenses 48,549,585 90.8 75,856,635 96.88
Net profit 4,814,690 9.62 2,347,858 3.12
Total 53,364,275 100 78,204,493 100
64
Inference:
The common size income statement for the year 2008 to 2009 reveals the
following. The sales figure increased from Rs50,283776 to Rs.73,789,274. In the year
2006-07 cost of sales is 3.56%. There is heavy increase in the other incomes. In the year
2006-07 income decreased from Rs.4,814,690 to Rs.2,347,858.
TABLE-3.5.4
Common size income statement (2008-09 & 2009-10)
Particulars 2008-2009 (Rs) % 2009-2010 (Rs) %
Income:
Sales 73,789,273.14 94.35 53,808,158 94.75
Other income 36,832.42 0.05 2,26,236 0.39
Closing stock 4,378,388 5.6 2,756,820 4.86
Total income 78,204,493.56 100 56,791,215 100
Expenditure:
Opening stock 3,077,500 4.38 4,378,388 7.6
Purchases 57,996,976 83.2 46,609,738 80.9
Direct expenses 5,154,960 3.56 1,813,337 2.36
Administration
expenses
4,484,750 1.38 2,952,237 4.34
Selling Expenses 3,289,854 1.82 1,050,790 6.55
Depreciation 1,852,595 2.54 1,705,259 1.82
Total expenses 75,856,635 96.88 58,509,749 102.98
Net profit 2,347,858 3.12 (1,718,534.14) -(2.98)
Total 78,204,493 100 56,791215 100
65
Inference:
The common size income statement for the year 2009 to 2010 reveals the
following. The sales figure slashed down very. It decreased from Rs.73,789,273 to
Rs.53,808,158 which is almost 27.08% of the previous year. In the year 2009-10 cost of
sales is 2.36%. However in Administrative and other expenses there was a negligible
change due to which organization attained a loss of Rs.629324.
3.6 Common size balance sheet
TABLE-3.6.1
Common size balance sheet (2005-06 &2006-07)
66
Inference:
The common size balance sheet for the year 2006-2007 is as follows:
Share capital of the company is decreasing in %age of the net worth. In 2005-2006 in
21.16% to 15.58%.Secured loan for the company has decreasing trend. It decreases 73.4
to 72.26% of the net worth of the company. Fixed asset of the company is decreasing in
this year from 57.21% to 40.66%. Current liability and provisions is increasing 31.34% to
43.2 %.
TABLE-3.6.2
Common size balance sheet (2006-07 & 2007-08)
Particulars 2005-2006
(Rs)
% 2006-2007 (Rs) %
Sources of funds:
Share capital 4,000,000 21.16 4,000,000 15.58
Reserves & surplus 9,58,937 5.07 1,674,125 6.52
Loan funds:
Secured loan 13,880,857 73.4 18,551,093 72.26
Unsecured loan 70000 0.37 1,445,000 5.64
Total 18,909,794 100 25,670,218 100
Application of funds:
Fixed assets 10,818,040 57.21 10,437,346 40.66
Current assets & Loan and
advances
Cash & bank 2,220,782 11.74 3,941,653 15.32
Sundry debtors 8,327,934 44.04 16,292,170 63.47
Advances and deposits 3,331,174 17.61 6,043,870 23.54
Investments -----
Other assets
Total 13,879,890 73.39 26,277,693 102.37
current liabilities &
provisions:
Less: Current liabilities 5,812,065 30.74 10,914,106 42.52
Expenses for provisions 1,13,785 0.6 4,30,656 1.68
Net Current assets 7,954,040 42.69 11,344,762 59.44
Total 18,909,794 100 25,670,218 100
67
Inference:
The common size balance sheet for the year 2007 to 2008 is as follows: Share
capital of the company has increased from 15.58% to 15.34. Secured loan for the company has
decreasing trend. It increases 72.26% to 60.12. Fixed asset of the company is increasing in this
year of 40.66% to 43.5%. Current liability and a provision is increasing 43.2% to73.53 %.
TABLE-3.6.3
Common size balance sheet (2007-08 & 2008-09)
Particulars 2006-2007 (Rs) % 2007-2008
(Rs)
%
Sources of funds:
Share capital 4,000,000 15.58 4,000,000 15.34
Reserves & surplus 1,674,125 6.52 4,814,690 18.47
Loan funds:
Secured loan 18,551,093 72.26 15,671,252 60.12
Unsecured loan 1,445,000 5.64 1,582,500 6.07
Total 25,670,218 100 106,552,413 100
Application of funds:
Fixed assets 10,437,346 40.66 11,340,102 43.5
Current assets & Loan and
advances
Cash & bank 3,941,653 15.36 4,372,956 16.77
Sundry debtors 16,292,170 63.47 21,192,014 81.29
Advances and deposits 6,043,870 23.54 8,073,148 30.97
Investments
Other assets
Total 26,277,693 102.37 33,638,118 129.03
current liabilities &
provisions:
Less: Current liabilities 10,914,106 42.52 16,984,534 65.15
Expenses for provisions 4,30,656 1.68 2,187,870 8.39
Net Current assets 14,932,931 59.44 14,465,714 56.5
Total 25,670,218 100 26,068,442 100
68
Inference:
The common size balance sheet for the year 2008 to 2009 is as follows: Share
capital figure remained constant however their %age to net worth has increased from
15.34% to 18.98%. Some amount of the secured loans has been paid off. Fixed asset of
the company has been increased and there share is 56.96% to the total assets in the year
2008-09. Current liability and a provision is increasing 73.44% to 107.73%. It can be
noticed that the fixed assets are purchased on credit from the creditors and they both
increased
TABLE-3.6.4
Particulars 2007-2008 (Rs) % 2008-2009
(Rs)
%
Sources of funds:
Share capital 4,000,000 15.34 4,000,000 18.98
Reserves & surplus 4,814,690 18.47 2,218,534 10.53
Loan funds:
Secured loan 15,671,252 60.12 14,362,723 68.17
Unsecured loan 1,582,500 6.07 4,88,480 2.32
Total 26,068,442 100 21,069,737 100
Application of funds:
Fixed assets 11,340,102 43.5 12,001,322 56.96
Current assets & Loan and
advances
Cash & bank 4,372,956 16.77 5,460,046 25.9
Sundry debtors 21,192,014 81.29 19,634,991 91.2
Advances and deposits 8,073,148 30.97 7,.081472 33.61
Investments
Other assets 12000 0.06
Total Current Assets 33,638,118 129.03 32,188,509 150.77
current liabilities &
provisions:
Less: Current liabilities 16,984,534 65.15 22,597,799 107.25
Expenses for provisions 2,187,870 8.39 1,01,755 .48
Net Current assets 14,465,714 56.5 9,488,955 43.04
Total 26,068,442 100 21,069,737 100
69
Common size balance sheet (2008-09 & 2009-10)
Inference
The common size balance sheet for the year 2009 to 2010 is as follows: Share
capital figure remained constant however their %age to net worth has increased from
18.98% to21.27 %. Some amount of the secured loans has been paid off. Current liability
and a provision is increased from 107.73% to 137.54% this means that a heavy amount is
yet to be paid to the creditors of the fixed assets.
3.7 Comparative income statement
Particulars 2008-2009 (Rs) % 2009-2010) (Rs) %
Sources of funds:
Share capital 4,000,000 18.98 4,000,000 21.27
Reserves & surplus 2,218,534 10.53 2,847,858 15.15
Loan funds:
Secured loan 14,362,723 68.17 11,726,999 62.36
Unsecured loan 4,88,480 2.32 230,000 1.22
Total 21,069,737 100 18,804,857 100
Application of funds:
Fixed assets 12,001,322 56.96 12,783,542 67.98
Current assets & Loan
and advances
Cash & bank 5,472,046 25.15 5,420,206 28.82
Sundry debtors 19,634,991 91.2 19,448,973 103.43
Advances and deposits 7,.081472 33.61 7,014,384 37.3
Investments
Other assets
Total 32,188,509 150.77 31,883,563 169.55
current liabilities &
provisions:
Less: Current liabilities 22,597,799 107.25 25,321,640 134.67
Expenses for provisions 1,01,755 0.48 540,810 2.87
Net Current assets 9,488,955 43.04 6,021,112 32.02
Total 21,069,737 100 18,804,857 100s
70
TABLE-3.7.1
Comparative income statement (2005-06 & 2006-07)
Inference:
The sales level has increased 2006 to 2007 in 33.94%.Other income of the company
has increased in 371.27%. The stock differential of the firm in the year of 2006 to 2007 is
decreased to 11.28%.The operating expenses has an increasing trend in both administration
and selling and the net profit of the year is decreased by 18.51%
Particulars 2005-2006
(Rs)
2006-2007 (Rs) INC/DCE %
Income:
Sales 30,419,045 40,743,308
10324,263.00 33.94
Other income 17,626 83,067
65441.00 371.27
Closing stock 2,293,337 2,034,524
(258,813.00) (11.28)
Total income 32,730,008 42,860,899
10,130,891.00 30.95
Expenditure:
Opening stock 3,498,923 2,293,337
(1,205,586.00) (34.45)
Purchases 21,045,864 26,507,305
5,461,441.00 25.95
Direct expenses 2,446,415 5,367,094
2,920,679.00 119.38
Administration
expenses
1,238,368 2,785,170
1,546802.00 124.9
Selling Expenses 8,07,055 2,575,833
1,768778.00 219.16
Depreciation 1,638,952 1,658,035
(19,083.00) (1.16)
Total expenses 30,675,576 41,186,774
10,511,198.00 34.26
Net profit /Loss 2,054,342 1,674,125
(380,217.00) (18.51)
Total 32,730,008 42,860,899
10,130,891.00 30.95
71
TABLE-3.7.1
Comparative income statement (2006-07 & 2007-08)
Inference:
The sales level has increased 2007 to 2008 in 23.42% .Other income of the
company has decreased in 96.39%. The stock differential of the firm in the year of 2007 to
2008 is increased which is almost 51.26% of the last year. The operating expenses were
decreased by 39.87% in both administration and selling and the net profit of the year is
increased.
TABLE-3.7.3
Particulars 2006-2007(Rs) 2007-2008(Rs) INC /DEC %
Income:
Sales 40,743,308 50,283,776
9,540468.00 23.42
Other income 83,067 2,999
(80068.00) (96.39)
Closing stock 2,034,524 3,077,500
1042976.00 51.26
Total income 42,860,899 53,364,275
10503376.00 24.5
Expenditure:
Opening stock 2,293,337 2,034,524
(258813.00) (11.28)
Purchases 26,507,305 37,632,183
11124878.00 41.97
Direct expenses 5,367,094 3,227,328
(2139766.00) (39.87)
Administration expenses 2,785,170 2,503,321
( 281849.00) (10.12)
Selling Expenses 2,575,833 1,443,300
(1132333.00) (4.35)
Depreciation 1,658,035 1,708,929
50894.00 3.07
Total expenses 41,186,774 48,549,585
7362811.00 17.88
Net profit /Loss 1,674,125 4,814,690
3140565.00 187.6
Total 42,860,899 53,364,275
10503376.00 24.5
72
Comparative income statement (2007-08 & 2008-09)
Inference
The sales level has increased 2008 to 2009 in 25.68% .Other income of the
company has decreased by 50.36%. The stock differential of the firm in the year of 2008 to
2009 is increased. The operating expenses are decreased in 59.73% in both administration
and selling and the net profit of the year is decreased.
Particulars 2007-2008(Rs) 2008-
2009(Rs)
INC /DEC %
Income:
Sales 50,283,776 73,789,273.1
4 46019549.00 25.68
Other income 2,999 36,832.42
(10053611.00) (50.36)
Closing stock 3,077,500 4,378,388
13155370.00 187.35
Total income 53,364,275 78,204,493.5
6 49121308.00 23.82
Expenditure:
Opening stock 2,034,524 3,077,500
1042976.00 51.26
Purchases 37,632,183 57,996,976
20364793.00 54.11
Direct expenses 3,227,328 5,154,960
1927632.00 59.73
Administration
expenses
2,503,321 4,484,750
19,814,29.00 79.15
Selling Expenses 1,443,300 3,289,854
1846554 127.93
Depreciation 1,708,929 1,852,595
143666.00 8.41
Total expenses 48,549,585 75,856,635
27307050.00 56.25
Net profit /Loss 4,814,690 2,347,858
(2466832.00) (51.23)
Total 53,364,275 78,204,493
49121308.00 23.82
73
TABLE-3.7.4
Comparative income statement (2008-09 & 2009-10)
Particulars 2008-
2009(Rs)
2009-
2010(Rs)
INC / DEC %
Income:
Sales 73,789,273 53,808,158
(19981115.00) (27.08)
Other income 36,832 2,26,236
189404.00 514.24
Closing stock 4,378,388 2,756,820
(1621568.00) (37.03)
Total income 78,204,493 56,791,215
(21413278.00) (27.38)
Expenditure:
Opening stock 3,077,500 4,378,388
1300888.00 42.27
Purchases 57,996,976 46,609,738
(11387238.00) (19.63)
Direct expenses 5,154,960 1,813,337
(3341623.00) (64.82)
Administration
expenses
4,484,750 2,952,237
(1532513.00) (34.17)
Selling Expenses 3,289,854 1,050,790
(2239064.00) (68.06)
Depreciation 1,852,595 1,705,259
(147336.00) (7.95)
Total expenses 75,856,635 58,509,749
(17346886.00) (22.87)
Net profit /Loss 2,347,858 (1,718,534.14
) (629324.00) (26.8)
Total 78,204,493 56,791215
(21413278.00) (27.38)
Inference:
The sales level has slashed down by 27.08% when compared to last year sales
.Other income of the company has increased. The stock differential of the firm in the year
of 2009 to 2010 also decreased. The operating expense is decreased in 64.82% in both
administration and selling. The company incurred a net loss of Rs.6,29,324.
3.8 Comparative balance sheet
74
TABLE-3.8.1
Comparative balance sheet (2005-06 & 2006-07)
Particulars 2005-2006
(Rs)
2006-2007(Rs) INC / DEC %
Sources of funds:
Share capital 4,000,000 4,000,000 0 0
Reserves & surplus 9,58,937 1,674,125 7,151,188 74.58
Loan funds:
Secured loan 13,880,857 18,551,093 4,670,236 33.65
Unsecured loan 70000 1,445,000 1,375,000 1964.28
Total 18,909,794 25,670,218 6,760,424 35.75
Application of funds:
Fixed assets 10,818,040 10,437,346 -380694 -3.5
Current assets & Loan
and advances
Cash & bank 2,220,782 3,941,653 1,720,871 77.49
Sundry debtors 8,327,934 16,292,170 7,964,236 95.63
Advances and deposits 3,331,174 6,043,870 2,712,696 81.43
Investments
Other assets
Total 13,879,890 26,277,693 12,397,803 89.32
current liabilities &
provisions:
Less: Current liabilities 5,812,065 10,914,106 5,102,041 87.8
Expenses for provisions 1,13,785 4,30,656 316,871 278.5
Net Current assets 7,954,040 11,344,762 3,390,722 42.63
Total 18,909,794 25,670,218 6,760,424 35.75
Inference:
The comparative balance sheet of the year 2006-2007 is as follows
The share capital of the company has remain constant in the year of 2006-07 . The profit of
the company has increased the reserves and surplus by 74.58% The fixed assets of the
company has decreased in 3.5%. The cash position of the company has fluctuating increase
or decreases. The current liability and provisions of the company is increasing year after
year.
75
TABLE-3.8.2
Comparative balance sheet (2006-07 & 2007-08)
Inference:
The comparative balance sheet of the year 2007 to 2008 is as follows.
The share capital of the company has remain constant. The secured loan of the company
has decreased in this year by 15.52% .The fixed assets of the company has increased. The
cash position of the company has fluctuating increase or decreases. The current liability and
provisions of the company is fluctuating year after year.
Particulars 2006-2007(Rs) 2007-2008(Rs) INC / DEC %
Sources of funds:
Share capital 4,000,000 4,000,000 0 0
Reserves & surplus 1,674,125 4,814,690
3,140,565 187.6
Loan funds:
Secured loan 18,551,093 15,671,252 -2,879,841 -15.52
Unsecured loan 1,445,000 1,582,500 1,37,500 9.51
Total 25,670,218 26,068,442 3,98,224 1.55
Application of funds:
Fixed assets 10,437,346 11,340,102 9,02,756 8.6
Current assets & Loan
and advances
Cash & bank 3,941,653 4,372,956 4,31,303 10.94
Sundry debtors 16,292,170 21,192,014 4,899,844 30.07
Advances and deposits 6,043,870 8,073,148
2,029,278 33.57
Investments
Other assets
Total 26,277,693 33,638,118 7,360,425 28.01
current liabilities &
provisions:
Less: Current liabilities 10,914,106 16,984,534
6,070,428 55.62
Expenses for provisions 4,30,656 2,187,870
1,757,214 16.1
Net Current assets 11,344,762 14,465,714 3,120952 27.51
Total 25,670,218 26,068,442 3,98,224 1.55
76
TABLE-3.8.3
Comparative balance sheet (2007-08 & 2008-09)
Inference:
The comparative balance sheet of the year 2008-2009 is as follows.
The share capital of the company remains same. The secured loan of the company has
decreased in this year by 8.35% .The fixed assets of the company has increased by
purchasing the new assets on credit. The cash position of the company has increased . The
current liability is also increasing as the fixed assets were purchased on credit and hence
they both increases.
Particulars 2007-2008(Rs) 2008-2009(Rs) INC / DEC %
Sources of funds:
Share capital 4,000,000 4,000,000 0 0.00
Reserves & surplus 4,814,690 2,218,534 -2,596,156 -53.92
Loan funds:
Secured loan 15,671,252 14,362,723 -1,308,529 -8.35
Unsecured loan 1,582,500 4,88,480 -1,094,020 -69.13
Total 26,068,442 21,069,737 -4,998,705 -19.17
Application of funds:
Fixed assets 11,340,102 12,001,322 6,61,220 5.83
Current assets & Loans
and advances
Cash & bank 4,372,956 5,472,046 1,099,090 25.13
Sundry debtors 21,192,014 19,634,991 -1,557,023 -7.34
Advances and deposits 8,073,148 7,.081472 -9,91,676 -12.28
Investments 0 0.00
Other assets
Total 33,638,118 32,188,509 -1,449,609 4.31
current liabilities &
provisions:
Less: Current liabilities 16,984,534 22,597,799 5,613,265 33.05
Expenses for provisions 2,187,870 1,01,755 -2,086,115 -95.35
Net Current assets 14,465,714 9,488,955 -4,976,759 -34.4
Total 26,068,442 21,069,737 -4,998,705 -19.17
77
TABLE-3.84
Comparative balance sheet (2008-09 & 2009-10)
Inference:
The comparative balance sheet of the year 2009 to 2010 is as follows.
The share capital of the company remains same. The secured loan of the company has
decreased in this year .The fixed assets of the company has increased. The cash position of
the company has fluctuating increase or decreases. Large amount to the creditors has to be
paid.
Particulars 2008-2009(Rs) 2009-2010(Rs) INC / DEC %
Sources of funds:
Share capital 4,000,000 4,000,000 0 0.00
Reserves & surplus 2,218,534 2,847,858 6,29,324 28.36
Loan funds:
Secured loan 14,362,723 11,726,999 -2,635,724 -18.35
Unsecured loan 4,88,480 230,000 -2,58,480 -52.91
Total 21,069,737 18,804,857 -2,264,880 -10.75
Application of funds:
Fixed assets 12,001,322 12,783,542 -7,82,220 -6.52
Current assets & Loan
and advances
Cash & bank 5,472,046 5,420,206 -51840 -0.95
Sundry debtors 19,634,991 19,448,973 -1,86,018 -0.94
Advances and deposits 7,.081472 7,014,384 -67,088 -0.95
Investments
Other assets
Total 32,188,509 31,883,563 -3,04,946 -.095
current liabilities &
provisions:
Less: Current liabilities 22,597,799 25,321,640 2,723,841 12.05
Expenses for
provisions
1,01,755 540,810
-4,39,055 -4.31
Net Current assets 9,488,955 6,021,112 3,467,843 -36.55
Total 21,069,737 18,804,857 -2,264,880 -10.75
78
3.9 TREND ANALYSIS
Table-3.9.1
Trend Income Statement in the study period (2005-06 to 2009-10)
0
20
40
60
80
100
120
140
160
2005-06 2006-07 2007-08 2008-09 2009-10
Sales
Particulars
2005-06 2006-07 2007-08 2008-09 2009-10
Trend Trend Trend Trend Trend
Sales 100 133.94 123.42 125.68 72.92
Total income 100 130.95 124.5 123.82 72.62
Total expenditure 100 134.26 117.88 156.25 77.13
Net profit 100 81.49 287.6 48.77 73.2
79
0
20
40
60
80
100
120
140
2005-06 2006-07 2007-08 2008-09 2009-10
Total income
80
0
50
100
150
200
250
300
350
2005-06 2006-07 2007-08 2008-09 2009-10
Net profit
0
20
40
60
80
100
120
140
160
180
2005-06 2006-07 2007-08 2008-09 2009-10
Total
expenditu
re
81
Inference:
By taking 2005-06 as base year (100%) the sales, total income, total
expenditure, and net profit during the study period were analysis by taking trend as a tool.
The above table shows the movement of variables during the study period. The entire
variable shows the lower trend during the 2009-10.
82
TABLE-3.9.2
TREND BALANCE SHEET IN THE STUDY PERIOD (2005-06 to 2009-10)
Inference
Trend Percentages of Balance Sheet is done by taking 100 as base for all financial
years 2006 to 2010. Fixed assets have been decreased during the period 2009-10.current
assets, Current liabilities and provisions were fluctuating during the study period. Therefore
the balance sheet total shows an increasing trend in the figures.
Particulars
2006 2007 2008 2009 2010
Trend Trend Trend Trend Trend
Share capital 100 100 100 100 100
Reserves and
surplus
100
174.8 287.6 46.08 71.64
Secured loans 100 133.65 84.48 91.65 81.65
Un secured
loans
100
2064.28 109.51 30.87 47.09
Fixed assets 100 96.5 108.6 105.83 93.48
Debtors 100 195.63 130.07 92.66 99.5
Cash and bank
balance
100
177.49 110.94 125.13 99.5
Advances and
deposits
100
181.43 133.57 112.28 99.5
Current
liability
100
187.8 155.62 133.05 112.05
Provisions 100 378.5 116.1 4.65 95.69
83
FINDINGS
CHAPTER-IV
FINDINGS
84
 The current ratio is more than 2% in the first two years. But in all other years the
current ratio is slightly lower than the normal. This shows that the company is not
enjoying credit worthiness.
 The liquid ratio is more than the normal (i.e.) 1:1in all the study periods. Hence the
firm is controlling its stock position because there is linear relationship between
current ratio and liquid ratio.
 The absolute ratio is almost same for all the years except in the year 2009-10
 In all the years the debt equity is less, when compared with borrowings. Hence the
company is not maintaining its debt position.
 The proprietary ratio during the first two years is less than the 1/3. During the other
sudy period is it is more than 30%
 During the year 2005-06 it is only8.14% which shows lower position of cost of goods
sold .But at the same time during 2009-10 it is 13.3.
 The sale is almost 3 times more than the fixed assets 2005-06 and in 2006-07 and
2007-08 It is more than 4 times. During 2009-10 it is more than 5 times and reaches
its highest in the year2008-09 ie6.14 times.
 During all the years of study period the sales is 2 to 12 times more than the working
capital.
 During all the study period years the relationship between sales to total assets is high.
 The sales are between 5.5 to 10.8 times more than proprietor's funds. It shows the
firms is maintaining the better utilization of own funds.
 The Net profit from the year 2005-06 is very less and in the year 2009-10 the
company made a loss.
 During 2009-10 the gross profit position is 8.05%. But in 2005-06 it was 9.89 %.and
it was fluctuating more than the base year in all other years of the study period.
 During 2005-06 it was 6.75% on sales and in 2006-07 it was 4.10. It reaches its
highest in the year 2007-08 ie 9.57 But in the last two years it was just above3.. This
means that either there is any defect in pricing the product or excess non-value added
expenditures which reduces the net profit of the company. The sales of the
organization are also decreasing and hence management must take care of the quality
85
and market situations into consideration to resolve the issue so that it may bring good
profits to the organization.
 The administration and selling expenses during 2008-09 is very high when compared
to previous year's %age as they were in between 3-5% of sales. This may also be one
of the reasons to a net loss in that year.
 The sales figure increasing year after year. It increased about Rs.40,324,263.
Administrative and other expenses were increasing. The other income of the company
was increased year by year.
 Net profit has been reduced from 100% to (0.25) %.
 During the first four years period the total income was higher than the total
expenditure which is good for the company. But the total expenditure was high in the
period 2009-10. Hence the management has to find immediate remedies to reduce it.
 Share capital has been remained constant.
 Sundry debtor has been fluctuating over the years. It increased during the first two
years of the study period from 100% to 130.7% and then from there it decreased to
92.66% in the year 2008-09
86
SUGGESTIONS
CHAPTER-V
87
SUGGESTIONS
 The company's profit over the last two years has been decreasing when compared to
previous year and even it incurred loss in the last year. The company must increase
the profit in future. The company must take steps to increase the profit level.
 The Gross Profit ratio can be improved by increasing the gross profit and the factors
decreasing the gross profit ratio should be thoroughly checked timely whether they
are operating factors or any misleading factors.
 Non-operating expense of the company is high. So the management should take
necessary steps to reduce the non-operating expenses. The management should take
steps to reduce the borrowed capital.
 Net fixed asset of the company has increased and even though they are not utilizing
the enhanced technology to increase sales. So the management should take initiative
steps for the proper utilization of the resources.
 The liquidity position of the company is quite satisfactory. And this must be
improved further for the purpose of proper utilization of the liquid assets of the
company.
 The cash ratio position of the company is not satisfactory for the last five years. It is
fluctuating over the years and there is no standard ration maintained. So the
management should take steps to improving the cash position of the company.
 The sales of the organization can be further increased by improving the quality
through optimum utilization of company's resources (i.e. assets, raw materials, credit
system, etc.) and that in turn will increase the overall profits of the organization..
 The Management must also study the market position and it also find the demand
prevailing in the market for the products and thus this will guide them to enhance
their sales volume.
88
CONCLUSION
CHAPTER-VI
89
CONCLUSION
On studying the financial performance of Cee vee Foot wear's Pvt. Ltd for a
period of five years from 2005-06 to 2009-10, the study reveals that the financial
performance is better. Cee Vee foot wear's Pvt. Ltd has been able to maintain optimal
cost positioning. Despite price drops in various products, the company has been able to
maintain and grow its market share to make strong margins in market, contributing to the
strong financial position of the company. The company was able to meet its entire
requirements for capital expenditures and higher level of working capital commitment
with higher volume of operations and from its operating cash flows.
.
90
APPENDIX
6.1 Appendix
91
Balance sheet as on 31-3-2010
Particulars Schedule Amount
SOURCES OF FUNDS
Share capital
RESERVES AND
SURPLUS
P/L A/C
LOANS AND FUNDS
Secured loans
Unsecured loans
A
B
C
4,00,000
2,218,534
14,362,723
488,480
Total 21,069,734
APLLICATION OF FUNDS
FIXED ASSETS
Gross Block
Less; Depreciation
Net Block
Differred Tax Assets
Current assets ,Deposits&
Advances
Less:Current liabilities and
provision
NET CURRENT ASSETS
D
E
F
G
20,990,142.22
10,289,699
32,188,509
22,699,554
10,700,453
880,329
9,488,955
Total 21,069,734
92
BIBLIOGRAPHY
6.2 BIBLIOGRAPHY
BOOKS
93
 T.S Reddy and Y. Hariprasad Reddy, Financial management, New
Delhi: Tata McGraw hill Publishing company Ltd., 2005, 3rd
edition
 M.A Sahaf Management and Accounting 4th Edition, Tata McGraw Hill
Publishing Company Ltd, 5th
Reprint - 2006 - New Delhi.
 IM .Pandey, Financial Management 8th
Edition, Vikas Publishing house
Pvt Ltd, 6th
Reprint -2006- New Delhi.
 IM .Pandey, Working capital Management 8th
Edition, Vikas Publishing
house Pvt Ltd, 6th
Reprint -2006- New Delhi
 R.K. Sharma & S.K. Gupta, Financial Management
 R.P. Rustagi, Financial Management
WEBSITE:
http://money.newkerala.com/company-profile-id-16020114.00.html
www.hillwoodindia.com
JOURNALS AND ARTICLES:
 Annual Reports Of CEE VEE FOOTWEARS PVT. LTD
 General Articles and Magazines Of CEE VEE FOOTWEARS PVT .LTD
 Survey of Indian industry- The Hindu
94

A study on financial performance analysis at cee vee

  • 1.
    CONTENTS LIST OF TABLES S.NOTITLE PAGE NO 1. Abstract List of tables List of figure 1 Introduction 1.1 Industry Profile 1.2 Company Profile 1.3 Objectives of the study 1.4 Scope of the study 1.5 Limitations of the study 1. 6Review of literature 01 04 11 16 17 17 18 2. Research Methodology 21 3. Data Analysis and Interpretation 23 4. Findings 72 5. Suggestion 74 6. Conclusion 75 Appendix 76 Bibliography 77
  • 2.
    TABLE NO PARTICULRS PAGE NO 3.1.1 Current ratio 24 3.1.2Liquid ratio 26 3.1.3 Absolute liquidity ratio 28 3.2.1 Debt equity ratio 30 3.2.2 Proprietary ratio 32 3.3.1 Stock turnover ratio 34 3.3.2 Fixed assets turnover ratio 36 3.3.3 Working capital turnover ratio 38 3.3.4 Total assets turnover ratio 40 3.3.5 Capital turnover ratio 42 3.3.6 Return on total assets 44 3.4.1 Gross profit ratio 46 3.4.2 Net profit ratio 48 3.4.3 Expenses ratio 50 3.5.1 Common Size Income Statement (2006, 2007) 52 3.5.2 Common Size Income Statement (2007, 2008) 53 3.5.3 Common Size Income Statement (2008, 2009) 54 3.5.4 Common Size Income Statement (2009, 2010) 55 3.6.1 Common Size Balance Sheet (2006, 2007) 56 3.6.2 Common Size Balance Sheet (2007, 2008) 57 3.6.3 Common Size Balance Sheet (2008, 2009) 58 3.6.4 Common Size Balance Sheet (2009, 2010) 59 3.7.1 Comparative income Statement (2006, 2007) 60 3.7.2 Comparative income Statement (2007, 2008) 61 3.7.3 Comparative income Statement (2008, 2009) 62
  • 3.
  • 4.
    FIGURE NO PARTICULRS PAGE NO 3.1.1Current ratio 25 3.1.2 Liquid ratio 27 3.1.3 Absolute liquidity ratio 29 3.2.1 Debt equity ratio 31 3.2.2 Proprietary ratio 33 3.3.1 Stock turnover ratio 35 3.3.2 Fixed assets turnover ratio 37 3.3.3 Working capital turnover ratio 39 3.3.4 Total assets turnover ratio 41 3.3.5 Capital turnover ratio 43 3.3.6 Return on total assets 45 3.4.1 Gross profit ratio 47 3.4.2 Net profit ratio 49 3.4.3 Expenses ratio 51
  • 5.
    ABSTRACT ABSTRACT Finance has beendescribed as a lubricant of economic activity, without which the entire business will grind to a halt. And money has been aptly described by monitory economist called Geoffrey Crowther, “Finance as the essential invitation on which all the
  • 6.
    rest is based.With unlimited wants and limited financial resources, the financier is concerned with what is produced, requirements of funds (liquid and illiquid ), allocation of funds selection of developmental priorities, determination of gestation periods, proper monitoring of accounts to avoid cash flow problems and to ensure the profitability of the enterprises. The main objective of financial performance analysis to judge the financial health the undertaking and to judge the earning performance of the organization and to provide the company with appraise for investment opportunity or potentiality. This analysis is carried over about five years. This project deals with the financial performance analysis in the organization. The ratio analysis, comparative analysis and trend analysis are the tools to analyze the financial performance of the company. The study reveals that the financial performance of the organization has been better. But the company's profit over the last two years has been decreasing when compared to previous years. So the management should take necessary steps to improve their financial position . .
  • 7.
  • 8.
    2 CHAPTER-I INTRODUCTION OF THESTUDY Financial statement: Financial statements contain a wealth of information, which if properly read, analyzed or interpreted can provide valuable insights into a firm’s performance and position. Also it is the starting point for making plan, before using any sophisticated forecasting and planning procedure. By analyzing these statements, firm can evaluate its past, present, projected performance etc. Usually management would be particularly interested in knowing the financial strength of firm to make their best use and to be able to spot out the financial weakness of the firm to take suitable corrective action. The future plan of the firm should be laid down in view of the firm’s financial strength and weakness. In short, through financial analysis and interpretation it helps effectively the user for decision-making process Meaning of financial management Financial management is that managerial activity which is concerned with the planning and controlling of the company’s financial resources. In other words the financial management is basically concerned with two important aspects: 1) Raising of the required funds at the lower cost ; 2) Making optimum use of funds so raised The finance manager has to ensure the rational decision making efforts at the each any every successive stages of pre – investment and post investment. In the absence of proper appraisal system and evaluation of managerial abilities, there will be misallocation morality and lopsided growth in undesired way leading to holocaust of economic wealth
  • 9.
    3 Financial statement A financialstatement is an organized collection of data according to logical and consistent accounting procedures. Its purpose is to convey an understanding of some financial aspects of a business firm. It may show a position at a moment of time as in the case of a balance sheet, or may reveal a series of activities over a given period of time, as in the case of an income statement. Thus, the term financial statement generally refers to the basis statements; i) The income statement ii) The balance sheet iii) A statement of retained earnings iv) A statement of charge in financial position in addition to the above two statement. Financial statement analysis: It is the process of identifying the financial strength and weakness of a firm from the available accounting data and financial statement. The analysis is done by properly establishing the relationship between the items of balance sheet and profit and loss account the first task of financial analyst is to determine the information relevant to the decision under consideration from the total information contained in the financial statement. The second step is to arrange information in a way to highlight significant relationship. The final step is interpretation and drawing of inferences and conclusion. Thus financial analysis is the process of selection relating and evaluation of the accounting data/information. Traditional approach to financial statement The theory of finance, both on the corporate and on the individual investor level also largely ignores financial statement analysis and interpretation. For example, the extensive portfolio theory literature is practically devoid of studies integrating financial statement information with the input requirements of the portfolio model. One of the major contributors to portfolio theory, the financial analyst, Sharpe provides in this book that none of which deals with financial statement analysis. It is also interesting to note that regarding collection on theory on finance usually do not include studies related to
  • 10.
    4 financial statement analysis.financial statement analysis remains in the initial state of development of the science of financial management New Approach to Financial statement Analysis Recent research on the area signifies the beginning of a new approach which is mainly characterized by the emphasis on development of financial analysis techniques within the context of formal decision models. L. Financial statement is thus viewed as information – processing system designed to provide Data for Decision making models, such as the portfolio selection model. Bank lending decision models and corporate financial management models. The purpose of financial statement analysis is to provide the data required by the model (e.g., predictions of future returns) in the most efficient (less costly) way. Importance of Financial Analysis and Interpretation Financial statements contain a wealth of information, which if properly read, analyzed or interpreted can provide valuable insights into a firm’s performance and position. Also it is the starting point for making plan, before using any sophisticated forecasting and planning procedure. By analyzing these statements, firm can evaluate its past, present, projected performance etc. Usually management would be particularly interested in knowing the financial strength of firm to make their best use and to be able to spot out the financial weakness of the firm to take suitable corrective action. The future plan of the firm should be laid down in view of the firm’s financial strength and weakness. In short, through financial analysis and interpretation it helps effectively the user for decision-making process This studying contain following analysis: 1) comparative analysis statement 2) common-size analysis statement 3) Ratio analysis 4) Trend analysis.
  • 11.
  • 12.
    6 1.1 INDUSTRY PROFILE Footwearis estimated to have started its long history of human use during the “ICE AGE”, some five million years ago un kind weather conditions are said to have created necessity for footwear. Other evidence shows that footwear came to use at the end of the Paleolithic period at about the same time the early human learned the art of leather training. Early pieces of footwear were made of wrapping usually made of leather or dried grasses later on the pieces were developed from an oval piece of leather, which is bound by a piece of strong leather thongs, sandals which are the first crafted footwear, are the success of this wrappings. In Egyptian funeral champers, paintings show the different stages in the preparation of leather and footwear. The images also show that in Egypt, footwear depicted power and close the characteristics which are missing in commoner’s footwear. Egyptian sandals were crafted using straw, papyrus or palm fiber. Later on Egyptian women adorned their footwear with precious and jewels. Material evidences shows that Greeks loved and took good care of their feet by using different footwear for different activities. Greek women wearing sandals to signify their social classes. Their footwear signified beauty, elegance, refinement and extra vagance. Some Greek women used to wear elevated sandals, which created a clacking sound when the wearer moves. In Mesopotamia leather wrappings are tied to the feet by a strip of the same material. Romans on the other hand created other durable leather thongs so their legions can travel to place on foot. It also believed that foot fetishes began with the Romans. In Roma, footwear also exhibition social class. The consults were white shoes, the senators were brown shoes, and the uniform footwear for rest of the regions was a short pair of books that uncovered the shoes. But in all those early civilizations, footwear indicated social status. Footwear consists of garments that are worn over the feet. They are worn mainly for protection and hygienic, but also for fashion and adornment. Footwear items come from a wide range of
  • 13.
    7 materials including leather,rubber canvas, wood and plastic. But early pieces are made from available materials like straw, leather, crow hide and grasses. When footwear is assembled, the main components are adhesive, cushion, counter fort heel, insole, laces, sole, steel, shank, tack, teo puff, tread and welt. Generally footwear is classified in to books, industrial footwear, shoes and sandals. Boots are available as cowboy books, galoshes, ski boots, thigh, and length boots and so on. Industrial footwear includes plastic and rubber loafers, which are used in laboratories, construction sites and production lines. Shoes include athletic shoes (or running shoes), climbing shoes, clogs, high heels, marry janes, moccasins, maker loafers, tap shoes and cross training shoes, sandals on the other hand includes espadrilles, flip fops thongs, slide one and slippers. Footwear is considered as an extension of ones personality well maintained footwear size things about the owner with cleanliness as the most important concern. INDIAN FOOTWEAR INDUSTRY India is engrossed with different civilizations, cultures, religious customers and conversions, climate and socio economic conditions. The esteem conditions one tracks may be the prime causes for footwear wearing habits. All over the country, different types of traditional footwear are being produced to meet the consumer’s preference. In Maharashtra, ordinary chapels with leather soles and uppers or chapels made out of leather uppers with leather source called as ‘kothapuri’, ‘gadag’, and ‘karundavadi’. In Gujarat and Rajasthan ‘leather juti’ and ‘Gujarat nagara’, in Orissa, “kataki chapels”, and in Punjab “plain Panjabi juti” are popular traditional names. In Punjab, the demand for traditional footwear called as “saadi” and “kisan juti” and the ladies variety known as janana juti is quite popular. The plain juti type of artistic footwear made out of tanned leather has great demand in urban and rural areas. The second popular pattern of footwear in Punjab and Rajasthan is “khasida juti or embroided upper juti” both the states are well known for this variety artistic footwear. It is observe that though this pattern is attractive, the comfort is lacking because there is difference in the contraction of the right or left of the footwear. However those who are
  • 14.
    8 habituated to wearthe local type from childhood do not express any difficulty since they do not use any other type of footwear. In Kerala, Tamilnadu and other parts of the country, customer’s preference for footwear is mostly determined by fashion, conformability etc..rather than tradition. INDIAN LEATHER INDUSTRY The Indian leather industry occupies a place of prominence in the country’s economy in view of its massive potential for employment, growth and exports. Thus has been increasing emphasis on its planned development, aimed at optimum utilization of available raw material for maximize returns especially from exports. India is the largest livestock holding country 21 percentages, large animals and 11 percent small animals. • Annual production value over as 4 billion. • Annual export value over as 2 billion. • Export growth (AGR) 8.20 percent (2000-2004). • About 2.50 million workforces (30% women). • Promising technology inflow and foreign direct investment. • Top priority to occupied safety and work environment. • Material concern for consumer safety. PRODUCTS EXPORTED • Leather footwear • Footwear component (shoes, uppers, soler etc.) • Leather garments • Leather goods • Finished leather
  • 15.
    9 MAJOR ITEMS OFINDIAN FOOTWEAR • Hides • Skins • Leather footwear • Leather shoe uppers • Non leather footwear • Leather garments • Leather goods • Industrial gloves • Saddler Indian footwear industry – A critical analysis In India, the footwear production was in the hands of individual or small scale sector. In olden day’s rural areas the footwear made was exchange under barter system. The urbanization, mechanization and change in life style have demanded for mass production resulted in whole sale and retail sales. The footwear industry is a significant segment of the leather industry in India. India ranks second among the footwear producing countries next to China. The industry is a labour intensive and is concentrated in large scale units, the sandals and uppers produced in the household and cottage sector. India produces more of gent’s footwear while the world’s major production is being ladies footwear. In the case of chapels and sandals, use of non leather material is prevalent in the domestic market. The major production centers in India are Chennai, Rainpet, Ambar in Tamilnadu, Mumbai, Kanpur in UP, Jalander in Punjab and Agra. The following table indicating concentration of units in various parts of the country
  • 16.
    10 Region Large &Medium scale industry Small-scale industry House hold Tamilnadu 64 31 7 Delhi up north 4 8 2 Agra, Kanpur 9 34 14 Calcutta 1 3 19 Bangalore 6 3 4 Mumbai 3 11 0 Others 13 10 3 The estimated annual footwear production capacity 1736 million pairs (776 million pairs of leather footwear and 960 million pairs of non leather footwear). Region using share of total estimated capacities are as follows Region Leather shoes Non leather shoes Leather shoe upper Leather sandals Non leather sandals Tamilnadu 26 5 54 1 0 Delhi and up north 10 77 4 1 60 Agra, Kanpur 45 0 32 62 0 Calcutta 12 0 2 3 0 Bangalore 3 3 4 0 0 Others 0 13 3 1 40 Total 100 100 100 100 100 IMPORT The global import of footwear (leather and non leather) in terms of value was around US dolor 43278 billion, accounting a share 63.42 % in the total import of leather product out of this, import of leather footwear alone accounted for US dolor 26379 million and non leather footwear US dolor 16899 million.
  • 17.
    11 EXPORT India’s export ofleather footwear touched US $ 33/million, recording an increase of 3.29 percent over the preceding year. India thus holds a share of 1.25 percent in the global import of leather footwear. The major markets for India leather footwear one the UK, USA, Germany, Italy, France, Middle east and Russia nearly 71 % of India’s exports of leather footwear is to Germany, UK and Italy. The India’s footwear industry is provided with institutional infrastructural support through premier institutions like central leather research institute, Chennai footwear design and development institute, Nodia national institute of fashion technology New Delhi etc..in the areas of technological development, design and product development and human resource development. Now a days wearing footwear is a necessity rather than a fashion for the human beings. Hence the demand for footwear is also increasing day by day. The different classes of people using different types of quality of footwear’s depending on their purchasing power. The middle and lower income groups prefer low cost durable, wear and tear resistant footwear that can be used in all domestic condition where as the high income groups prefer the latest type of footwear which are highly costlier. The first preference of the middle and lower income groups is the poly viny 1 (horide PVC footwear) which will satisfy all their conditions with regard to the footwear’s. Popularity of PVC chapels is increasing among the people and it will lead to the demand for their chapels. As a result almost all footwear companies are trying to shift their chapels from rubber to the PVC chapels PVC CHAPPALS Development in polymer technology coursed the invention of multi purpose raw material, PVC is a very friendly material and we can convert it in to appropriate form and size with suitable could comparing to their chemicals, their product has no harmfulness in human body. At the same time, it is very attractive and becomes an essential product in human life.
  • 18.
    12 The leading ofPVC chapels manufacture from North India especially Delhi, UP, West Bengal, Bihar etc. in Kerala repressed PVC chapels are products in many part of the state. Bata’s ,sandals and Actions micro all the alternatives in Kerala market. The PVC footwear will provide longer life, low cost; wearing comfort and durability to the footwear can be used in all seasons especially in rainy season. By considering all this, one of the leading footwear company in Kerala, CV footwear manufactures PVC footwear from virgin materials which after better style, comfort, colors, durability etc. HILLWOOD GROUP of companies is a partnership firm which is constituted by Mr.V.Shareef the chairman of the company at Chungam, Feroke. The manufacturing unit is constituted by him with an investment of Rs.1, 80,000000. The company is concerned with producing sofitel and soft pu footwear’s and in timber manufacturing, building works and building materials. The unit is started with producing both Sofitel and Soft Pu in 2005 itself. It is highly demanded by market.
  • 19.
  • 20.
    14 1.2 COMPANY PROFILE HILLWOODgroup of companies is today a leading business entity in south India. This group has been in the forefront of timber trading and manufacturing business for almost 30 years. The foresighted vision of its promoters and their commitment to quality and customer satisfaction has been earned the group a reputation among its customers and clients. This company has branches in Pollachi and Selam at Tamilnadu which is managed by Mr.Shareef. The HILLWOOD group of companies is one of the leading companies in footwear manufacturing in the state of Kerala. The rich legacy of the group is successfully carry forward by their third generation and today the group has diversified interest in real estate, transportation and global trade. HILLWOOD, the pioneering wood exporting company in Kerala located in Feroke near Calicut. This business is exclusively exporting and importing wood. They have been trusted world over by their valuable customers. Their commitment to quality and timely delivery propelled their growth. This company is well experienced in timber logs and distribution focused on dependable service and on filling the special needs of their overseas customers. They also cater to the requirements of customers in India too. Wood supplied by HILLWOOD is widely used in India, abroad for quality furniture, interior decoration and other constructions and is much sought after across the globe. OTHER COMPANIES UNDER THE HILLWOOD GROUP OF COMPANIES  HILLWOOD IMPORT AND EXPORT PVT.LTD.  HILLWOOD FURNITURE PVT.LTD.  CONCORD POLYMERS  SAS POLYMERS
  • 21.
    15  HILLWOOD BUILDINGMATRIALS  HILLWOOD COLLANADE DIVISIONS OF HILLWOOD GROUP OF COMPANIES FOOTWEAR DIVISION CEE VEE FOOTWEAR It is the largest manufacturers and exporters of quality fashionable footwear for men, women and kids especially in southern region of India. They have an extensive network of reputed suppliers, who provide them with the finest quality of inputs and material. They are always open to developing new range of footwear as required by their customers, according to latest fashion trends and styles. They focus on quality and aim to achieve total customer satisfaction. They use very advanced modern technologies for the production process. Their footwear is specially manufactured to face different climates and is available in different styles types and sizes. In addition the attractive and affordable prices of the footwear have made them a huge hit among the admirers of quality footwear. TIMBER DIVISION HILLWOOD imports and exports, the pioneering wood exporting company in Kerala, located in Feroke, Calicut. HILLWOOD is exclusively exporting and importing wood. They are well experienced in timber logs and distribution focused on dependable service and filling the special needs of their valuable customers. Wood supplied by HILLWOOD is widely used in India and abroad for quality furniture, interior decoration and other constructions. HILLWOOD furniture is a company that continuous to lead the industry in today’s home and office furnishings. They set new trends in life style with quality benchmark products, redefining the wood piece of furniture to a life style product which dictates pride of processing it. BUILDERS DIVISION
  • 22.
    16 HILLWOOD builders areone of the renowned names in the construction segment. Their buildings are testimony for the quality and timely completion of projects has enabled the HILLWOOD to become one of the sought after companies for all construction requirements. HILLWOOD is backed by an in-house team of architects and engineers, a dictated and thoroughly committed workforce. HILLWOOD builders follow the best practices in the industry like producing quality raw materials, conformance to international standards and a commitment to schedules. Carefully chosen locations, their buildings are aesthetically appealing, functionally efficient and decidedly up market. Comfortable abodes, countryside aesthetics contemporary amenities. It offers a classic lifestyle to its customers. BUILDING MATERIALS HILLWOOD building materials is a one stop solution for all our building construction needs. They help the customers to find the finest brand, trendy designs, latest news and events in the construction industry. Construction materials need to be well selected as it is an asset for a lifetime. HILLWOOD provides all the sufficient details regarding the constructions in HILLWOOD. Each of the building construction material includes as a separate category as it makes easy to navigate through the essential construction material. HILLWOOD group of companies furnishes the details of wooden tiles, window frames, door frames and interior decorative woods. PROFILE OF CEE VEE The CEE VEE footwear has constituted a manufacturing unit by name SOFITEL footwear’s proposed to be set up at Chungam, Feroke. Footwear manufacturing industries is one of the flourishing industries in India. The demand for quality footwear is increasing day by day. It is proposed to manufacture out of virgin PVC materials by using latest technology. There are very similar units in south India. The market demand for such quality footwear’s are met out of supply from manufacturing unit in Delhi. Therefore there is an excellent scope for such units in Kerala. The promoters of the project HILLWOOD group is headed by V. Shareef has already successfully established similar units in Feroke by name “CEE VEE FOOTWEAR PVT.LTD”. The great success of this project and inability to supply products as per market demand promoted by the promoters to set up a similar new unit and adjacent to existing company.
  • 23.
    17 LOCATION The unit islocated at land adjacent to National Highway, Chungam, and Feroke. The land is owned by managing partner V.Shareef and his given to the firm on else. The location is deal all infrastructural facilities like road, water, electricity, labour force etc.are available. Since the unit is located adjacent to M/S CEE VEE footwear pvt.ltd. This is similar to the proposed unit, promoters more operational, convenience and economy. CONSTITUTION The unit SOEITEL footwear’s is constituted as a partnership firm with V.Shareef as a managing partner and C.P. Najbudheen and C.P Suhara as co partners. They are the promoters of CEE VEE footwear pvt.ltd as well as HILLWOOD group of companies. INVESTMENT REQUIREMENTS The working capital requirements works out 75,00,000 with building, plant and machinery and other equipments including mould works 120 lakhs.
  • 24.
    18 ORGANIZATIONAL CHART Board ofdirectors Managing director Executive director Personnel Production Finance Marketing Sales promotion Advertisement Office assisstantsSupervisor Channel of distribution Market research Un skilled laborsSemi skilled laborsSkilled labors Accountants Chairman
  • 25.
  • 26.
    20 STUDY 1.3 OBJECTIVES OFTHE STUDY  The basic objective of studying the ratios of the company is to know the financial position of the company.  To know the borrowings of the company as well as the liquidity position of the company.  To study the current assets and current liabilities so as to know whether the shareholders could invest in Foot wears Ltd or not.  To study the profits of the business and net sales of the business and to know the stock reserve for sales of the business.  To know the solvency of the business and the capacity to give interest to the long term loan lenders (debenture holders) and dividend to the share holders.  To study the balance of cash and credit in the organization
  • 27.
  • 28.
    22 SCOPE AND LIMITATIONSOF THE STUDY SCOPE OF THE STUDY The scope of the study involves the financial analysis of APCO SUZUKI Pvt ltd, with the help of ratio analysis for 5 years. The study was extended to finance department in particular and for the study confiner to APCO SUZUKI Pvt ltd the . The study also includes Trend analysis 1.5 LIMITATIONS OF THE STUDY  The analysis was made with the help of the secondary data collected from the company.  All the limitations of ratio analysis, common-size statement, comparative statements, and trend analysis and interpret are applicable to this study.  The period study is only 5 years from 2005-06 to 2009-10
  • 29.
  • 30.
    24 REVIEW OF LITERATURE 1.6REVIEW OF LITERATURE a) Environmental and Financial Performance Literature "We review the growing literature relating corporate environmental performance to financial performance. We seek to identify achievements and limitations of this literature and to highlight areas for further research. Our primary interest is to assess the adequacy of the literature in informing corporate managers how, when, and where to make pro-environment investments that will pay off with financial returns for long-term shareholders. To do so, we create a conceptual framework that maps the influence of regulators, public health scientists, environmental advocates, consumers, employees, and other interested parties upon corporate financial returns. Our discussion has relevance to all parties interested in influencing corporate actions that affect the environment." By Donald P. Cram, on March 27, 2000 Source: http://web.mit.edu/doncram/www/environmental/envir-fin-literature.html b) An Investigation of the Perceived Financial Performance "This paper is primarily based on Rogers’ diffusion of innovations theory and Auger’s empirical study. An empirical research study was conducted to investigate the perceived financial performance of commercial printing firms for conducting business-to- customer (B2C) activities using Web technology. Financial performance was measured using four financial indicators: sales, profits, costs, and return-on-investment (ROI). The diffusion of innovations theory states that an innovation brings changes to a company.
  • 31.
    25 Web technology isan innovation that affects company’s performance. This paper investigates the effect of Web technology on commercial printing firms’ financial performance." Journal of Industrial Technology • Volume 19, Number 2 • February 2003 to April 2003 Page2, by Dr. Devang P. Mehta Source: http://72.14.235.132/search?q=cache:EIGjtsUJQeEJ:www.nait.org/jit/Art icles/mehta011603.pdf+review+of+literature+on+financial+performance&hl=en&ct =clnk&cd=2 c) Strategic and Financial Performance Implications of Global Sourcing Strategy: A Contingency Analysis "Using a contingency model of global sourcing strategy, this study investigated the moderating effects of sourcing-related factors on the relationship between sourcing strategy and a product's strategic and financial performance. The results lent some support to the contingency model of global sourcing strategy in that product innovation, process innovation and asset specificity were significant moderator variables for financial, but not strategic, performance. However, the results provided no support for bargaining power of suppliers and transaction frequency as moderator variables. In other words, in achieving high financial performance for a product, whether a particular sourcing strategy should be used for a particular product depended on the levels of product innovation, process innovation and asset specificity." Journal of International Business Studies (1995), Vol 26, Page 181–202, By Janet Y. Murray, Masaaki Kotabe & Albert R. Wildt Source:http://www.palgrave-journals.com/jibs/journal/v26/n1/abs/8490171a.htm d). Implications for financial performance and corporate social responsibility "We investigate whether CEO implicit motives predict corporate social performance and financial performance. Using longitudinal data on 258 CEOs from 118 firms, and controlling for country and industry effects, we found that motives significant predicted both financial performance (Tobin's Q and the CAPM) and social responsibility. In general, need for power and responsibility disposition were positively predictive whereas need for achievement and affiliation were negatively predictive of
  • 32.
    26 outcomes. Contrary toprevious theorizing, corporate social responsibility had no link to financial performance. Our findings suggest that executive characteristics have important consequences for the top level outcomes. Implications for financial performance and corporate social responsibility, by Philippe Jacquart, Catherine Ramus & John Antonakis, on May 23, 2004. Source: http://www1.icp2008.org/guest/AbstractView?ABSID=10821 e) Financial statement analysis: A data envelopment analysis approach "Ratio analysis is a commonly used analytical tool for verifying the performance of a firm. While ratios are easy to compute, which in part explains their wide appeal, their interpretation is problematic, especially when two or more ratios provide conflicting signals. Indeed, ratio analysis is often criticized on the grounds of subjectivity, that is the analyst must pick and choose ratios in order to assess the overall performance of a firm. In this paper we demonstrate that Data Envelopment Analysis (DEA) can augment the traditional ratio analysis. DEA can provide a consistent and reliable measure of managerial or operational efficiency of a firm. We test the null hypothesis that there is no relationship between DEA and traditional accounting ratios as measures of performance of a firm. Our results reject the null hypothesis indicating that DEA can provide information to analysts that is additional to that provided by traditional ratio analysis. We also apply DEA to the oil and gas industry to demonstrate how financial analysts can employ DEA as a complement to ratio analysis Journal of the Operational Research Society (2003) Vol-54,Pages 48–58, By E H Feroz Source:http://www.palgrave-journals.com/jors/journal/v54/n1/abs/2601475a.html
  • 33.
  • 34.
    28 RESEARCH METHODOLOGY CHAPTER-II RESEARCH METHODOLOGY 2.1Research Research can be defined as the search for knowledge or any systematic investigation to establish facts. The primary purpose for applied research (as opposed to basic research) is discovering, interpreting, and the development of methods and systems
  • 35.
    29 for the advancementof human knowledge on a wide variety of scientific matters of our world and the universe. According to Clifford woody research comprises defining and redefining problems, formulating hypothesis or suggested solutions; collecting, organising and evaluating data; making deductions and reaching conclusions; and at the last carefully testing the conclusions to determine whether they fit the formulating hypothesis. 2.2 Research Methodology Research is a diligent and systematic inquiry or investigation into a subject in order to discover or revise facts, theories, applications, etc... Methodology is the system of methods followed by a particular discipline. Thus Research methodology is the way how we conduct our research. 2.3 Research problem The research problem in this study is to analyse the financial performance of the organization.. 2.4 Research design: The descriptive form of research method is adopted for study. The major purpose of descriptive research is description of state of affairs of the institution as it exists at present. The nature and characteristics of the financial statements of CEE VEE PVT LTD have been described in this study. 2.5 Nature of data: The data required for the study has been collected from secondary source .The relevant information were taken from annual reports, journals and internet. 2.6 Methods of data collection
  • 36.
    30 This study isbased on the annual report of CEE VEE Foot wears pvt Ltd. Hence the information related to, profitability, short term and long term solvency and turnover were very much required for attaining the objectives of the present study. In order to fulfill the objectives of the study the data has been collected from both- • Primary Data • Secondary Data a) Primary Data To generate primary data for the analysis, direct personal interview and discussion was made with company assistant manager of finance, accountants and other officials. The data collected from the interview are coordinated and analyzed in an integrated fashion throughout the dissertation. b) Secondary Data For gathering secondary data various other source were used, they are- • Different accounting records of the company. • Magazines and journals • Internets and other publication 2.7 Tools applied: To have a meaningful analysis and interpretation of various data collected, the following tools were made for this study.  Ratio analysis  Common-size statement  Comparative statement  Trend analysis
  • 37.
  • 38.
    32 Ratio analysis isa widely used tool of financial analysis. The term ratio in it refers to the relationship expressed in mathematical terms between two individual figures or group of figures connected with each other in some logical manner and are selected from financial statements of the concern. The ratio analysis is based on the fact that a single accounting figure by it self may not communicate any meaningful information but when expressed as a relative to some other figure, it may definitely provide some significant information the relationship between two or more accounting figure/groups is called a financial ratio helps to express the relationship between two accounting figures in such a way that users can draw conclusions about the performance, strengths and weakness of a firm. Classification of ratios: A) Liquidity ratios B) Leverage ratios C) Activity ratios D) Profitability rati0 3.1) Liquidity ratios
  • 39.
    33 These ratios portraythe capacity of the business unit to meet its short term obligation from its short-term resources (e.g.) current ratio, quick ratio. 3.1.1) Current ratio: Current ratio may be defined as the relation ship between current assets and current liabilities it is the most common ratio for measuring liquidity. It is calculated by dividing current assets and current liabilities. Current assets are those, the amount of which can be realized with in a period of one year. Current liabilities are those amounts which are payable with in a period of one year. Current assets Current assets = ------------------------- Current liabilities TABLE -3.1.1 CURRENT RATIO Interpretation Year Current asset(Rs) Current liabilities(Rs) Ratio 2005-2006 13,879,890.78 5,925,850 2.35 2006-2007 26,277,693 11,344,762.12 2.31 2007-2008 33,638,118.16 19,172,404.12 1.75 2008-2009 31,883,563.24 25,862,450.68 1.42 2009-2010 32,188,509.64 22,699,554.60 1.23
  • 40.
    34 The above tableshows that the current ratio in the year 2005-06 was 2.35 and then it decreases to 2.16 in the year 2006-07, further move downwards to 1.75 and in the year 2007-08 it slashed down to 1.42 and finally in the year 2007-08 it again decreases to 1.23. The normal current ratio is 2:1. The above table shows current ratio is more than 2% in all the first two years. But in the last three years the current ratio is lower than the normal. This shows that the company is not enjoying credit worthiness. CHART-3.1.1 CURRENT RATIO 0 0.5 1 1.5 2 2.5 2005-06 2006-07 2007-08 2008-09 2009-10 Current ratio 3.1.2) LIQUID RATIO:
  • 41.
    35 The term ‘liquidity’refers to the ability of a firm to pay its short-term obligation as and when they become due. The term quick assets or liquid assets refers current assets which can be converted into cash immediately it comprises all current assets except stock and prepaid expenses it is determined by dividing quick assets by quick liabilities. Liquid assets Liquid ratio = ------------------------- Liquid liabilities TABLE-3.1.2 LIQUID RATIO: Year Liquid assets(Rs) Liquid liabilities(Rs) Ratio 2005-2006 11,586,553.78 5,925,850 1.96 2006-2007 24,243159.78 11,344,762.12 2.13 2007-2008 30,560,618.16 19,172,404.12 1.6 2008-2009 30,046,138.24 25,862,450.68 1.16 2009-2010 29,431,698.64 22,699,554.60 1.3
  • 42.
    36 Interpretation : The abovetable and shows the liquid ratio during the study period except. In all the year the ratio is more than the normal (i.e.) 1:1.It was 1.96 in the year 2005-06 and reached the highest in 2006-07 to 2.13 and then came down to 1.13 in the year 2008- 09.Hence the firm is controlling its stock position because there linear relationship between current ratio and liquid ratio CHART-3.1.2 LIQUID RATIO: 0 0.5 1 1.5 2 2.5 2005-06 2006-07 2007-08 2008-09 2009-10 Liquid Ratio .
  • 43.
    37 3.1.3) ABSOLUTE LIQUIDITYRATIO: Absolute liquid assets include cash, bank, and marketable securities. This ratio obtained by dividing cash and bank and marketable securities by current liabilities. Cash + bank +marketable securities Absolute liquidity ratio = ---------------------------------------------- Current liabilities TABLE-3.1.3 ABSOLUTE LIQUID RATIO: Interpretation: Year Cash and securities(Rs) Current liabilities(Rs0 Ratio 2005-2006 88,887.75 5,925,850 0.02 2006-2007 2,26,895 11,344,762.12 0.02 2007-2008 5,75,172 19,172,404.12 0.03 2008-2019 5,17,249 25,862,450.68 0.02 2009-2010 1,134,977.7 22,699,554.64 0.05
  • 44.
    38 The above tableshows the absolute ratio for the study period 2005-06 to 2009-10. There is fluctuation in the absolute ratio. It was 0.02 in the year 2005-06&2006-07 In 2007-08 and it was 0.03 and it reaches .05 in the year 2009-10 CHART-3.1.3 ABSOLUTE LIQUID RATIO: 0 0.005 0.01 0.015 0.02 0.025 0.03 0.035 0.04 0.045 0.05 2005-06 2006-07 2007-08 2008-09 2009-10 Absolute Ratio 3.2 LEVERAGE RATIOS
  • 45.
    39 Many financial analysesare interested in the relative use of debt and equity in the firm. The term ‘solvency’ refers to the ability of a concern to meet its long-term obligation. Accordingly, long-term solvency ratios indicate a firm’s ability to meet the fixed interest and costs and repayment schedules associated with its long-term borrowings. (E.g.) debt equity ratio, proprietary ratio, etc…. 3.2.1 DEBT EQUITY RATIO: It expresses the relationship between the external equities and internal equities or the relationship between borrowed funds and ‘owners’ capital. It is a popular measure of the long-term financial solvency of a firm. This relationship is shown by the debt equity ratio. This ratio indicates the relative proportion of dept and equity in financing the assets of a firm. This ratio is computed by dividing the total debt of the firm by its equity (i.e.) net worth. Outsider’s funds Debt equity ratio = ------------------------------ Proprietor’s funds TABLE-3.2.1 DEBT EQUITY RATIO: Interpretation and Analysis: Year Outsider’s funds(Rs) Proprietor’s funds(Rs) Ratio 2005-2006 13950857 4958937.66 2.8 2006-2007 19996093 5674125.6 3.52 2007-2008 17253752.1 8814690,76 1.95 2008-2009 11956999.29 6847858.28 1.74 2009-2010 14851203.7 6218534.14 2.38
  • 46.
    40 The above tableshows the debt equity relationship of the company during the study period. It was 2.38 in the 2005-06and then reached its highest in the next year3.52 and from there it began to slope downwards and in the year 2009-10 it again move upwards to 2.38 in the year 2009-10 In all the years the equity is less when compared with borrowings. Hence the company is not maintaining its debt position CHART-3.2.1 DEBT EQUITY RATIO: 0 0.5 1 1.5 2 2.5 3 3.5 4 2005- 06 2006- 07 2007- 08 2008- 09 2009- 10 Debt Equity Ratio . 3.2.2 PROPRIETARY RATIO:
  • 47.
    41 Proprietary ratio relatesto the proprietors funds to total assets. It reveals the owners contribution to the total value of assets. This ratio shows the long-time solvency of the business it is calculated by dividing proprietor’s funds by the total tangible assets. Proprietor’s funds Proprietary ratio = --------------------------- Total tangible assets TABLE-3.2.2 PROPRIETARY RATIO Interpretation: Year Proprietor’s funds(Rs) Total assets(Rs) Ratio 2005-2006 4,958,937.66 18,909,794.78 0.26 2006-2007 5,674,125.66 25,670,218.66 0.22 2007-2008 8,814,690.76 26,068,448.86 0.33 2008-2009 6,847,858.28 18,804,857.57 0.36 2009-2010 6,218,534.14 21,069,737.84 0.30
  • 48.
    42 The above tableshows the proprietary ratio during the study period. In all the years the owner's contribution to the total assets was not appropriate and they maintain their share in the company's assets. In all the years the proprietor's contribution in to the total assets is less than 50% CHART-3.2.2 PROPRIETARY RATIO 0 0.1 0.2 0.3 0.4 0.5 0.6 0.7 0.8 2005- 06 2006- 07 2007- 08 2008- 09 2009- 10 Proprietary Ratio 3.3 ACTIVITY RATIOS:
  • 49.
    43 These ratios evaluatethe use of the total resources of the business concern along with the use of the components of total assets. They are intended to measure the effectiveness of the assets management the efficiency with which the assts are used would be reflected in the speed and rapidity with which the assets are converted into sales. The greater the rate of turnover, the more efficient the management would be (E.g.) stock turnover ratio, fixed assets turnover ratios etc…. 3.3.1 STOCK TURNOVER RATIO: This ratio indicates whether investment is inventory is efficiently used or not it explains whether investment in inventories in with in proper limits or not. It also measures the effectiveness of the firms’ sales efforts the ratio is calculated as follows. Cost of goods sold Stock turnover ratio = ----------------------------- Average stock Opening Stock + Closing Stock Average stock = ----------------------------------------- 2 TABLE-3.3.1 STOCK TURNOVER RATIO: Year Cost of goods sold(Rs) Average stock(Rs) Ratio 2005-2006 23,590,125.12 2896130 8.14 2006-2007 34,579,881 2,163,930.5 15.98 2007-2008 38,256,374 2,556,012 14.96 2008-2009 66,238,872.02 4,673,236 14.17 2009-2010 47,477,950.98 3,567,604 13.30
  • 50.
    44 Interpretation: The above tableand diagram shows the relationship between costs of goods sold and average stock. During the year 2006-07 it is 15.98% which shows higher position of cost of goods sold. In the years of study it is shown above that the cost of goods sold are almost 15-16times of the average stock. But at the same time during 2005-06 it is only 8.14 which shows that more stock was remaining in the company CHART-3.3.1 STOCK TURNOVER RATIO: 0 2 4 6 8 10 12 14 16 2005- 06 2006- 07 2007- 08 2008- 09 2009- 10 Stock Turnover Ratio .. 3.3.2 FIXED ASSETS TURNOVER RATIO:
  • 51.
    45 The ratio indicatesthe extent to which the investments in fixed assets contribute towards sales. If compared with a pervious year. It indicates whether the investment infixed assets has been judicious or not the ratio is calculated as follows. Net sales Fixed assets turnover ratio = ------------------- Fixed assets TABLE-3.3.2 FIXED ASSET TURNOVER RATIO: Interpretation: The above table shows the relationship between the fixed assets and sales. The sale is2.81 times more than the fixed assets 2005-06 and in 2006-07 it increases into 4 Year Net sales(Rs) Fixed assets(Rs) Ratio 2005-2006 30,419,045 10,818,040 2.81 2006-2007 40,743,308 10,437,346 3.90 2007-2008 50,283,776.88 11,340,101.82 4.43 2008-2009 73,789273.14 12,005,171.01 6.14 2009-2010 53,808,158.92 10,700,453.79 5.03
  • 52.
    46 times. It ismore than 4 times during 2007-08 . It is more than 6 times during 2008-09 and more than 5 times during the period of 2009-10. It can be observed that in the year 2008-09 the fixed assets value increased a lot and which shows that there is an additions made to the fixed assets, similarly the sales was also increased from 50282776.88 (2008- 09) to 73789273.14 (2006-07). CHART-3.3.2 FIXED ASSET TURNOVER RATIO: 0 1 2 3 4 5 6 7 2005- 06 2006- 07 2007- 08 20098- 09 2009- 10 Fixed Assets Turnover Ratio 3.3.3 WORKING CAPITAL TURNOVER RATIO:
  • 53.
    47 Working capital turnoverratio indicates the velocity of the utilization of net working capital. This ratio indicates the number of times the working capital is turned over in the course of a year. It is a good measure over –trading and under-trading. Net sales Working capital turnover ratio = ---------------------------- Net working capital TABLE-3.3.3. WORKING CAPITAL TURNOVER RATIO: Interpretation: Year Net sales(Rs) Net working capital9Rs) Ratio 2005-2006 30,419,045 7,954,040.78 3.82 2006-2007 40,743,308 14,932,931.66 2.72 2007-2008 50,283,776.88 14,465,714.04 3.48 2008-2009 73,789,273.14 6,021,112.56 12.26 2009-2010 53,808,158.92 9,488,955.04 5.68
  • 54.
    48 The above tableshows the relationship between net working capital and net sales. During the years the sales is 2 to 12 times more than the working capital. It was 3.82 in the year 2005-06 and as there was more working capital the ratio sloped downwards and reached 2.72 in the year 2006-07. As the sales increased and working capital decreased the ratio now moved up to 12.26 times and in the year 2008-09 as the sales slashed to 40% of the previous year the ratio again decreased. CHART-3.3.3 WORKING CAPITAL TURNOVER RATIO 0 2 4 6 8 10 12 14 2005-06 2006-07 2007-08 2008-09 2009-10 WC T/o Ratio 3.3.4 TOTAL ASSETS TURNOVER RATIO:
  • 55.
    49 This ratio isan indicator of how the resources of the organization utilized for increasing the turnover. It shows the ratio between the total assets and the net sales of the company. From this ratio one can understand how the assets are performing and being utilized in achieving the objectives of the company. Total assets Total assets turnover ratio = ------------------- Net assets TABLE-3.3.4 TOTAL ASSETS TURNOVER RATIO: Interpretation: Year Total assets(Rs) Net sales(Rs) Ratio 2005-2006 18,909,794.78 30,419,045 0.62 2006-2007 25,670,218.66 40,743,308 0.63 2007-2008 26,068,442.86 50,283,776.88 0.52 2008-2009 18,804,857.57 73,789,273.14 0.25 2009-2010 21,069,737.84 53,808,158.92 0.39
  • 56.
    50 The above tableshows the relationship between the total assets to net sales. The relationship between sales to total assets is high. The ratio decreased from 0.62 (2005-06) to 0.25 (2008-09) and then it was again decreasing and reached to again 0.39 in the year 2009-10. and raised to 0.81 in the year 2007-08 due to the heavy fall in the sales. Thus the company's sales were almost directly disproportionate in the first three years of the study and then started to perform well CHART-3.3.4 TOTAL ASSETS TURNOVER RATIO 0 0.1 0.2 0.3 0.4 0.5 0.6 0.7 2005-06 2006-07 2007-08 2008-09 2009-10 Total assets T/o Ratio . 3.3.5 CAPITAL TURNOVER RATIO:
  • 57.
    51 This is aratio which shows how much sales are entertained from the capital. It shows how the sales are attracted from the Proprietor's Fund. Sales Capital turnover ratio = ----------------------- Proprietor’s fund TABLE-3.3.5 CAPITAL TURNOVER RATIO: Interpretation: Year Sales Proprietor’s funds Ratio 2005-2006 30,419,045 4,958,937.66 6.13 2006-2007 40,743,308 5,674,125.66 7.18 2007-2008 50,283,775.88 8,814,690.76 5.70 2008-2009 73,789,273.14 6,847,858.28 10.8 2009-2010 53,808,158.92 6,218,534.14 8.65
  • 58.
    52 The above tableshows the relationship between the sales and proprietors funds. In the year 2005-06 the ratio 6.13 and it was increasing and reached 7.18 in the year 2006-07 and then it was decreased into 5.70 in 2007-08 and it again increasing and reached its highest 10.8 in the year 2008-09. In the final year i.e. 2009-10 it was 8.65. The sales are in between 5.7 and 10.8 times more than the proprietor's funds. It shows the firms is maintaining the better utilization of own fund CHART-3.3.5 CAPITAL TURNOVER RATIO 0 2 4 6 8 10 12 2005-06 2006-07 2007-08 2008-09 2009-10 2005-06 2006-07 2007-08 2008-09 2009-10 . 3.3.6 RETURN ON TOTAL ASSETS
  • 59.
    53 Profitability can bemeasured in terms of relationship between net profit and total assets. It measures the profitability of investment. The overall profitability can be known by applying this ratio. Net profit Return on total assets = ----------------------------- x100 Total assets TABLE-3.3.6 RETURN ON TOTAL ASSETS RATIO Interpretation: Year Net profit(Rs) Total assets(Rs) Ratio 2005-2006 2,054,342.88 18,909,794.78 1.08 2006-2007 1,674,l25.66 25,670,218.66 0.065 2007-2008 4,814,690.76 106,552,413 0.184 2008-2009 2,347,858.28 98,670,106 0.124 2009-2010 1,718,534.14 91,660,973 .0815
  • 60.
    54 The above tableshows the relationship between net profit and total assets in percentage. The company earns a good return in the year 2005-06 i.e1.08 and i9 it was decreasing into 0.065 in the year 2006-07.In the year 2008-09 it again increases into 0.184 and in the final year it was 0.085. Hence there is a fluctuation their return on asset. CHART-3.3.6 RETURN ON TOTAL ASSETS RATIO 0 0.2 0.4 0.6 0.8 1 1.2 2005- 06 2006- 07 2007- 08 2008- 09 2009- 10 Return on TA Ratio 3.4 PROFITABILITY RATIOS
  • 61.
    55 The profitability ratiosof a business concern can be measured by the profitability ratios. These ratios highlight the end result of business activities by which alone the over all efficiency of a business unit can be judged, (E.g.) gross ratios, Net profit ratio. 3.4.1 GROSS PROFIT RATIO: This ratio expresses the relationship between Gross profit and sales. It indicated the efficiency of production or trading operation. A high gross profit ratio is a good management as it implies that cost of production is relatively low. Gross profit Gross profit ratio = ----------------------------------- x 100 Net sales TABLE-3.4.1 GROSS PROFIT RATIO: Interpretation: Year Gross profit(Rs) Net sales(Rs) Ratio 2005-2006 3,011,231.02 30,419,045 9.89 2006-2007 2,983,846 40,743,308 7.32 2007-2008 3,931,358 50,283,776.88 7.81 2008-2009 2,003,806 73,789,273.14 2.70 2009-2010 4,333,251 53,808,158.92 8.05
  • 62.
    56 The above tableand shows the relationship between the gross profit and net sales in percentage. During 2005-06 the gross profit position was 9.89% and in the very next year it slashed down to 7.32% and again slightly raised to 7.81% and since then it was decreasing and reached the lowest to 6.70% in the year 2008-09 and it was again increasing and finally reached 8.05 However it can be noticed that the sales also reduced to about 60% in 2008-09 when compared to other years CHART-3.4.1 GROSS PROFIT RATIO: 0 2 4 6 8 10 12 14 2005- 06 2006- 07 2007- 08 2008- 09 2009- 10 Gross Profit Ratio 3.4.2 NET PROFIT RATIO:
  • 63.
    57 Net profit ratioestablishes a relationship between net profit (after taxes) and sales. It is determined by dividing the net income after tax to the net sales for the period and measures the profit per rupee of sales. Net profit Net profit sales = ----------------- x 100 Net sales TABLE-3.4.2 NET PROFIT RATIO: Year Net profit(Rs) Net sales(Rs) Ratio 2005-2006 2,054,342.88 30,419,045 6.75 2006-2007 1,674,125.66 40,743,308 4.10 2007-2008 4,814,690.76 50,283,776.88 9.57 2008-2009 2,347,858.28 73,789,273.14 3.18 2009-2010 1,718,534.14 53,808,158.92 3.19
  • 64.
    58 Interpretation: The above tableshows the relationship between the gross profit and net sales in percentage. During 2005-06 the gross profit position was 9.89% and in the very next year it slashed down to 7.32% and again slightly raised to 7.81% and since then it was decreasing and reached the lowest to 6.70% in the year 2008-09 and it was again increasing and finally reached 8.05 However it can be noticed that the sales also reduced to about 60% in 2008-09 when compared to other years. CHART-3.4.2 NET PROFIT RATIO: 0 2 4 6 8 10 12 14 2005-06 2006-07 2007-08 2008-09 2009-10 3.4.3 EXPENSES RATIO:
  • 65.
    59 This ratio establishesthe relationship between various indirect expenses to net sales. A) ADMINISTRATIVE EXPENSES RATIO: Administrative expenses Administrative expenses ratio = ------------------------------- x 100 Sales b) SELLING &DISTRIBUTION EXPENSES RATIO: Selling &distribution expenses Selling &distribution expenses ratio = ----------------------------------------- x 100 Sales TABLE-3.4.3 EXPENSES RATIO: Administration expenses + selling expenses Expenses ratio = _______________________________________ x 100 Sales Interpretation: Year Administration& Selling expenses(Rs) Sales(Rs) Ratio 2005-2006 1,162,910 30,419,045 3.82 2006-2007 2,178,901 40,743,308 5.34 2007-2008 2,295,306.8 50,283,776.88 4.56 2008-2009 2,275,581.2 73,789,273.14 3.08 2009-2010 3,553,033.39 53,808,158.92 6.60
  • 66.
    60 The above tableshows the relationship between the administration and selling expenses and sales. The administration and selling expenses during 2009-10 is very high when compared to previous year's %age as they were in between 3-7% of sales. . CHART-3.4.3 EXPENSE RATIO 0 1 2 3 4 5 6 7 2005- 06 2006- 07 2007- 08 2008- 09 2009- 10 Expense Ratio 3.5) Common size income statements
  • 67.
    61 TABLE-3.5.1 Common size incomestatement (2005-06 &2006-07) Inference: The common size income statement for the year 2005 to 2006 reveals the following. The sales figure increasing year after year. It increased about Rs.40,324,263. Administrative and other expenses were also increasing. The other income of the company was increased year by year. TABLE-3.5.2 Common size income statement (2006-07 & 2007-08) Particulars 2005-2006 (Rs) % 2006-200(Rs) % Income: Sales 30,419,045 92.93 40,743,308 95.06 Other income 17,626 0.053 83,067 0.19 Closing stock 2,293,337 7.006 2,034,524 4.75 Total income 32,730,008 100 42,860,899 100 Expenditure: Opening stock 3,498,923 11.3 2,293,337 5.93 Purchases 21,045,864 67.97 26,507,305 68.64 Direct expenses 2,446,415 5.05 5,367,094 11.15 Administration expenses 1,238,368 1.15 2,785,170 1.71 Selling Expenses 8,07,055 2.60 2,575,833 3.92 Depreciation 1,638,952 3.22 1,658,035 4.29 Total expenses 30,675,576 94.32 41,186,774 95.20 Net profit 2,054,342 5.68 1,674,125 4.34 Total 32,730,008 100 42,860,899 100
  • 68.
    62 Inference: The common sizeincome statement for the year 2006 to 2007 reveals the following. The sales figure increasing year after year. In the year 2006-07, cost of sales is 3.14% of the total expenditure. Administrative and other expenses are fluctuating. There is heavy increase in the net profit of the organization. The net profit hiked from 4.34% to 9.62% . The company must adopt correct pricing and control the unnecessary expenses to attain high profits. TABLE-3.5.3 Common size income statement (2007-08 & 2008-09) Particulars 2006-2007 (Rs) % 2007-2008 (Rs) % Income: Sales 40,743,308 95.06 50,283,776 94.2 Other income 83,067 0.19 2,999 0.006 Closing stock 2,034,524 4.75 3,077,500 5.76 Total income 42,860,899 100 53,364,275 100 Expenditure: Opening stock 2,293,337 5.93 2,034,524 4.06 Purchases 26,507,305 68.64 37,632,183 75.17 Direct expenses 5,367,094 11.15 3,227,328 3.14 Administration expenses 2,785,170 1.71 2,503,321 1.7 Selling Expenses 2,575,833 3.92 1,443,300 2.88 Depreciation 1,658,035 4.29 1,708,929 3.41 Total expenses 41,186,774 95.20 48,549,585 90.38 Net profit 1,674,125 4.34 4,814,690 9.62 Total 42,860,899 100 53,364,275 100
  • 69.
    63 Particulars 2007-2008 (Rs) % 2008-2009 (Rs) % Income: Sales50,283,776 94.2 73,789,273.14 94.35 Other income 2,999 0.006 36,832.42 0.05 Closing stock 3,077,500 5.76 4,378,388 5.6 Total income 53,364,275 100 78,204,493.56 100 Expenditure: Opening stock 2,034,524 4.06 3,077,500 4.38 Purchases 37,632,183 75.17 57,996,976 83.2 Direct expenses 3,227,328 3.14 5,154,960 3.56 Administration expenses 2,503,321 1.7 4,484,750 1.38 Selling Expenses 1,443,300 2.88 3,289,854 1.82 Depreciation 1,708,929 3.41 1,852,595 2.54 Total expenses 48,549,585 90.8 75,856,635 96.88 Net profit 4,814,690 9.62 2,347,858 3.12 Total 53,364,275 100 78,204,493 100
  • 70.
    64 Inference: The common sizeincome statement for the year 2008 to 2009 reveals the following. The sales figure increased from Rs50,283776 to Rs.73,789,274. In the year 2006-07 cost of sales is 3.56%. There is heavy increase in the other incomes. In the year 2006-07 income decreased from Rs.4,814,690 to Rs.2,347,858. TABLE-3.5.4 Common size income statement (2008-09 & 2009-10) Particulars 2008-2009 (Rs) % 2009-2010 (Rs) % Income: Sales 73,789,273.14 94.35 53,808,158 94.75 Other income 36,832.42 0.05 2,26,236 0.39 Closing stock 4,378,388 5.6 2,756,820 4.86 Total income 78,204,493.56 100 56,791,215 100 Expenditure: Opening stock 3,077,500 4.38 4,378,388 7.6 Purchases 57,996,976 83.2 46,609,738 80.9 Direct expenses 5,154,960 3.56 1,813,337 2.36 Administration expenses 4,484,750 1.38 2,952,237 4.34 Selling Expenses 3,289,854 1.82 1,050,790 6.55 Depreciation 1,852,595 2.54 1,705,259 1.82 Total expenses 75,856,635 96.88 58,509,749 102.98 Net profit 2,347,858 3.12 (1,718,534.14) -(2.98) Total 78,204,493 100 56,791215 100
  • 71.
    65 Inference: The common sizeincome statement for the year 2009 to 2010 reveals the following. The sales figure slashed down very. It decreased from Rs.73,789,273 to Rs.53,808,158 which is almost 27.08% of the previous year. In the year 2009-10 cost of sales is 2.36%. However in Administrative and other expenses there was a negligible change due to which organization attained a loss of Rs.629324. 3.6 Common size balance sheet TABLE-3.6.1 Common size balance sheet (2005-06 &2006-07)
  • 72.
    66 Inference: The common sizebalance sheet for the year 2006-2007 is as follows: Share capital of the company is decreasing in %age of the net worth. In 2005-2006 in 21.16% to 15.58%.Secured loan for the company has decreasing trend. It decreases 73.4 to 72.26% of the net worth of the company. Fixed asset of the company is decreasing in this year from 57.21% to 40.66%. Current liability and provisions is increasing 31.34% to 43.2 %. TABLE-3.6.2 Common size balance sheet (2006-07 & 2007-08) Particulars 2005-2006 (Rs) % 2006-2007 (Rs) % Sources of funds: Share capital 4,000,000 21.16 4,000,000 15.58 Reserves & surplus 9,58,937 5.07 1,674,125 6.52 Loan funds: Secured loan 13,880,857 73.4 18,551,093 72.26 Unsecured loan 70000 0.37 1,445,000 5.64 Total 18,909,794 100 25,670,218 100 Application of funds: Fixed assets 10,818,040 57.21 10,437,346 40.66 Current assets & Loan and advances Cash & bank 2,220,782 11.74 3,941,653 15.32 Sundry debtors 8,327,934 44.04 16,292,170 63.47 Advances and deposits 3,331,174 17.61 6,043,870 23.54 Investments ----- Other assets Total 13,879,890 73.39 26,277,693 102.37 current liabilities & provisions: Less: Current liabilities 5,812,065 30.74 10,914,106 42.52 Expenses for provisions 1,13,785 0.6 4,30,656 1.68 Net Current assets 7,954,040 42.69 11,344,762 59.44 Total 18,909,794 100 25,670,218 100
  • 73.
    67 Inference: The common sizebalance sheet for the year 2007 to 2008 is as follows: Share capital of the company has increased from 15.58% to 15.34. Secured loan for the company has decreasing trend. It increases 72.26% to 60.12. Fixed asset of the company is increasing in this year of 40.66% to 43.5%. Current liability and a provision is increasing 43.2% to73.53 %. TABLE-3.6.3 Common size balance sheet (2007-08 & 2008-09) Particulars 2006-2007 (Rs) % 2007-2008 (Rs) % Sources of funds: Share capital 4,000,000 15.58 4,000,000 15.34 Reserves & surplus 1,674,125 6.52 4,814,690 18.47 Loan funds: Secured loan 18,551,093 72.26 15,671,252 60.12 Unsecured loan 1,445,000 5.64 1,582,500 6.07 Total 25,670,218 100 106,552,413 100 Application of funds: Fixed assets 10,437,346 40.66 11,340,102 43.5 Current assets & Loan and advances Cash & bank 3,941,653 15.36 4,372,956 16.77 Sundry debtors 16,292,170 63.47 21,192,014 81.29 Advances and deposits 6,043,870 23.54 8,073,148 30.97 Investments Other assets Total 26,277,693 102.37 33,638,118 129.03 current liabilities & provisions: Less: Current liabilities 10,914,106 42.52 16,984,534 65.15 Expenses for provisions 4,30,656 1.68 2,187,870 8.39 Net Current assets 14,932,931 59.44 14,465,714 56.5 Total 25,670,218 100 26,068,442 100
  • 74.
    68 Inference: The common sizebalance sheet for the year 2008 to 2009 is as follows: Share capital figure remained constant however their %age to net worth has increased from 15.34% to 18.98%. Some amount of the secured loans has been paid off. Fixed asset of the company has been increased and there share is 56.96% to the total assets in the year 2008-09. Current liability and a provision is increasing 73.44% to 107.73%. It can be noticed that the fixed assets are purchased on credit from the creditors and they both increased TABLE-3.6.4 Particulars 2007-2008 (Rs) % 2008-2009 (Rs) % Sources of funds: Share capital 4,000,000 15.34 4,000,000 18.98 Reserves & surplus 4,814,690 18.47 2,218,534 10.53 Loan funds: Secured loan 15,671,252 60.12 14,362,723 68.17 Unsecured loan 1,582,500 6.07 4,88,480 2.32 Total 26,068,442 100 21,069,737 100 Application of funds: Fixed assets 11,340,102 43.5 12,001,322 56.96 Current assets & Loan and advances Cash & bank 4,372,956 16.77 5,460,046 25.9 Sundry debtors 21,192,014 81.29 19,634,991 91.2 Advances and deposits 8,073,148 30.97 7,.081472 33.61 Investments Other assets 12000 0.06 Total Current Assets 33,638,118 129.03 32,188,509 150.77 current liabilities & provisions: Less: Current liabilities 16,984,534 65.15 22,597,799 107.25 Expenses for provisions 2,187,870 8.39 1,01,755 .48 Net Current assets 14,465,714 56.5 9,488,955 43.04 Total 26,068,442 100 21,069,737 100
  • 75.
    69 Common size balancesheet (2008-09 & 2009-10) Inference The common size balance sheet for the year 2009 to 2010 is as follows: Share capital figure remained constant however their %age to net worth has increased from 18.98% to21.27 %. Some amount of the secured loans has been paid off. Current liability and a provision is increased from 107.73% to 137.54% this means that a heavy amount is yet to be paid to the creditors of the fixed assets. 3.7 Comparative income statement Particulars 2008-2009 (Rs) % 2009-2010) (Rs) % Sources of funds: Share capital 4,000,000 18.98 4,000,000 21.27 Reserves & surplus 2,218,534 10.53 2,847,858 15.15 Loan funds: Secured loan 14,362,723 68.17 11,726,999 62.36 Unsecured loan 4,88,480 2.32 230,000 1.22 Total 21,069,737 100 18,804,857 100 Application of funds: Fixed assets 12,001,322 56.96 12,783,542 67.98 Current assets & Loan and advances Cash & bank 5,472,046 25.15 5,420,206 28.82 Sundry debtors 19,634,991 91.2 19,448,973 103.43 Advances and deposits 7,.081472 33.61 7,014,384 37.3 Investments Other assets Total 32,188,509 150.77 31,883,563 169.55 current liabilities & provisions: Less: Current liabilities 22,597,799 107.25 25,321,640 134.67 Expenses for provisions 1,01,755 0.48 540,810 2.87 Net Current assets 9,488,955 43.04 6,021,112 32.02 Total 21,069,737 100 18,804,857 100s
  • 76.
    70 TABLE-3.7.1 Comparative income statement(2005-06 & 2006-07) Inference: The sales level has increased 2006 to 2007 in 33.94%.Other income of the company has increased in 371.27%. The stock differential of the firm in the year of 2006 to 2007 is decreased to 11.28%.The operating expenses has an increasing trend in both administration and selling and the net profit of the year is decreased by 18.51% Particulars 2005-2006 (Rs) 2006-2007 (Rs) INC/DCE % Income: Sales 30,419,045 40,743,308 10324,263.00 33.94 Other income 17,626 83,067 65441.00 371.27 Closing stock 2,293,337 2,034,524 (258,813.00) (11.28) Total income 32,730,008 42,860,899 10,130,891.00 30.95 Expenditure: Opening stock 3,498,923 2,293,337 (1,205,586.00) (34.45) Purchases 21,045,864 26,507,305 5,461,441.00 25.95 Direct expenses 2,446,415 5,367,094 2,920,679.00 119.38 Administration expenses 1,238,368 2,785,170 1,546802.00 124.9 Selling Expenses 8,07,055 2,575,833 1,768778.00 219.16 Depreciation 1,638,952 1,658,035 (19,083.00) (1.16) Total expenses 30,675,576 41,186,774 10,511,198.00 34.26 Net profit /Loss 2,054,342 1,674,125 (380,217.00) (18.51) Total 32,730,008 42,860,899 10,130,891.00 30.95
  • 77.
    71 TABLE-3.7.1 Comparative income statement(2006-07 & 2007-08) Inference: The sales level has increased 2007 to 2008 in 23.42% .Other income of the company has decreased in 96.39%. The stock differential of the firm in the year of 2007 to 2008 is increased which is almost 51.26% of the last year. The operating expenses were decreased by 39.87% in both administration and selling and the net profit of the year is increased. TABLE-3.7.3 Particulars 2006-2007(Rs) 2007-2008(Rs) INC /DEC % Income: Sales 40,743,308 50,283,776 9,540468.00 23.42 Other income 83,067 2,999 (80068.00) (96.39) Closing stock 2,034,524 3,077,500 1042976.00 51.26 Total income 42,860,899 53,364,275 10503376.00 24.5 Expenditure: Opening stock 2,293,337 2,034,524 (258813.00) (11.28) Purchases 26,507,305 37,632,183 11124878.00 41.97 Direct expenses 5,367,094 3,227,328 (2139766.00) (39.87) Administration expenses 2,785,170 2,503,321 ( 281849.00) (10.12) Selling Expenses 2,575,833 1,443,300 (1132333.00) (4.35) Depreciation 1,658,035 1,708,929 50894.00 3.07 Total expenses 41,186,774 48,549,585 7362811.00 17.88 Net profit /Loss 1,674,125 4,814,690 3140565.00 187.6 Total 42,860,899 53,364,275 10503376.00 24.5
  • 78.
    72 Comparative income statement(2007-08 & 2008-09) Inference The sales level has increased 2008 to 2009 in 25.68% .Other income of the company has decreased by 50.36%. The stock differential of the firm in the year of 2008 to 2009 is increased. The operating expenses are decreased in 59.73% in both administration and selling and the net profit of the year is decreased. Particulars 2007-2008(Rs) 2008- 2009(Rs) INC /DEC % Income: Sales 50,283,776 73,789,273.1 4 46019549.00 25.68 Other income 2,999 36,832.42 (10053611.00) (50.36) Closing stock 3,077,500 4,378,388 13155370.00 187.35 Total income 53,364,275 78,204,493.5 6 49121308.00 23.82 Expenditure: Opening stock 2,034,524 3,077,500 1042976.00 51.26 Purchases 37,632,183 57,996,976 20364793.00 54.11 Direct expenses 3,227,328 5,154,960 1927632.00 59.73 Administration expenses 2,503,321 4,484,750 19,814,29.00 79.15 Selling Expenses 1,443,300 3,289,854 1846554 127.93 Depreciation 1,708,929 1,852,595 143666.00 8.41 Total expenses 48,549,585 75,856,635 27307050.00 56.25 Net profit /Loss 4,814,690 2,347,858 (2466832.00) (51.23) Total 53,364,275 78,204,493 49121308.00 23.82
  • 79.
    73 TABLE-3.7.4 Comparative income statement(2008-09 & 2009-10) Particulars 2008- 2009(Rs) 2009- 2010(Rs) INC / DEC % Income: Sales 73,789,273 53,808,158 (19981115.00) (27.08) Other income 36,832 2,26,236 189404.00 514.24 Closing stock 4,378,388 2,756,820 (1621568.00) (37.03) Total income 78,204,493 56,791,215 (21413278.00) (27.38) Expenditure: Opening stock 3,077,500 4,378,388 1300888.00 42.27 Purchases 57,996,976 46,609,738 (11387238.00) (19.63) Direct expenses 5,154,960 1,813,337 (3341623.00) (64.82) Administration expenses 4,484,750 2,952,237 (1532513.00) (34.17) Selling Expenses 3,289,854 1,050,790 (2239064.00) (68.06) Depreciation 1,852,595 1,705,259 (147336.00) (7.95) Total expenses 75,856,635 58,509,749 (17346886.00) (22.87) Net profit /Loss 2,347,858 (1,718,534.14 ) (629324.00) (26.8) Total 78,204,493 56,791215 (21413278.00) (27.38) Inference: The sales level has slashed down by 27.08% when compared to last year sales .Other income of the company has increased. The stock differential of the firm in the year of 2009 to 2010 also decreased. The operating expense is decreased in 64.82% in both administration and selling. The company incurred a net loss of Rs.6,29,324. 3.8 Comparative balance sheet
  • 80.
    74 TABLE-3.8.1 Comparative balance sheet(2005-06 & 2006-07) Particulars 2005-2006 (Rs) 2006-2007(Rs) INC / DEC % Sources of funds: Share capital 4,000,000 4,000,000 0 0 Reserves & surplus 9,58,937 1,674,125 7,151,188 74.58 Loan funds: Secured loan 13,880,857 18,551,093 4,670,236 33.65 Unsecured loan 70000 1,445,000 1,375,000 1964.28 Total 18,909,794 25,670,218 6,760,424 35.75 Application of funds: Fixed assets 10,818,040 10,437,346 -380694 -3.5 Current assets & Loan and advances Cash & bank 2,220,782 3,941,653 1,720,871 77.49 Sundry debtors 8,327,934 16,292,170 7,964,236 95.63 Advances and deposits 3,331,174 6,043,870 2,712,696 81.43 Investments Other assets Total 13,879,890 26,277,693 12,397,803 89.32 current liabilities & provisions: Less: Current liabilities 5,812,065 10,914,106 5,102,041 87.8 Expenses for provisions 1,13,785 4,30,656 316,871 278.5 Net Current assets 7,954,040 11,344,762 3,390,722 42.63 Total 18,909,794 25,670,218 6,760,424 35.75 Inference: The comparative balance sheet of the year 2006-2007 is as follows The share capital of the company has remain constant in the year of 2006-07 . The profit of the company has increased the reserves and surplus by 74.58% The fixed assets of the company has decreased in 3.5%. The cash position of the company has fluctuating increase or decreases. The current liability and provisions of the company is increasing year after year.
  • 81.
    75 TABLE-3.8.2 Comparative balance sheet(2006-07 & 2007-08) Inference: The comparative balance sheet of the year 2007 to 2008 is as follows. The share capital of the company has remain constant. The secured loan of the company has decreased in this year by 15.52% .The fixed assets of the company has increased. The cash position of the company has fluctuating increase or decreases. The current liability and provisions of the company is fluctuating year after year. Particulars 2006-2007(Rs) 2007-2008(Rs) INC / DEC % Sources of funds: Share capital 4,000,000 4,000,000 0 0 Reserves & surplus 1,674,125 4,814,690 3,140,565 187.6 Loan funds: Secured loan 18,551,093 15,671,252 -2,879,841 -15.52 Unsecured loan 1,445,000 1,582,500 1,37,500 9.51 Total 25,670,218 26,068,442 3,98,224 1.55 Application of funds: Fixed assets 10,437,346 11,340,102 9,02,756 8.6 Current assets & Loan and advances Cash & bank 3,941,653 4,372,956 4,31,303 10.94 Sundry debtors 16,292,170 21,192,014 4,899,844 30.07 Advances and deposits 6,043,870 8,073,148 2,029,278 33.57 Investments Other assets Total 26,277,693 33,638,118 7,360,425 28.01 current liabilities & provisions: Less: Current liabilities 10,914,106 16,984,534 6,070,428 55.62 Expenses for provisions 4,30,656 2,187,870 1,757,214 16.1 Net Current assets 11,344,762 14,465,714 3,120952 27.51 Total 25,670,218 26,068,442 3,98,224 1.55
  • 82.
    76 TABLE-3.8.3 Comparative balance sheet(2007-08 & 2008-09) Inference: The comparative balance sheet of the year 2008-2009 is as follows. The share capital of the company remains same. The secured loan of the company has decreased in this year by 8.35% .The fixed assets of the company has increased by purchasing the new assets on credit. The cash position of the company has increased . The current liability is also increasing as the fixed assets were purchased on credit and hence they both increases. Particulars 2007-2008(Rs) 2008-2009(Rs) INC / DEC % Sources of funds: Share capital 4,000,000 4,000,000 0 0.00 Reserves & surplus 4,814,690 2,218,534 -2,596,156 -53.92 Loan funds: Secured loan 15,671,252 14,362,723 -1,308,529 -8.35 Unsecured loan 1,582,500 4,88,480 -1,094,020 -69.13 Total 26,068,442 21,069,737 -4,998,705 -19.17 Application of funds: Fixed assets 11,340,102 12,001,322 6,61,220 5.83 Current assets & Loans and advances Cash & bank 4,372,956 5,472,046 1,099,090 25.13 Sundry debtors 21,192,014 19,634,991 -1,557,023 -7.34 Advances and deposits 8,073,148 7,.081472 -9,91,676 -12.28 Investments 0 0.00 Other assets Total 33,638,118 32,188,509 -1,449,609 4.31 current liabilities & provisions: Less: Current liabilities 16,984,534 22,597,799 5,613,265 33.05 Expenses for provisions 2,187,870 1,01,755 -2,086,115 -95.35 Net Current assets 14,465,714 9,488,955 -4,976,759 -34.4 Total 26,068,442 21,069,737 -4,998,705 -19.17
  • 83.
    77 TABLE-3.84 Comparative balance sheet(2008-09 & 2009-10) Inference: The comparative balance sheet of the year 2009 to 2010 is as follows. The share capital of the company remains same. The secured loan of the company has decreased in this year .The fixed assets of the company has increased. The cash position of the company has fluctuating increase or decreases. Large amount to the creditors has to be paid. Particulars 2008-2009(Rs) 2009-2010(Rs) INC / DEC % Sources of funds: Share capital 4,000,000 4,000,000 0 0.00 Reserves & surplus 2,218,534 2,847,858 6,29,324 28.36 Loan funds: Secured loan 14,362,723 11,726,999 -2,635,724 -18.35 Unsecured loan 4,88,480 230,000 -2,58,480 -52.91 Total 21,069,737 18,804,857 -2,264,880 -10.75 Application of funds: Fixed assets 12,001,322 12,783,542 -7,82,220 -6.52 Current assets & Loan and advances Cash & bank 5,472,046 5,420,206 -51840 -0.95 Sundry debtors 19,634,991 19,448,973 -1,86,018 -0.94 Advances and deposits 7,.081472 7,014,384 -67,088 -0.95 Investments Other assets Total 32,188,509 31,883,563 -3,04,946 -.095 current liabilities & provisions: Less: Current liabilities 22,597,799 25,321,640 2,723,841 12.05 Expenses for provisions 1,01,755 540,810 -4,39,055 -4.31 Net Current assets 9,488,955 6,021,112 3,467,843 -36.55 Total 21,069,737 18,804,857 -2,264,880 -10.75
  • 84.
    78 3.9 TREND ANALYSIS Table-3.9.1 TrendIncome Statement in the study period (2005-06 to 2009-10) 0 20 40 60 80 100 120 140 160 2005-06 2006-07 2007-08 2008-09 2009-10 Sales Particulars 2005-06 2006-07 2007-08 2008-09 2009-10 Trend Trend Trend Trend Trend Sales 100 133.94 123.42 125.68 72.92 Total income 100 130.95 124.5 123.82 72.62 Total expenditure 100 134.26 117.88 156.25 77.13 Net profit 100 81.49 287.6 48.77 73.2
  • 85.
  • 86.
    80 0 50 100 150 200 250 300 350 2005-06 2006-07 2007-082008-09 2009-10 Net profit 0 20 40 60 80 100 120 140 160 180 2005-06 2006-07 2007-08 2008-09 2009-10 Total expenditu re
  • 87.
    81 Inference: By taking 2005-06as base year (100%) the sales, total income, total expenditure, and net profit during the study period were analysis by taking trend as a tool. The above table shows the movement of variables during the study period. The entire variable shows the lower trend during the 2009-10.
  • 88.
    82 TABLE-3.9.2 TREND BALANCE SHEETIN THE STUDY PERIOD (2005-06 to 2009-10) Inference Trend Percentages of Balance Sheet is done by taking 100 as base for all financial years 2006 to 2010. Fixed assets have been decreased during the period 2009-10.current assets, Current liabilities and provisions were fluctuating during the study period. Therefore the balance sheet total shows an increasing trend in the figures. Particulars 2006 2007 2008 2009 2010 Trend Trend Trend Trend Trend Share capital 100 100 100 100 100 Reserves and surplus 100 174.8 287.6 46.08 71.64 Secured loans 100 133.65 84.48 91.65 81.65 Un secured loans 100 2064.28 109.51 30.87 47.09 Fixed assets 100 96.5 108.6 105.83 93.48 Debtors 100 195.63 130.07 92.66 99.5 Cash and bank balance 100 177.49 110.94 125.13 99.5 Advances and deposits 100 181.43 133.57 112.28 99.5 Current liability 100 187.8 155.62 133.05 112.05 Provisions 100 378.5 116.1 4.65 95.69
  • 89.
  • 90.
    84  The currentratio is more than 2% in the first two years. But in all other years the current ratio is slightly lower than the normal. This shows that the company is not enjoying credit worthiness.  The liquid ratio is more than the normal (i.e.) 1:1in all the study periods. Hence the firm is controlling its stock position because there is linear relationship between current ratio and liquid ratio.  The absolute ratio is almost same for all the years except in the year 2009-10  In all the years the debt equity is less, when compared with borrowings. Hence the company is not maintaining its debt position.  The proprietary ratio during the first two years is less than the 1/3. During the other sudy period is it is more than 30%  During the year 2005-06 it is only8.14% which shows lower position of cost of goods sold .But at the same time during 2009-10 it is 13.3.  The sale is almost 3 times more than the fixed assets 2005-06 and in 2006-07 and 2007-08 It is more than 4 times. During 2009-10 it is more than 5 times and reaches its highest in the year2008-09 ie6.14 times.  During all the years of study period the sales is 2 to 12 times more than the working capital.  During all the study period years the relationship between sales to total assets is high.  The sales are between 5.5 to 10.8 times more than proprietor's funds. It shows the firms is maintaining the better utilization of own funds.  The Net profit from the year 2005-06 is very less and in the year 2009-10 the company made a loss.  During 2009-10 the gross profit position is 8.05%. But in 2005-06 it was 9.89 %.and it was fluctuating more than the base year in all other years of the study period.  During 2005-06 it was 6.75% on sales and in 2006-07 it was 4.10. It reaches its highest in the year 2007-08 ie 9.57 But in the last two years it was just above3.. This means that either there is any defect in pricing the product or excess non-value added expenditures which reduces the net profit of the company. The sales of the organization are also decreasing and hence management must take care of the quality
  • 91.
    85 and market situationsinto consideration to resolve the issue so that it may bring good profits to the organization.  The administration and selling expenses during 2008-09 is very high when compared to previous year's %age as they were in between 3-5% of sales. This may also be one of the reasons to a net loss in that year.  The sales figure increasing year after year. It increased about Rs.40,324,263. Administrative and other expenses were increasing. The other income of the company was increased year by year.  Net profit has been reduced from 100% to (0.25) %.  During the first four years period the total income was higher than the total expenditure which is good for the company. But the total expenditure was high in the period 2009-10. Hence the management has to find immediate remedies to reduce it.  Share capital has been remained constant.  Sundry debtor has been fluctuating over the years. It increased during the first two years of the study period from 100% to 130.7% and then from there it decreased to 92.66% in the year 2008-09
  • 92.
  • 93.
    87 SUGGESTIONS  The company'sprofit over the last two years has been decreasing when compared to previous year and even it incurred loss in the last year. The company must increase the profit in future. The company must take steps to increase the profit level.  The Gross Profit ratio can be improved by increasing the gross profit and the factors decreasing the gross profit ratio should be thoroughly checked timely whether they are operating factors or any misleading factors.  Non-operating expense of the company is high. So the management should take necessary steps to reduce the non-operating expenses. The management should take steps to reduce the borrowed capital.  Net fixed asset of the company has increased and even though they are not utilizing the enhanced technology to increase sales. So the management should take initiative steps for the proper utilization of the resources.  The liquidity position of the company is quite satisfactory. And this must be improved further for the purpose of proper utilization of the liquid assets of the company.  The cash ratio position of the company is not satisfactory for the last five years. It is fluctuating over the years and there is no standard ration maintained. So the management should take steps to improving the cash position of the company.  The sales of the organization can be further increased by improving the quality through optimum utilization of company's resources (i.e. assets, raw materials, credit system, etc.) and that in turn will increase the overall profits of the organization..  The Management must also study the market position and it also find the demand prevailing in the market for the products and thus this will guide them to enhance their sales volume.
  • 94.
  • 95.
    89 CONCLUSION On studying thefinancial performance of Cee vee Foot wear's Pvt. Ltd for a period of five years from 2005-06 to 2009-10, the study reveals that the financial performance is better. Cee Vee foot wear's Pvt. Ltd has been able to maintain optimal cost positioning. Despite price drops in various products, the company has been able to maintain and grow its market share to make strong margins in market, contributing to the strong financial position of the company. The company was able to meet its entire requirements for capital expenditures and higher level of working capital commitment with higher volume of operations and from its operating cash flows. .
  • 96.
  • 97.
    91 Balance sheet ason 31-3-2010 Particulars Schedule Amount SOURCES OF FUNDS Share capital RESERVES AND SURPLUS P/L A/C LOANS AND FUNDS Secured loans Unsecured loans A B C 4,00,000 2,218,534 14,362,723 488,480 Total 21,069,734 APLLICATION OF FUNDS FIXED ASSETS Gross Block Less; Depreciation Net Block Differred Tax Assets Current assets ,Deposits& Advances Less:Current liabilities and provision NET CURRENT ASSETS D E F G 20,990,142.22 10,289,699 32,188,509 22,699,554 10,700,453 880,329 9,488,955 Total 21,069,734
  • 98.
  • 99.
    93  T.S Reddyand Y. Hariprasad Reddy, Financial management, New Delhi: Tata McGraw hill Publishing company Ltd., 2005, 3rd edition  M.A Sahaf Management and Accounting 4th Edition, Tata McGraw Hill Publishing Company Ltd, 5th Reprint - 2006 - New Delhi.  IM .Pandey, Financial Management 8th Edition, Vikas Publishing house Pvt Ltd, 6th Reprint -2006- New Delhi.  IM .Pandey, Working capital Management 8th Edition, Vikas Publishing house Pvt Ltd, 6th Reprint -2006- New Delhi  R.K. Sharma & S.K. Gupta, Financial Management  R.P. Rustagi, Financial Management WEBSITE: http://money.newkerala.com/company-profile-id-16020114.00.html www.hillwoodindia.com JOURNALS AND ARTICLES:  Annual Reports Of CEE VEE FOOTWEARS PVT. LTD  General Articles and Magazines Of CEE VEE FOOTWEARS PVT .LTD  Survey of Indian industry- The Hindu
  • 100.