SlideShare a Scribd company logo
1 of 18
Download to read offline
2012 AACE INTERNATIONAL TRANSACTIONS
CDR.980.1
CDR.980
Proving Engineering Productivity Loss
Dr. Tong Zhao, PE PSP and J. Mark Dungan
ABSTRACT—The measured mile/baseline method has been widely accepted to quantify labor
productivity loss, but it has not been successfully used in engineering productivity because of the
challenges in engineering productivity measurement and the determination of productivity
benchmark. This paper presents a series of procedures based on the measured mile/baseline
method to quantify engineering productivity loss from a project specific perspective. A case study
on the piping discipline in a large scale process plant project is used to illustrate the calculation.
The paper also includes a proposed approach, the two mile method, to quantify engineering
productivity loss using data for similar work, but different complexity.
2012 AACE INTERNATIONAL TRANSACTIONS
CDR.980.2
Table of Contents
Abstract............................................................................................................................... 1
List of Tables ....................................................................................................................... 3
List of Figures ...................................................................................................................... 3
List of Equations.................................................................................................................. 3
Introduction ........................................................................................................................ 4
Measured Mile/Baseline Method and its Application in Construction.............................. 5
Engineering Productivity Measurement............................................................................. 6
Measured Mile/Baseline Method to Calculate Lost Engineering Productivity .................. 8
Case Study......................................................................................................................... 10
Two Mile Method to Quantify Engineering Productivity Loss
with Complexity Difference .............................................................................................. 12
Conclusion......................................................................................................................... 16
References ........................................................................................................................ 17
2012 AACE INTERNATIONAL TRANSACTIONS
CDR.980.3
List of Tables
Table 1, Piping Productivity Data...................................................................................... 11
Table 2, Piping Design Productivity Baseline.................................................................... 11
Table 3, Piping Design Productivity Loss........................................................................... 12
List of Figures
Figure 1
Correlation between Work Hours and Number of Lines in the Baseline ......................... 13
List of Equations
Equation 1......................................................................................................................... 14
Equation 2......................................................................................................................... 14
Equation 3......................................................................................................................... 14
Equation 4......................................................................................................................... 14
Equation 5......................................................................................................................... 14
Equation 6......................................................................................................................... 14
Equation 7......................................................................................................................... 14
Equation 8......................................................................................................................... 15
Equation 9......................................................................................................................... 15
2012 AACE INTERNATIONAL TRANSACTIONS
CDR.980.4
Introduction
Proving or quantifying lost productivity is one of the most contentious and controversial areas in
construction claims and disputes. It is a task that usually involves processing data for completed
work and corresponding work hours, calculating productivity, establishing baseline, causation
study, and measuring productivity loss.
Although there may exist various methods to quantify productivity loss, the measured
mile/baseline method by far is the most widely accepted for computing lost productivity in the
construction industry. The original measured mile method determines the benchmark of the
productivity achieved on identical activities in the same project. The productivity achieved on
unimpacted sections was compared to the productivity achieved in sections where the work is
known to be impacted. Responsibility for the difference in productivity is then assigned to the
impacting party. Since it is not always possible to segregate an unimpacted area of work, the
measured mile calculation has subsequently broadened to a baseline method. The baseline method
also compares similar work activities, yet it allows for the comparison of lightly impacted areas to
more heavily impacted areas. The lightly impacted portion is defined as the baseline set and
although the baseline productivity rate may still contain lost productivity, it would allow the
claimant to measure the productivity loss in the heavily impacted areas, and assign that loss to the
responsible parties. In this paper, the authors use the broad meaning of “measured mile method,”
and do not differentiate it from the baseline method.
During the course of design and construction, changes and the ripple effect of multiple changes are
one of the most important causes for engineering productivity loss. It is usually difficult to
discretely quantify the productivity loss caused by cumulative impacts of multiple changes. Despite
wide application and acceptance in proving labor productivity loss, the measured mile/baseline
method has not been successfully applied to engineering productivity.
The challenges lie in engineering productivity measurement and the determination of project
specific productivity benchmarks. In this paper, the procedures specifically for measured
mile/baseline calculation of engineering productivity are developed and the implementation is
demonstrated by a case study, which proves that engineering productivity loss can be successfully
quantified if the proposed procedures are followed to correctly measure productivity and
determine the measured mile or baseline.
To overcome the difficulties of finding engineering work at exactly the same complexity in a
project, a broader approach, called the two mile method, is proposed to calculate engineering
productivity loss based on the data from similar areas (segments, systems, components, units …)
with different complexity by establishing a linear relationship between productivity and complexity.
This paper not only contributes to the literature on engineering productivity loss calculation, also
its practical significance is substantiated by offering viable approaches to quantify engineering
productivity loss in litigation proceedings. Although this paper only focuses on the quantification of
engineering productivity loss, the importance of cause and effect analysis, and responsibility
allocation should not be ignored.
2012 AACE INTERNATIONAL TRANSACTIONS
CDR.980.5
Productivity can be measured as the ratio between the units of work accomplished (output) and
the units of time or efforts expended (input). In the literature, two inverse definitions were used:
input/output, and output/input. In this paper, productivity is defined as the ratio of input to
output, but the choice is a matter of personal preference.
Measured Mile/Baseline Method and its Application in Construction
Although the measured mile method has been widely used since 1986, the core fundamental of
measured mile analysis originated much before that. In 1951, the measured mile method was
successfully used in Maryland Sanitary Mfg. Co. v. US [20]. Researchers and professionals have
developed and proposed systematic procedures for measured mile or baseline calculation [6, 12,
21, 22]. The general steps to perform measured mile/baseline calculation include processing data
for production input and output, identification of units representing the completed work,
computing the productivity by time periods or work sections, identification of measured mile or
baseline, and using the difference between the impacted productivity and the measured
mile/baseline to calculate productivity loss and damages.
A systematic procedure for measured mile calculation as a method was introduced by Zink [21, 22].
The measured mile method compares the productivity in an umimpacted period of time with
productivity in an impacted period of time in the same project. The procedures Zink proposed
include the following.
• Plot the actual labor worker-hours expended versus corresponding percentage of
completion for the work;
• Exclude the first and last 10% from the analysis; and,
• Identify a linear or near linear portion showing the most efficient rate of progress in the
80% of the curve as the measured mile.
The measured mile method, as originally proposed, requires that the portion of work used to
calculate the measured mile must be free or essentially free of disruptions and continuous in time,
which limits its application. In order to address the weaknesses in the measured mile method,
Thomas and his collaborators introduced the baseline concept [12, 13, 15, 16, 17, 18, 19]. Thomas
defined that a baseline period is a period of time when the best productivity is achieved, but its
baseline procedure requires the baseline to be selected from the reporting periods with highest
production [19]. The baseline period is not required to a continuous, unimpacted time frame,
while the measured mile period has to be a consecutive set of time periods. The steps to
determine a baseline proposed by Thomas and his collaborators can be summarized as follows.
• Determine the total number of reporting periods;
• The size of the baseline subset, n, is 10% of the total number of reporting periods and
should not be less than 5;
• The contents of the baseline subset are the n reporting periods that have the highest
production or output; and,
• The baseline is the median of productivity value in each reporting period or the quotient of
total production divided by total input in the baseline subset.
2012 AACE INTERNATIONAL TRANSACTIONS
CDR.980.6
In the attempt to overcome the shortcomings of having subjective percentage used in selecting the
measured mile or baseline, Ibbs and Liu proposed a statistical clustering method to separate the
productivity data into different groups [6]. The average value for the group with the best
productivity would serve as the measured mile or baseline. Although Ibbs and Liu’s method could
select the best baseline based on the available data, and was claimed to be more objective and
neutral, the baseline selected by Ibbs and Liu’s method may include data points that does not
represent the best-sustained productivity.
Zink’s measured mile method requires that the measured mile needs to be in a period with a linear
or near linear relationship between the expended labor hours and percent of work complete,
which implies that the level of productivity should maintain in the period that is disruption free or
nearly so. The assumption behind the baseline method proposed by Thomas for selecting the
reporting periods with the highest production or output as the baseline period can be understood
as that the disruption impact per output unit is relatively lower in the periods in which best
production is achieved. Ibbs and Liu’s method employs a statistical clustering technique to
segregate the periods with best productivity from all the others and uses the average as the
baseline productivity, which implies that the baseline period is not necessarily continuous. In terms
of baseline selection, Ibbs and Liu’s method may include unstained productivity data point into the
baseline set, because no productivity of a reporting period outside the baseline period can be
better than that in the baseline period when relying on this technique. Zink and Thomas’s
procedures appear to seek the best-sustained productivity, and as a result, the reporting period
with the highest productivity if not sustained would appear outside the measured mile/baseline
set.
Despite the differences among various procedures, the core of measured mile/baseline method is a
comparison of productivity in an unimpacted or lightly impacted area with the productivity of
similar work in an impacted area. The comparison relies on an unbiased baseline representing the
best sustained productivity.
Engineering Productivity Measurement
Reliable labor productivity measurement is a crucial element of measured mile/baseline method to
prove productivity loss in construction, and then reliable engineering productivity measurement is
also crucial to the method’s application to proving engineering productivity loss. In spite of the
awareness of the essentiality of engineering productivity, there have been only limited studies in
engineering productivity measurement.
Thomas and his co-authors proposed a conceptual model for measuring productivity on design and
engineering, in which conversion factors and rule of credit were used to account for the differences
of various work products in different stage of design engineering [14]. The application of this
conceptual model is discouraged by the involvement of conversion factors and rule of credit, which
are heavily affected by personal preference. The accuracy of the model is also compromised due to
lack of an industry consensus on design document complexity.
2012 AACE INTERNATIONAL TRANSACTIONS
CDR.980.7
The Engineering Productivity Measurement Research Team of Construction Industry Institue (CII),
or Research Team 156 (RT 156), acknowledged that there was no standard measurement of
productivity in the engineering phase for internal and external benchmarking [4]. CII RT 156
proposed to use measurable installed quantities for the measurement of design output. RT 156
conducted a detailed evaluation of the piping design process and found a good correlation
between the engineering productivity measured as worker-hours spent per linear foot of piping
and the number of equipment pieces in the piping systems. On the basis that engineering
productivity is affected by project complexity, quality of input, quality of design output, RT 156
proposed a conceptual model for engineering productivity, in which engineering productivity is
measured as engineering hours per installed quantity adjusted by three factors, input quality
factor, scope and complexity factors, and design effectiveness factor.
Song and others focused on the activities of steel drafting to characterize complexity factors for
engineering productivity through literature review, interview and survey [10]. They proposed a
neutral network model of engineering productivity quantification to facilitate project management
using 17 project-level influence factors, including project type, contract type, piece cloning, etc. In
contrast to project level factors, Song and AbouRizk proposed a conceptual scope definition
method, quantitative engineering project scope definition (QEPSD), to measure engineering project
scope quantitatively and quantify engineering complexity at the element level, such as number of
fittings and drafted quantity for steel drafting [11]. In QEPSD, different design components are
converted into the same design units using complexity functions, which may only exist
conceptually.
For the purpose of establishing a precise and reliable engineering productivity benchmarking in the
construction industry, the CII Benchmarking and Metrics (BM&M) program developed the
Engineering Productivity Metric System (EPMS), which included quantity-based metrics. BM&M
proposed using direct work-hours as the input and issued for construction (IFC) quantities as the
output to measure engineering productivity [7]. The EPMS includes a set of metrics hierarchically
at multiple levels, including Level I (project), Level II (major category), Level III (sub-category), and
Level IV (element). EPMS consists of six major categories, including concrete, steel, electrical,
piping, instrumentation, and equipment. Engineering productivity was proposed to be measured
at various levels and categories. BM&M collected engineering productivity data from 87 projects
provided by 21 different owner and contractor companies and examined the engineering
productivity in different categories and levels. BM&M also performed a correlation analysis
between direct engineering work-hours and IFC design quantities on structural steel and piping,
and found statistically significant bivariate relationships in those two categories. CII’s research
effort also included the method to calculate a comprehensive index for productivity assessment at
the project level based on the interdependencies among various disciplines and at different levels
[8].
Other researches on engineering productivity include Chang and Ibbs and Ebrahimy and Rokni [2,
5]. Chang and Ibbs used a deliverable-based engineering productivity measure. They examined
various engineering productivity factors, and highlighted two significant ones: phase involvement
and project size. Ebrahimy and Rokni illustrated the expected values for existing metrics in the
industry are dependent on the size of the projects.
2012 AACE INTERNATIONAL TRANSACTIONS
CDR.980.8
In summary, although various attempts have been made to establish a standard measurement of
engineering productivity and develop engineering productivity benchmarking for construction
industry, the models and methods proposed by various researchers remain in a conceptual stage.
Moreover, researchers still differ significantly in how to quantify the measurement of engineering
output, but most researchers agree that engineering productivity is influenced by multiple factors,
including project size and complexity, which could explain why a linear or close to linear
relationship was not observed between engineering work-hours and output quantities based on
the historical data from various projects.
Measured Mile/Baseline Method to Calculate Lost Engineering Productivity
Although a consensus on reliable engineering productivity measurement for construction industry
has not been widely reached, it does not prevent the measured mile/baseline method from being
an effective method to calculate engineering productivity loss. First, measured mile/baseline
method has been a widely accepted method in the construction industry. Second, measured
mile/baseline method is project specific, which is not influenced by the factors that differ from
project to project.
In the measured mile/baseline method for labor productivity, the measured mile/baseline is
defined as the period of time during which the labor productivity was unimpacted or lightly
impacted. This definition is not appropriate for engineering work. According to AIA Document
B141 [1], design professionals provide services in five phases, schematic design, design
development, construction document, bidding or negotiation, and construction or contract
administration. For a design build project, the design and engineering work usually cover from
design development, construction documents through the end of construction. The output for
design professionals during the period from design development through the end of construction
includes drawings, specifications, calculations, data sheets and others. The engineering efforts are
also spent in both design and construction phases. The engineering output for a particular item in
a project may go through multiple design revisions as the construction proceeds. Therefore, it is
more appropriate to define the engineering measured mile/baseline as the area (segment, system,
component, unit …) where engineering productivity was not impacted or lightly impacted.
Loulakis and Santiago presented the following basic guidelines that should be followed in
determining a measured mile for labor productivity [9].
• The work performed in the measured mile and the impacted period should be substantially
similar in type, nature and complexity;
• The composition and level of skill of crews should be comparable; and,
• The above principles should also apply to the measured mile/baseline for engineering
productivity.
The output used for engineering productivity calculation needs to represent the scope of
construction work that is designed and engineered. There are three different ways to quantify
engineering output in literature:
2012 AACE INTERNATIONAL TRANSACTIONS
CDR.980.9
Quantities of Engineering Documents [2][14]
In order to account for the differences among various documents, conversion is needed to
normalize the quantities, which compromises the reliability of this measurement because of the
lack of a standard definition of complexity and content, and the use of CAD technology [3, 4, 11].
Although this approach is not preferred, the authors would not rule out the possibility that under
some special circumstances, it may be appropriate to quantify engineering output with the mutual
agreements between the parties in the project.
Installed Quantities or the IFC Quantities
CII used the installed quantities and the IFC quantities to measure engineering output. CII’s
research indicates that significant correlation exists between expended engineering work-hours
and engineering output measured with Installed quantities or the IFC quantities [4, 7].
Other Quantifiable Elements for the Scope of Work
Song and others proposed to use the quantity of design items within a discipline, such as a beam or
a window to measure engineering output [11].
Since this paper is focused on a general measured mile/baseline method for engineering
productivity, engineering output quantification is not specified here, and it should be chosen
depending on the data and the characteristics of the work to be designed and engineered. The
measured mile/baseline calculation for engineering productivity can be performed using the
following procedure:
• Segregate the scope of engineering work into areas (segments, systems, components, units
…).
• Quantify work hours for each area (segment, system, component, unit …).
• Quantify engineering output for each area (segment, system, component, unit …).
• Calculate engineering productivity for each area (segment, system, component, unit …).
• Identify unimpacted or lightly impacted areas (segments, systems, components, units …) as
the measured mile/baseline subset. (This is generally determined by the magnitude of
changes, modifications, or review oversight initiated by the owner or third parties, and the
engineering effort required to address them)
• The measured mile/baseline productivity is the productivity of the measured mile/baseline
subset using total work-hours divided by the total quantities representing design output in
the same subset.
It is known that disruptions reduce productivity; therefore, it is natural to rule out disrupted areas
(segments, systems, components, units …). The proposed method is only dependent on the
causation study to determine the baseline, which is different from Zink’s measured mile procedure,
Thomas’s baseline method, and Ibbs and Liu’s K-means clustering technique based approach. In
order to test the quality of the baseline, a correlation analysis on the measured mile/baseline set
may be performed. Furthermore, the above baseline selection and calculation should be
corroborated by a cause-and-effect analysis to ascertain the causes for the productivity losses, and
allocate the losses to the responsible parties.
2012 AACE INTERNATIONAL TRANSACTIONS
CDR.980.10
Case Study
The proposed measured mile/baseline method to calculate engineering productivity loss has been
applied to a multi-hundred million dollar international project to design and build a process plant.
The project experienced multiple owner responsible impacts, which caused tremendous cost
overrun. The owner issued extensive change orders and the EPC contractor was paid for part of
the direct cost of the changes estimated for the normal conditions, adding up to several hundred
million dollars.
There was, however, still millions of dollars in engineering that remained uncompensated, which
could not be discretely captured in those change orders. During the course of the design and
construction of the project, the owner and its representatives issued tens of thousands of design
comments, the majority of which were owner changes. The measured mile/baseline method was
used to quantify the engineering productivity loss, which was impossible to be captured discretely
in the change orders, because of the cumulative impacts of numerous changes that the owner was
responsible for. This case study is limited to the piping discipline to demonstrate the application of
the proposed method. For confidentiality reason, productivity data used here was scaled and
altered from the actual.
The engineering work on piping is divided by various systems in the case study and the number of
pipe lines is used to measure engineering output. Detailed project cost reports were evaluated to
segregate and summarize direct work-hours on each system. Then the as built P&ID and isometrics
were studied to identify the number of pipe lines in each system. The engineering productivity in
this case study was defined as the work-hours spent on a pipe line. The direct work-hours, number
of pipe lines, and calculated productivities are summarized in table 1.
2012 AACE INTERNATIONAL TRANSACTIONS
CDR.980.11
System Name ID Direct Hours Number of
Lines
Hours Per Line
Boiler Blowdown 140 5 28.0
Boiler Feedwater 340 7 48.6
Chemical A 20 1 20.0
Chemical B 730 24 30.4
Chemical C 190 2 95.0
Chemical D 10 1 10.0
Fire Protection Foam 190 4 47.5
Fire Water 26,870 144 186.6
Instrument Air 1,370 95 14.4
Liquid State Chemical B 19,690 90 218.8
Low Pressure Steam 7,550 350 21.6
Lube Oil 50 2 25.0
Process Water 1,000 44 22.7
Service Air 960 55 17.5
Service Water 7,005 275 25.5
Steam Condensate 7,600 330 23.0
Tempered Water 365 17 21.5
Waste Water 1,650 29 56.9
Table 1— Piping Productivity Data
According to the contract, the design builder was required to prepare a 90% design, and then
complete the IFC design upon the receipt of the owner’s comments on 90% design. In this case
study, systems were segregated into those where the owner made fewer or no changes, and those
where the owner made significant changes. The systems summarized in table 2 are those with
little or no owner changes, so they were selected as the measured mile/baseline. The baseline
productivity was calculated to be 22.2 hours per line.
System Name Direct Hours Number
of Lines
Hours Per Line
Boiler Blowdown 140 5 24.0
Chemical A 20 1 16.0
Chemical D 10 1 12.0
Instrument Air 1,370 95 14.4
Low Pressure Steam 7,550 350 22.3
Lube Oil 50 2 25.5
Process Water 1,000 44 23.0
Service Air 960 55 17.4
Service Water 7,005 275 25.1
Steam Condensate 7,600 330 23.0
Tempered Water 365 17 20.6
Total 26,070 1,175 22.2
Table 2— Piping Design Productivity Baseline
2012 AACE INTERNATIONAL TRANSACTIONS
CDR.980.12
The remaining systems were determined to be the impacted, as either 90% design had to be
redone due to modification by the owner or the IFC documents were revised multiple times
because of the owner’s changes. The productivity loss calculation is summarized in table 3.
In order to assess the quality of the measured mile/baseline subset, a correlation analysis between
number of lines and work-hours expended is conducted for the subset, as shown in figure 1. The
calculated correlation coefficient was 0.9869, which shows a significant linear relationship between
the number of lines and work-hours expended in the case study. This indicates that in the case
study, not only the number of lines is a good metric to quantify piping design and engineering, but
also the selected measured mile/baseline has been proven to be consistently unimpacted or lightly
impacted systems.
System Name Direct
Hours
Number
of Lines
Hours Per
Line
Baseline Productivity
Loss
Boiler Feedwater 340 7 48.0 22.2 181
Chemical B 730 24 30.3 22.2 195
Chemical C 190 2 92.5 22.2 141
Fire Protection Foam 190 4 47.5 22.2 101
Fire Water 26,870 144 186.6 22.2 23,670
Liquid Chemical B 19,690 90 218.8 22.2 17,692
Waste Water 1,650 29 56.9 22.2 1,007
Table 3— Piping Design Productivity Loss
2012 AACE INTERNATIONAL TRANSACTIONS
CDR.980.13
y = 23.114x - 98.96
R² = 0.9869
(1,000)
-
1,000
2,000
3,000
4,000
5,000
6,000
7,000
8,000
9,000
0 50 100 150 200 250 300 350 400
EngineeringWork-Hours
Number of Lines
Two Mile Method to Quantify Engineering Productivity Loss with Complexity Difference
The underlying premise for the measured mile/baseline method is comparison of identical or
similar work with the same complexity. Unlike labor productivity, which can be isolated and
sampled daily, weekly or monthly, sampling engineering productivity requires the whole life cycle
of design and construction. The engineering effort on a particular area (segment, system,
component, unit …) of the facility to be built does not end when the IFC documents are issued;
instead the effort may continue until the construction is completed. Furthermore, it is impractical
to record engineering work-hours for each installed unit of work.
Engineering productivity sampling relies on the work break down in the project cost accounting
system, and the time keeping efforts by every designer/engineer on the project. Even though it
may be possible to measure engineering productivity for each dividable area (segment, system,
component, or unit …) under a well designed project cost accounting system and with the diligent
efforts for each engineering time keeper, the number of comparable areas (segments, systems,
components, or units …) are often limited, and finding quantifiable engineering work with the same
complexity is still very difficult. Therefore, although the concept of measured mile/baseline
method is straightforward, the implementation in practice may be challenging because of the
difficulties in finding the measured mile/baseline with the same complexity as the impacted.
RT 156 of CII researched the relationship between piping engineering work hours and physical
measurement of quantities, and concluded that equipment piece count represents the complexity
of piping engineering [4]. RT 156 then formulated a linear relationship between the piping
Figure 1 — Correlation Between Work Hours and Number of Lines in the Baseline
2012 AACE INTERNATIONAL TRANSACTIONS
CDR.980.14
engineering productivity measured as work-hours per installed quantity and number of pieces of
equipment in the piping discipline based on a regression analysis on the data from 40 projects.
Hours/Feet of Piping ⋅+= 00134.044985.0 (Number of Pieces of Equipment)
equation 1
The above finding by RT 156 of CII indicates that piping engineering productivity when measured as
work hours per feet of piping is driven by the number of pieces of equipment, and the more pieces
of equipment that are in the piping system, the more engineering hours are expended. This finding
proved that it is a practical and reasonable assumption to model engineering productivity (P) as a
linear function of a variable (C) that represents engineering complexity (complexity variable), or
bCaP +⋅=
equation 2
P = engineering productivity.
C = the variable representing engineering complexity.
a, b = parameters.
If productivity and complexity information are available for two not impacted (or lightly impacted)
areas (segments, systems, components, or units …), or
bCaP +⋅= 11
equation 3
bCaP +⋅= 22
equation 4
then parameters a and b can be solved as
21
21
CC
PP
a
−
−
=
equation 5
21
1221
CC
PCPC
b
−
−
=
equation 6
Given the actual productivity P3,a per linear foot of piping and complexity C3 for an impacted area
(segment, system, component, or unit …), the productivity that would have been without impacts
(or lightly impacted) P3 is
bCaP +⋅= 33
equation 7
2012 AACE INTERNATIONAL TRANSACTIONS
CDR.980.15
or
21
1221
3
21
21
3
CC
PCPC
C
CC
PP
P
−
−
+⋅
−
−
=
equation 8
Then the productivity loss on a linear foot of piping for the impact area is
3,3 PPP a −=Δ
equation 9
Since data from two unaffected (or lightly impacted) areas (segments, systems, components, or
units …) is needed to solve equations (3) and (4) for parameters a and b, this method is named the
two mile method. If there are more than two unaffected areas (segments, systems, components,
or units …) available in the unaffected set, or the measured mile/baseline set, least square
regression is recommended to approximate the parameters a and b that would be representative.
In fact, the size of the measured mile/baseline set should not be limited to 2, and it should include
all the areas (segments, systems, components, or units …) that can be identified as unaffected or
lightly impacted. The advantage of this method is that it makes it possible to calculate engineering
productivity at different complexity with as few as two measured mile/baseline needed. The
procedures to implement the two mile method, summarized below, are similar to the measured
mile/baseline method, and are also very straightforward:
• Segregate the scope of engineering work into areas (segments, systems, components, units
…).
• Quantify work hours for each area (segment, system, component, unit …).
• Quantify engineering output for each area (segment, system, component, unit …).
• Calculate engineering productivity for each area (segment, system, component, unit …).
• Identify the complexity factor, and determine the complexity value for area (segment,
system, component, unit …).
• Determine all the unaffected or lightly impacted areas (segments, systems, components,
units …) as the benchmark.
• If there are only two areas (segments, systems, components, units …) in the benchmark
subset, go to 8; if there are more than two areas (segments, systems, components, units …),
go to 9.
• Use Equations (5) and (6) to calculate parameters a and b, go to 10.
• Use least square regression to determine parameters a and b.
• Use Equations (8) and (9) to calculate productivity loss for a linear foot of piping in the
impacted area (segment, system, component, unit …). And,
• The total productivity loss for a given area (segment, system, component, unit …) is
calculated as the product of the productivity loss per linear foot and the total pipe length in
the area (segment, system, component, unit …).
2012 AACE INTERNATIONAL TRANSACTIONS
CDR.980.16
Conclusion
This paper has reviewed and summarized the measurement technique of engineering productivity,
and applied the measured mile/baseline method to quantify engineering productivity loss for
cumulative impacts of multiple disruptions, which are difficult to quantify discretely. The
implementation has been demonstrated by a case study, which illustrates that project specific
information can be successfully used to prove engineering productivity loss. In addition, in order to
alleviate the difficulty of identify measured miles or baseline from areas (segments, systems,
components, units …) with same complexity, a two mile method is proposed. The two mile method
is designed to calculate engineering productivity loss for similar work with different complexity
under the condition that engineering productivity is a linear function of engineering complexity.
The proposed method is straightforward and easy to understand and use.
2012 AACE INTERNATIONAL TRANSACTIONS
CDR.980.17
1. American Institute of Architects (AIA) Standard Form of Agreement Between Owner and
Architect, AIA Document B141, AIA, Washington, DC, 1997.
2. Chang, A.S., and W. Ibbs. System Model for Analyzing Design Productivity, Journal of
Management in Engineering, 22, 1 (2006): Pgs. 27-34. ASCE, Reston, VA.
3. Chang, L., M.E. Georgy, and L. Zhang. Engineering Productivity Measurement, Research
Report 156-11 CII, Austin, TX, 2001.
4. Construction Industry Institute (CII). Engineering Productivity Measurement, CII Publication
156, CII, Austin, TX, 2001.
5. Ebrahimy, Y., and S. Rokni. Validity of Industry Benchmarks and Metrics for Engineering
Productivity. Proceedings, Construction Research Congress, Banff, Canada, 2010.
6. Ibbs, W., and M. Liu. Improved Measured Mile Analysis Technique. Journal of Construction
Engineering and Management, 131, 12 (2005): Pgs 1249-1256. ASCE, Reston, VA.
7. Kim, I. Development and Implementation of an Engineering Productivity Measurement
System (EPMS) for Benchmarking. Ph.D. thesis, University of Texas, Austin, TX, 2007.
8. Liao, P.C. 2008 Influence Factors of Engineering Productivity and Their Impact on Project
Performance, Ph.D. thesis, University of Texas, Austin, TX.
9. Loulakis, M.C., and S.J. Santiago. Getting the Most Out of Your “Measured Mile” Approach,
Civil Engineering, 69, 11 (1999): Pgs. 69. ASCE, Reston, VA.
10. Song, L., M. Allouche, and S.M. AbouRizk. Measuring and Estimating Drafting Productivity,
Proceedings. Construction Research Congress, Honolulu, HI, 2003.
11. Song, L., S.M. AbouRizk. Quantifying Engineering Project Scope for Productivity Modeling.
Journal of Construction Engineering and Management, 131, 3 (2005): Pgs. 360-367. ASCE,
Reston, VA.
12. Thomas, H.R., and I. Zavrski. Construction Baseline Productivity: Theory and Practice Journal
of Construction Engineering and Management, 125, 5 (1999): Pgs. 295-303. ASCE, Reston,
VA.
13. Thomas, H.R., D.R. Riley, and V.E. Sanvido. Loss of Labor Productivity Due to Delivery
Methods and Weather. Journal of Construction Engineering and Management, 125, 1
(1999): Pgs. 39-46. ASCE, Reston, VA.
14. Thomas, H.R., Q.C. Korte, V.E. Sanvido, and M.K. Parfitt. Conceptual Model for Measuring
Productivity of Design and Engineering. Journal of Architectural Engineering, 5, 1 (1999):
Pgs. 1-7. ASCE, Reston, VA.
15. Thomas, H.R., and V.E. Sanvido. Quantification of Losses Caused by Labor Inefficiencies
Where is the Elusive Measured Mile? Construction Law and Business, 1, 3 (2000): Pgs. 1-14.
Aspen Law & Business, New York, NY.
16. Thomas, H.R., and V.E. Sanvido. Role of the Fabricator in Labor Productivity. Journal of
Construction Engineering and Management, 126, 5 (2000): Pgs. 358-365. ASCE, Reston, VA.
17. Thomas, H.R., M.J. Horman, R.E. Minchin, and D. Chen. Improving Labor Flow Reliability for
Better Productivity as Lean Construction Principle. Journal of Construction Engineering and
Management, 129, 3 (2003): Pgs. 251-261. ASCE, Reston, VA.
18. Thomas, H.R., R.E. Minchin, and D. Chen. Improving Role of Workforce Management in
Bridge Superstructure Labor Productivity. Journal of Management in Engineering, 19, 1
(2003): Pgs. 9-16. ASCE, Reston, VA.
2012 AACE INTERNATIONAL TRANSACTIONS
CDR.980.18
19. Thomas, H.R. Quantification of Economics Losses Caused by Labor Inefficiencies.
Proceedings. Construction Super Conference, San Francisco, CA, 2007.
20. Wickwire, J.M., T.J. Driscoll, and S.B. Hurlbut. Chapter 10, Calculating Contractor’s Damages,
Construction Scheduling: Preparation, Liability, and Claims Implementing, First Edition,
(1991):page 302, John Wiley & Sons, Inc., New York.
21. Zink, D.A. Impacts and Construction Inefficiency. AACE International Cost Engineering
Journal, 32, 11 (1990): Pgs. 21-23. AACE International, Morgantown, WV.
22. Zink, D.A., The Measured Mile: Proving Construction Inefficiency Costs. AACE International
Cost Engineering journal, 28, 4 (1986): Pgs. 19-21. AACE International, Morgantown, WV.
Dr. Tong Zhao, PE PSP
Delta Consulting Group, Inc.
tzhao@delta-cqi.com
J. Mark Dungan
Delta Consulting Group, Inc.
mdungan@delta-cqi.com

More Related Content

What's hot

Project Control- Overview Presentation Tafseer
Project Control- Overview Presentation   TafseerProject Control- Overview Presentation   Tafseer
Project Control- Overview Presentation TafseerKishan Solankimbaccepmp
 
Epc project interdepency and Work Flow- promo
Epc project interdepency and Work Flow- promoEpc project interdepency and Work Flow- promo
Epc project interdepency and Work Flow- promoignitetribes
 
Construction Project Schedule Example- Residential Building
Construction Project Schedule Example- Residential BuildingConstruction Project Schedule Example- Residential Building
Construction Project Schedule Example- Residential BuildingSHAZEBALIKHAN1
 
construction project managment_civileng
construction project managment_civilengconstruction project managment_civileng
construction project managment_civilengsulaiman khan
 
Construction project management
Construction project managementConstruction project management
Construction project managementsaif hasan
 
Project Controls Expo 09/10 Nov London 2011 - An Introduction to Performance ...
Project Controls Expo 09/10 Nov London 2011 - An Introduction to Performance ...Project Controls Expo 09/10 Nov London 2011 - An Introduction to Performance ...
Project Controls Expo 09/10 Nov London 2011 - An Introduction to Performance ...Project Controls Expo
 
Project controls
Project controlsProject controls
Project controlsAshok Kumar
 
Measurement News Webinar
Measurement News WebinarMeasurement News Webinar
Measurement News WebinarGlen Alleman
 
AMTS Construction Management, Project Management, Facility Solutions Expertise
AMTS Construction Management, Project Management, Facility Solutions ExpertiseAMTS Construction Management, Project Management, Facility Solutions Expertise
AMTS Construction Management, Project Management, Facility Solutions ExpertiseAM Technical Solutions, Inc
 
PMP Flash Card
PMP Flash CardPMP Flash Card
PMP Flash Cardasim78
 
FTA Construction Management Handbook - 2012
FTA Construction Management Handbook - 2012FTA Construction Management Handbook - 2012
FTA Construction Management Handbook - 2012Yusuf Yıldız
 
Establishing the Performance Measurement Baseline
Establishing the Performance Measurement BaselineEstablishing the Performance Measurement Baseline
Establishing the Performance Measurement BaselineGlen Alleman
 
Practical Project Cost Control for Large Complex Projects
Practical Project Cost Control for Large Complex ProjectsPractical Project Cost Control for Large Complex Projects
Practical Project Cost Control for Large Complex ProjectsJeremie Averous
 
Establishing the performance measurement baseline (pmi northern utah)(v1)
Establishing the performance measurement baseline (pmi northern utah)(v1)Establishing the performance measurement baseline (pmi northern utah)(v1)
Establishing the performance measurement baseline (pmi northern utah)(v1)Glen Alleman
 
Balancing burdens of proof in dispute avoidance and resolution by "Ari Isaacs...
Balancing burdens of proof in dispute avoidance and resolution by "Ari Isaacs...Balancing burdens of proof in dispute avoidance and resolution by "Ari Isaacs...
Balancing burdens of proof in dispute avoidance and resolution by "Ari Isaacs...Project Controls Expo
 
Critical Success Factors for ERP
Critical Success Factors for ERPCritical Success Factors for ERP
Critical Success Factors for ERPGlen Alleman
 

What's hot (20)

Project Control- Overview Presentation Tafseer
Project Control- Overview Presentation   TafseerProject Control- Overview Presentation   Tafseer
Project Control- Overview Presentation Tafseer
 
Epc project interdepency and Work Flow- promo
Epc project interdepency and Work Flow- promoEpc project interdepency and Work Flow- promo
Epc project interdepency and Work Flow- promo
 
Construction Project Schedule Example- Residential Building
Construction Project Schedule Example- Residential BuildingConstruction Project Schedule Example- Residential Building
Construction Project Schedule Example- Residential Building
 
Detailed engineering-design-phase
Detailed engineering-design-phaseDetailed engineering-design-phase
Detailed engineering-design-phase
 
Project Schedule Management
Project Schedule ManagementProject Schedule Management
Project Schedule Management
 
construction project managment_civileng
construction project managment_civilengconstruction project managment_civileng
construction project managment_civileng
 
Construction project management
Construction project managementConstruction project management
Construction project management
 
Project Controls Expo 09/10 Nov London 2011 - An Introduction to Performance ...
Project Controls Expo 09/10 Nov London 2011 - An Introduction to Performance ...Project Controls Expo 09/10 Nov London 2011 - An Introduction to Performance ...
Project Controls Expo 09/10 Nov London 2011 - An Introduction to Performance ...
 
Project controls
Project controlsProject controls
Project controls
 
Measurement News Webinar
Measurement News WebinarMeasurement News Webinar
Measurement News Webinar
 
AMTS Construction Management, Project Management, Facility Solutions Expertise
AMTS Construction Management, Project Management, Facility Solutions ExpertiseAMTS Construction Management, Project Management, Facility Solutions Expertise
AMTS Construction Management, Project Management, Facility Solutions Expertise
 
Project Control System
Project Control SystemProject Control System
Project Control System
 
PMP Flash Card
PMP Flash CardPMP Flash Card
PMP Flash Card
 
FTA Construction Management Handbook - 2012
FTA Construction Management Handbook - 2012FTA Construction Management Handbook - 2012
FTA Construction Management Handbook - 2012
 
Establishing the Performance Measurement Baseline
Establishing the Performance Measurement BaselineEstablishing the Performance Measurement Baseline
Establishing the Performance Measurement Baseline
 
Practical Project Cost Control for Large Complex Projects
Practical Project Cost Control for Large Complex ProjectsPractical Project Cost Control for Large Complex Projects
Practical Project Cost Control for Large Complex Projects
 
Establishing the performance measurement baseline (pmi northern utah)(v1)
Establishing the performance measurement baseline (pmi northern utah)(v1)Establishing the performance measurement baseline (pmi northern utah)(v1)
Establishing the performance measurement baseline (pmi northern utah)(v1)
 
Balancing burdens of proof in dispute avoidance and resolution by "Ari Isaacs...
Balancing burdens of proof in dispute avoidance and resolution by "Ari Isaacs...Balancing burdens of proof in dispute avoidance and resolution by "Ari Isaacs...
Balancing burdens of proof in dispute avoidance and resolution by "Ari Isaacs...
 
Critical Success Factors for ERP
Critical Success Factors for ERPCritical Success Factors for ERP
Critical Success Factors for ERP
 
Construction KPIs & Dashboards
Construction KPIs & DashboardsConstruction KPIs & Dashboards
Construction KPIs & Dashboards
 

Similar to Improving engineering productivity_loss_zhao-dungan

IRJET- Literature Review on Manufacturing System Performance Improvement ...
IRJET-  	  Literature Review on Manufacturing System Performance Improvement ...IRJET-  	  Literature Review on Manufacturing System Performance Improvement ...
IRJET- Literature Review on Manufacturing System Performance Improvement ...IRJET Journal
 
Study of Lean construction tools for Workflow Improvement -A Review
Study of Lean construction tools for Workflow Improvement -A ReviewStudy of Lean construction tools for Workflow Improvement -A Review
Study of Lean construction tools for Workflow Improvement -A ReviewIRJET Journal
 
IRJET- Optimization of Cycle Time by using Various Techniques: A Review
IRJET- Optimization of Cycle Time by using Various Techniques: A ReviewIRJET- Optimization of Cycle Time by using Various Techniques: A Review
IRJET- Optimization of Cycle Time by using Various Techniques: A ReviewIRJET Journal
 
Optimization of Injection Molding Process-literature review
Optimization of Injection Molding Process-literature reviewOptimization of Injection Molding Process-literature review
Optimization of Injection Molding Process-literature reviewAlex Larsh
 
Demystifying Engineering Analytics
Demystifying Engineering AnalyticsDemystifying Engineering Analytics
Demystifying Engineering AnalyticsCognizant
 
Gaining Insights into Patient Satisfaction through Interpretable Machine Lear...
Gaining Insights into Patient Satisfaction through Interpretable Machine Lear...Gaining Insights into Patient Satisfaction through Interpretable Machine Lear...
Gaining Insights into Patient Satisfaction through Interpretable Machine Lear...IRJET Journal
 
Time, Cost, and Quality Trade-off Analysis in Construction Projects
Time, Cost, and Quality Trade-off Analysis in Construction ProjectsTime, Cost, and Quality Trade-off Analysis in Construction Projects
Time, Cost, and Quality Trade-off Analysis in Construction ProjectsIRJET Journal
 
Line Balancing and facility optimization of Machine Shop with Work Study and ...
Line Balancing and facility optimization of Machine Shop with Work Study and ...Line Balancing and facility optimization of Machine Shop with Work Study and ...
Line Balancing and facility optimization of Machine Shop with Work Study and ...IRJET Journal
 
Cost-Estimation-Techniques unit 2.pptx
Cost-Estimation-Techniques unit 2.pptxCost-Estimation-Techniques unit 2.pptx
Cost-Estimation-Techniques unit 2.pptxSudipBalLama
 
Software testing effort estimation with cobb douglas function a practical app...
Software testing effort estimation with cobb douglas function a practical app...Software testing effort estimation with cobb douglas function a practical app...
Software testing effort estimation with cobb douglas function a practical app...eSAT Publishing House
 
Software testing effort estimation with cobb douglas function- a practical ap...
Software testing effort estimation with cobb douglas function- a practical ap...Software testing effort estimation with cobb douglas function- a practical ap...
Software testing effort estimation with cobb douglas function- a practical ap...eSAT Journals
 
Estimation of Manufacturing Costs in the Early Stages of Product Development ...
Estimation of Manufacturing Costs in the Early Stages of Product Development ...Estimation of Manufacturing Costs in the Early Stages of Product Development ...
Estimation of Manufacturing Costs in the Early Stages of Product Development ...IJMER
 
2005 cim castingcostestimation
2005 cim castingcostestimation2005 cim castingcostestimation
2005 cim castingcostestimationvishalwagh40
 
IRJET- Efficiency Enhancement by Reducing Production and Machining Time
IRJET-  	  Efficiency Enhancement by Reducing Production and Machining TimeIRJET-  	  Efficiency Enhancement by Reducing Production and Machining Time
IRJET- Efficiency Enhancement by Reducing Production and Machining TimeIRJET Journal
 
IRJET - Analysis of Process Re-Engineering to Reduce Lead Time in Apparel Ind...
IRJET - Analysis of Process Re-Engineering to Reduce Lead Time in Apparel Ind...IRJET - Analysis of Process Re-Engineering to Reduce Lead Time in Apparel Ind...
IRJET - Analysis of Process Re-Engineering to Reduce Lead Time in Apparel Ind...IRJET Journal
 
IRJET- A Review of Data Mining and its Methods Used in Manufacturing and How ...
IRJET- A Review of Data Mining and its Methods Used in Manufacturing and How ...IRJET- A Review of Data Mining and its Methods Used in Manufacturing and How ...
IRJET- A Review of Data Mining and its Methods Used in Manufacturing and How ...IRJET Journal
 
The Evolving Landscape of Semiconductor Manufacturing to Mitigate Yield Losse...
The Evolving Landscape of Semiconductor Manufacturing to Mitigate Yield Losse...The Evolving Landscape of Semiconductor Manufacturing to Mitigate Yield Losse...
The Evolving Landscape of Semiconductor Manufacturing to Mitigate Yield Losse...yieldWerx Semiconductor
 
IRJET- Enhancing Line Efficiency of Road Machinery Assembly Line at Volvo...
IRJET-  	  Enhancing Line Efficiency of Road Machinery Assembly Line at Volvo...IRJET-  	  Enhancing Line Efficiency of Road Machinery Assembly Line at Volvo...
IRJET- Enhancing Line Efficiency of Road Machinery Assembly Line at Volvo...IRJET Journal
 
IRJET- Improving Quality and Productivity in Switchgear Tank Welding through ...
IRJET- Improving Quality and Productivity in Switchgear Tank Welding through ...IRJET- Improving Quality and Productivity in Switchgear Tank Welding through ...
IRJET- Improving Quality and Productivity in Switchgear Tank Welding through ...IRJET Journal
 

Similar to Improving engineering productivity_loss_zhao-dungan (20)

IRJET- Literature Review on Manufacturing System Performance Improvement ...
IRJET-  	  Literature Review on Manufacturing System Performance Improvement ...IRJET-  	  Literature Review on Manufacturing System Performance Improvement ...
IRJET- Literature Review on Manufacturing System Performance Improvement ...
 
Study of Lean construction tools for Workflow Improvement -A Review
Study of Lean construction tools for Workflow Improvement -A ReviewStudy of Lean construction tools for Workflow Improvement -A Review
Study of Lean construction tools for Workflow Improvement -A Review
 
I012536474
I012536474I012536474
I012536474
 
IRJET- Optimization of Cycle Time by using Various Techniques: A Review
IRJET- Optimization of Cycle Time by using Various Techniques: A ReviewIRJET- Optimization of Cycle Time by using Various Techniques: A Review
IRJET- Optimization of Cycle Time by using Various Techniques: A Review
 
Optimization of Injection Molding Process-literature review
Optimization of Injection Molding Process-literature reviewOptimization of Injection Molding Process-literature review
Optimization of Injection Molding Process-literature review
 
Demystifying Engineering Analytics
Demystifying Engineering AnalyticsDemystifying Engineering Analytics
Demystifying Engineering Analytics
 
Gaining Insights into Patient Satisfaction through Interpretable Machine Lear...
Gaining Insights into Patient Satisfaction through Interpretable Machine Lear...Gaining Insights into Patient Satisfaction through Interpretable Machine Lear...
Gaining Insights into Patient Satisfaction through Interpretable Machine Lear...
 
Time, Cost, and Quality Trade-off Analysis in Construction Projects
Time, Cost, and Quality Trade-off Analysis in Construction ProjectsTime, Cost, and Quality Trade-off Analysis in Construction Projects
Time, Cost, and Quality Trade-off Analysis in Construction Projects
 
Line Balancing and facility optimization of Machine Shop with Work Study and ...
Line Balancing and facility optimization of Machine Shop with Work Study and ...Line Balancing and facility optimization of Machine Shop with Work Study and ...
Line Balancing and facility optimization of Machine Shop with Work Study and ...
 
Cost-Estimation-Techniques unit 2.pptx
Cost-Estimation-Techniques unit 2.pptxCost-Estimation-Techniques unit 2.pptx
Cost-Estimation-Techniques unit 2.pptx
 
Software testing effort estimation with cobb douglas function a practical app...
Software testing effort estimation with cobb douglas function a practical app...Software testing effort estimation with cobb douglas function a practical app...
Software testing effort estimation with cobb douglas function a practical app...
 
Software testing effort estimation with cobb douglas function- a practical ap...
Software testing effort estimation with cobb douglas function- a practical ap...Software testing effort estimation with cobb douglas function- a practical ap...
Software testing effort estimation with cobb douglas function- a practical ap...
 
Estimation of Manufacturing Costs in the Early Stages of Product Development ...
Estimation of Manufacturing Costs in the Early Stages of Product Development ...Estimation of Manufacturing Costs in the Early Stages of Product Development ...
Estimation of Manufacturing Costs in the Early Stages of Product Development ...
 
2005 cim castingcostestimation
2005 cim castingcostestimation2005 cim castingcostestimation
2005 cim castingcostestimation
 
IRJET- Efficiency Enhancement by Reducing Production and Machining Time
IRJET-  	  Efficiency Enhancement by Reducing Production and Machining TimeIRJET-  	  Efficiency Enhancement by Reducing Production and Machining Time
IRJET- Efficiency Enhancement by Reducing Production and Machining Time
 
IRJET - Analysis of Process Re-Engineering to Reduce Lead Time in Apparel Ind...
IRJET - Analysis of Process Re-Engineering to Reduce Lead Time in Apparel Ind...IRJET - Analysis of Process Re-Engineering to Reduce Lead Time in Apparel Ind...
IRJET - Analysis of Process Re-Engineering to Reduce Lead Time in Apparel Ind...
 
IRJET- A Review of Data Mining and its Methods Used in Manufacturing and How ...
IRJET- A Review of Data Mining and its Methods Used in Manufacturing and How ...IRJET- A Review of Data Mining and its Methods Used in Manufacturing and How ...
IRJET- A Review of Data Mining and its Methods Used in Manufacturing and How ...
 
The Evolving Landscape of Semiconductor Manufacturing to Mitigate Yield Losse...
The Evolving Landscape of Semiconductor Manufacturing to Mitigate Yield Losse...The Evolving Landscape of Semiconductor Manufacturing to Mitigate Yield Losse...
The Evolving Landscape of Semiconductor Manufacturing to Mitigate Yield Losse...
 
IRJET- Enhancing Line Efficiency of Road Machinery Assembly Line at Volvo...
IRJET-  	  Enhancing Line Efficiency of Road Machinery Assembly Line at Volvo...IRJET-  	  Enhancing Line Efficiency of Road Machinery Assembly Line at Volvo...
IRJET- Enhancing Line Efficiency of Road Machinery Assembly Line at Volvo...
 
IRJET- Improving Quality and Productivity in Switchgear Tank Welding through ...
IRJET- Improving Quality and Productivity in Switchgear Tank Welding through ...IRJET- Improving Quality and Productivity in Switchgear Tank Welding through ...
IRJET- Improving Quality and Productivity in Switchgear Tank Welding through ...
 

More from ignitetribes

Primavera Activity ID Coding
Primavera Activity ID CodingPrimavera Activity ID Coding
Primavera Activity ID Codingignitetribes
 
Project control plan_draft
Project control plan_draftProject control plan_draft
Project control plan_draftignitetribes
 
Sample wbs for_upstream_epcic_project
Sample wbs for_upstream_epcic_projectSample wbs for_upstream_epcic_project
Sample wbs for_upstream_epcic_projectignitetribes
 
Second edition epc project rule of credit and progress measurement promo
Second edition epc project rule of credit and progress measurement promoSecond edition epc project rule of credit and progress measurement promo
Second edition epc project rule of credit and progress measurement promoignitetribes
 
Headed Towards Burnout
Headed Towards BurnoutHeaded Towards Burnout
Headed Towards Burnoutignitetribes
 
The Leadership Qualities of Elon Musk
The Leadership Qualities of Elon MuskThe Leadership Qualities of Elon Musk
The Leadership Qualities of Elon Muskignitetribes
 
101 toughest interviews_questions
101 toughest interviews_questions101 toughest interviews_questions
101 toughest interviews_questionsignitetribes
 
Project Control Practical Way by Herve Baron
Project Control Practical Way by Herve BaronProject Control Practical Way by Herve Baron
Project Control Practical Way by Herve Baronignitetribes
 
Process Related, Mechanical and Piping Workshop by Technip
Process Related, Mechanical and Piping Workshop by TechnipProcess Related, Mechanical and Piping Workshop by Technip
Process Related, Mechanical and Piping Workshop by Technipignitetribes
 
Technip case study
Technip case studyTechnip case study
Technip case studyignitetribes
 
Project planning and control training with lego
Project planning and control training with legoProject planning and control training with lego
Project planning and control training with legoignitetribes
 

More from ignitetribes (11)

Primavera Activity ID Coding
Primavera Activity ID CodingPrimavera Activity ID Coding
Primavera Activity ID Coding
 
Project control plan_draft
Project control plan_draftProject control plan_draft
Project control plan_draft
 
Sample wbs for_upstream_epcic_project
Sample wbs for_upstream_epcic_projectSample wbs for_upstream_epcic_project
Sample wbs for_upstream_epcic_project
 
Second edition epc project rule of credit and progress measurement promo
Second edition epc project rule of credit and progress measurement promoSecond edition epc project rule of credit and progress measurement promo
Second edition epc project rule of credit and progress measurement promo
 
Headed Towards Burnout
Headed Towards BurnoutHeaded Towards Burnout
Headed Towards Burnout
 
The Leadership Qualities of Elon Musk
The Leadership Qualities of Elon MuskThe Leadership Qualities of Elon Musk
The Leadership Qualities of Elon Musk
 
101 toughest interviews_questions
101 toughest interviews_questions101 toughest interviews_questions
101 toughest interviews_questions
 
Project Control Practical Way by Herve Baron
Project Control Practical Way by Herve BaronProject Control Practical Way by Herve Baron
Project Control Practical Way by Herve Baron
 
Process Related, Mechanical and Piping Workshop by Technip
Process Related, Mechanical and Piping Workshop by TechnipProcess Related, Mechanical and Piping Workshop by Technip
Process Related, Mechanical and Piping Workshop by Technip
 
Technip case study
Technip case studyTechnip case study
Technip case study
 
Project planning and control training with lego
Project planning and control training with legoProject planning and control training with lego
Project planning and control training with lego
 

Recently uploaded

(PRIYA) Rajgurunagar Call Girls Just Call 7001035870 [ Cash on Delivery ] Pun...
(PRIYA) Rajgurunagar Call Girls Just Call 7001035870 [ Cash on Delivery ] Pun...(PRIYA) Rajgurunagar Call Girls Just Call 7001035870 [ Cash on Delivery ] Pun...
(PRIYA) Rajgurunagar Call Girls Just Call 7001035870 [ Cash on Delivery ] Pun...ranjana rawat
 
OSVC_Meta-Data based Simulation Automation to overcome Verification Challenge...
OSVC_Meta-Data based Simulation Automation to overcome Verification Challenge...OSVC_Meta-Data based Simulation Automation to overcome Verification Challenge...
OSVC_Meta-Data based Simulation Automation to overcome Verification Challenge...Soham Mondal
 
Decoding Kotlin - Your guide to solving the mysterious in Kotlin.pptx
Decoding Kotlin - Your guide to solving the mysterious in Kotlin.pptxDecoding Kotlin - Your guide to solving the mysterious in Kotlin.pptx
Decoding Kotlin - Your guide to solving the mysterious in Kotlin.pptxJoão Esperancinha
 
(ANJALI) Dange Chowk Call Girls Just Call 7001035870 [ Cash on Delivery ] Pun...
(ANJALI) Dange Chowk Call Girls Just Call 7001035870 [ Cash on Delivery ] Pun...(ANJALI) Dange Chowk Call Girls Just Call 7001035870 [ Cash on Delivery ] Pun...
(ANJALI) Dange Chowk Call Girls Just Call 7001035870 [ Cash on Delivery ] Pun...ranjana rawat
 
Extrusion Processes and Their Limitations
Extrusion Processes and Their LimitationsExtrusion Processes and Their Limitations
Extrusion Processes and Their Limitations120cr0395
 
main PPT.pptx of girls hostel security using rfid
main PPT.pptx of girls hostel security using rfidmain PPT.pptx of girls hostel security using rfid
main PPT.pptx of girls hostel security using rfidNikhilNagaraju
 
Analog to Digital and Digital to Analog Converter
Analog to Digital and Digital to Analog ConverterAnalog to Digital and Digital to Analog Converter
Analog to Digital and Digital to Analog ConverterAbhinavSharma374939
 
(RIA) Call Girls Bhosari ( 7001035870 ) HI-Fi Pune Escorts Service
(RIA) Call Girls Bhosari ( 7001035870 ) HI-Fi Pune Escorts Service(RIA) Call Girls Bhosari ( 7001035870 ) HI-Fi Pune Escorts Service
(RIA) Call Girls Bhosari ( 7001035870 ) HI-Fi Pune Escorts Serviceranjana rawat
 
High Profile Call Girls Nagpur Isha Call 7001035870 Meet With Nagpur Escorts
High Profile Call Girls Nagpur Isha Call 7001035870 Meet With Nagpur EscortsHigh Profile Call Girls Nagpur Isha Call 7001035870 Meet With Nagpur Escorts
High Profile Call Girls Nagpur Isha Call 7001035870 Meet With Nagpur Escortsranjana rawat
 
Call for Papers - African Journal of Biological Sciences, E-ISSN: 2663-2187, ...
Call for Papers - African Journal of Biological Sciences, E-ISSN: 2663-2187, ...Call for Papers - African Journal of Biological Sciences, E-ISSN: 2663-2187, ...
Call for Papers - African Journal of Biological Sciences, E-ISSN: 2663-2187, ...Christo Ananth
 
Processing & Properties of Floor and Wall Tiles.pptx
Processing & Properties of Floor and Wall Tiles.pptxProcessing & Properties of Floor and Wall Tiles.pptx
Processing & Properties of Floor and Wall Tiles.pptxpranjaldaimarysona
 
Software Development Life Cycle By Team Orange (Dept. of Pharmacy)
Software Development Life Cycle By  Team Orange (Dept. of Pharmacy)Software Development Life Cycle By  Team Orange (Dept. of Pharmacy)
Software Development Life Cycle By Team Orange (Dept. of Pharmacy)Suman Mia
 
Introduction to Multiple Access Protocol.pptx
Introduction to Multiple Access Protocol.pptxIntroduction to Multiple Access Protocol.pptx
Introduction to Multiple Access Protocol.pptxupamatechverse
 
VIP Call Girls Service Hitech City Hyderabad Call +91-8250192130
VIP Call Girls Service Hitech City Hyderabad Call +91-8250192130VIP Call Girls Service Hitech City Hyderabad Call +91-8250192130
VIP Call Girls Service Hitech City Hyderabad Call +91-8250192130Suhani Kapoor
 
Gfe Mayur Vihar Call Girls Service WhatsApp -> 9999965857 Available 24x7 ^ De...
Gfe Mayur Vihar Call Girls Service WhatsApp -> 9999965857 Available 24x7 ^ De...Gfe Mayur Vihar Call Girls Service WhatsApp -> 9999965857 Available 24x7 ^ De...
Gfe Mayur Vihar Call Girls Service WhatsApp -> 9999965857 Available 24x7 ^ De...srsj9000
 
Porous Ceramics seminar and technical writing
Porous Ceramics seminar and technical writingPorous Ceramics seminar and technical writing
Porous Ceramics seminar and technical writingrakeshbaidya232001
 
What are the advantages and disadvantages of membrane structures.pptx
What are the advantages and disadvantages of membrane structures.pptxWhat are the advantages and disadvantages of membrane structures.pptx
What are the advantages and disadvantages of membrane structures.pptxwendy cai
 

Recently uploaded (20)

(PRIYA) Rajgurunagar Call Girls Just Call 7001035870 [ Cash on Delivery ] Pun...
(PRIYA) Rajgurunagar Call Girls Just Call 7001035870 [ Cash on Delivery ] Pun...(PRIYA) Rajgurunagar Call Girls Just Call 7001035870 [ Cash on Delivery ] Pun...
(PRIYA) Rajgurunagar Call Girls Just Call 7001035870 [ Cash on Delivery ] Pun...
 
OSVC_Meta-Data based Simulation Automation to overcome Verification Challenge...
OSVC_Meta-Data based Simulation Automation to overcome Verification Challenge...OSVC_Meta-Data based Simulation Automation to overcome Verification Challenge...
OSVC_Meta-Data based Simulation Automation to overcome Verification Challenge...
 
Exploring_Network_Security_with_JA3_by_Rakesh Seal.pptx
Exploring_Network_Security_with_JA3_by_Rakesh Seal.pptxExploring_Network_Security_with_JA3_by_Rakesh Seal.pptx
Exploring_Network_Security_with_JA3_by_Rakesh Seal.pptx
 
Decoding Kotlin - Your guide to solving the mysterious in Kotlin.pptx
Decoding Kotlin - Your guide to solving the mysterious in Kotlin.pptxDecoding Kotlin - Your guide to solving the mysterious in Kotlin.pptx
Decoding Kotlin - Your guide to solving the mysterious in Kotlin.pptx
 
(ANJALI) Dange Chowk Call Girls Just Call 7001035870 [ Cash on Delivery ] Pun...
(ANJALI) Dange Chowk Call Girls Just Call 7001035870 [ Cash on Delivery ] Pun...(ANJALI) Dange Chowk Call Girls Just Call 7001035870 [ Cash on Delivery ] Pun...
(ANJALI) Dange Chowk Call Girls Just Call 7001035870 [ Cash on Delivery ] Pun...
 
Extrusion Processes and Their Limitations
Extrusion Processes and Their LimitationsExtrusion Processes and Their Limitations
Extrusion Processes and Their Limitations
 
Call Us -/9953056974- Call Girls In Vikaspuri-/- Delhi NCR
Call Us -/9953056974- Call Girls In Vikaspuri-/- Delhi NCRCall Us -/9953056974- Call Girls In Vikaspuri-/- Delhi NCR
Call Us -/9953056974- Call Girls In Vikaspuri-/- Delhi NCR
 
main PPT.pptx of girls hostel security using rfid
main PPT.pptx of girls hostel security using rfidmain PPT.pptx of girls hostel security using rfid
main PPT.pptx of girls hostel security using rfid
 
Analog to Digital and Digital to Analog Converter
Analog to Digital and Digital to Analog ConverterAnalog to Digital and Digital to Analog Converter
Analog to Digital and Digital to Analog Converter
 
(RIA) Call Girls Bhosari ( 7001035870 ) HI-Fi Pune Escorts Service
(RIA) Call Girls Bhosari ( 7001035870 ) HI-Fi Pune Escorts Service(RIA) Call Girls Bhosari ( 7001035870 ) HI-Fi Pune Escorts Service
(RIA) Call Girls Bhosari ( 7001035870 ) HI-Fi Pune Escorts Service
 
DJARUM4D - SLOT GACOR ONLINE | SLOT DEMO ONLINE
DJARUM4D - SLOT GACOR ONLINE | SLOT DEMO ONLINEDJARUM4D - SLOT GACOR ONLINE | SLOT DEMO ONLINE
DJARUM4D - SLOT GACOR ONLINE | SLOT DEMO ONLINE
 
High Profile Call Girls Nagpur Isha Call 7001035870 Meet With Nagpur Escorts
High Profile Call Girls Nagpur Isha Call 7001035870 Meet With Nagpur EscortsHigh Profile Call Girls Nagpur Isha Call 7001035870 Meet With Nagpur Escorts
High Profile Call Girls Nagpur Isha Call 7001035870 Meet With Nagpur Escorts
 
Call for Papers - African Journal of Biological Sciences, E-ISSN: 2663-2187, ...
Call for Papers - African Journal of Biological Sciences, E-ISSN: 2663-2187, ...Call for Papers - African Journal of Biological Sciences, E-ISSN: 2663-2187, ...
Call for Papers - African Journal of Biological Sciences, E-ISSN: 2663-2187, ...
 
Processing & Properties of Floor and Wall Tiles.pptx
Processing & Properties of Floor and Wall Tiles.pptxProcessing & Properties of Floor and Wall Tiles.pptx
Processing & Properties of Floor and Wall Tiles.pptx
 
Software Development Life Cycle By Team Orange (Dept. of Pharmacy)
Software Development Life Cycle By  Team Orange (Dept. of Pharmacy)Software Development Life Cycle By  Team Orange (Dept. of Pharmacy)
Software Development Life Cycle By Team Orange (Dept. of Pharmacy)
 
Introduction to Multiple Access Protocol.pptx
Introduction to Multiple Access Protocol.pptxIntroduction to Multiple Access Protocol.pptx
Introduction to Multiple Access Protocol.pptx
 
VIP Call Girls Service Hitech City Hyderabad Call +91-8250192130
VIP Call Girls Service Hitech City Hyderabad Call +91-8250192130VIP Call Girls Service Hitech City Hyderabad Call +91-8250192130
VIP Call Girls Service Hitech City Hyderabad Call +91-8250192130
 
Gfe Mayur Vihar Call Girls Service WhatsApp -> 9999965857 Available 24x7 ^ De...
Gfe Mayur Vihar Call Girls Service WhatsApp -> 9999965857 Available 24x7 ^ De...Gfe Mayur Vihar Call Girls Service WhatsApp -> 9999965857 Available 24x7 ^ De...
Gfe Mayur Vihar Call Girls Service WhatsApp -> 9999965857 Available 24x7 ^ De...
 
Porous Ceramics seminar and technical writing
Porous Ceramics seminar and technical writingPorous Ceramics seminar and technical writing
Porous Ceramics seminar and technical writing
 
What are the advantages and disadvantages of membrane structures.pptx
What are the advantages and disadvantages of membrane structures.pptxWhat are the advantages and disadvantages of membrane structures.pptx
What are the advantages and disadvantages of membrane structures.pptx
 

Improving engineering productivity_loss_zhao-dungan

  • 1. 2012 AACE INTERNATIONAL TRANSACTIONS CDR.980.1 CDR.980 Proving Engineering Productivity Loss Dr. Tong Zhao, PE PSP and J. Mark Dungan ABSTRACT—The measured mile/baseline method has been widely accepted to quantify labor productivity loss, but it has not been successfully used in engineering productivity because of the challenges in engineering productivity measurement and the determination of productivity benchmark. This paper presents a series of procedures based on the measured mile/baseline method to quantify engineering productivity loss from a project specific perspective. A case study on the piping discipline in a large scale process plant project is used to illustrate the calculation. The paper also includes a proposed approach, the two mile method, to quantify engineering productivity loss using data for similar work, but different complexity.
  • 2. 2012 AACE INTERNATIONAL TRANSACTIONS CDR.980.2 Table of Contents Abstract............................................................................................................................... 1 List of Tables ....................................................................................................................... 3 List of Figures ...................................................................................................................... 3 List of Equations.................................................................................................................. 3 Introduction ........................................................................................................................ 4 Measured Mile/Baseline Method and its Application in Construction.............................. 5 Engineering Productivity Measurement............................................................................. 6 Measured Mile/Baseline Method to Calculate Lost Engineering Productivity .................. 8 Case Study......................................................................................................................... 10 Two Mile Method to Quantify Engineering Productivity Loss with Complexity Difference .............................................................................................. 12 Conclusion......................................................................................................................... 16 References ........................................................................................................................ 17
  • 3. 2012 AACE INTERNATIONAL TRANSACTIONS CDR.980.3 List of Tables Table 1, Piping Productivity Data...................................................................................... 11 Table 2, Piping Design Productivity Baseline.................................................................... 11 Table 3, Piping Design Productivity Loss........................................................................... 12 List of Figures Figure 1 Correlation between Work Hours and Number of Lines in the Baseline ......................... 13 List of Equations Equation 1......................................................................................................................... 14 Equation 2......................................................................................................................... 14 Equation 3......................................................................................................................... 14 Equation 4......................................................................................................................... 14 Equation 5......................................................................................................................... 14 Equation 6......................................................................................................................... 14 Equation 7......................................................................................................................... 14 Equation 8......................................................................................................................... 15 Equation 9......................................................................................................................... 15
  • 4. 2012 AACE INTERNATIONAL TRANSACTIONS CDR.980.4 Introduction Proving or quantifying lost productivity is one of the most contentious and controversial areas in construction claims and disputes. It is a task that usually involves processing data for completed work and corresponding work hours, calculating productivity, establishing baseline, causation study, and measuring productivity loss. Although there may exist various methods to quantify productivity loss, the measured mile/baseline method by far is the most widely accepted for computing lost productivity in the construction industry. The original measured mile method determines the benchmark of the productivity achieved on identical activities in the same project. The productivity achieved on unimpacted sections was compared to the productivity achieved in sections where the work is known to be impacted. Responsibility for the difference in productivity is then assigned to the impacting party. Since it is not always possible to segregate an unimpacted area of work, the measured mile calculation has subsequently broadened to a baseline method. The baseline method also compares similar work activities, yet it allows for the comparison of lightly impacted areas to more heavily impacted areas. The lightly impacted portion is defined as the baseline set and although the baseline productivity rate may still contain lost productivity, it would allow the claimant to measure the productivity loss in the heavily impacted areas, and assign that loss to the responsible parties. In this paper, the authors use the broad meaning of “measured mile method,” and do not differentiate it from the baseline method. During the course of design and construction, changes and the ripple effect of multiple changes are one of the most important causes for engineering productivity loss. It is usually difficult to discretely quantify the productivity loss caused by cumulative impacts of multiple changes. Despite wide application and acceptance in proving labor productivity loss, the measured mile/baseline method has not been successfully applied to engineering productivity. The challenges lie in engineering productivity measurement and the determination of project specific productivity benchmarks. In this paper, the procedures specifically for measured mile/baseline calculation of engineering productivity are developed and the implementation is demonstrated by a case study, which proves that engineering productivity loss can be successfully quantified if the proposed procedures are followed to correctly measure productivity and determine the measured mile or baseline. To overcome the difficulties of finding engineering work at exactly the same complexity in a project, a broader approach, called the two mile method, is proposed to calculate engineering productivity loss based on the data from similar areas (segments, systems, components, units …) with different complexity by establishing a linear relationship between productivity and complexity. This paper not only contributes to the literature on engineering productivity loss calculation, also its practical significance is substantiated by offering viable approaches to quantify engineering productivity loss in litigation proceedings. Although this paper only focuses on the quantification of engineering productivity loss, the importance of cause and effect analysis, and responsibility allocation should not be ignored.
  • 5. 2012 AACE INTERNATIONAL TRANSACTIONS CDR.980.5 Productivity can be measured as the ratio between the units of work accomplished (output) and the units of time or efforts expended (input). In the literature, two inverse definitions were used: input/output, and output/input. In this paper, productivity is defined as the ratio of input to output, but the choice is a matter of personal preference. Measured Mile/Baseline Method and its Application in Construction Although the measured mile method has been widely used since 1986, the core fundamental of measured mile analysis originated much before that. In 1951, the measured mile method was successfully used in Maryland Sanitary Mfg. Co. v. US [20]. Researchers and professionals have developed and proposed systematic procedures for measured mile or baseline calculation [6, 12, 21, 22]. The general steps to perform measured mile/baseline calculation include processing data for production input and output, identification of units representing the completed work, computing the productivity by time periods or work sections, identification of measured mile or baseline, and using the difference between the impacted productivity and the measured mile/baseline to calculate productivity loss and damages. A systematic procedure for measured mile calculation as a method was introduced by Zink [21, 22]. The measured mile method compares the productivity in an umimpacted period of time with productivity in an impacted period of time in the same project. The procedures Zink proposed include the following. • Plot the actual labor worker-hours expended versus corresponding percentage of completion for the work; • Exclude the first and last 10% from the analysis; and, • Identify a linear or near linear portion showing the most efficient rate of progress in the 80% of the curve as the measured mile. The measured mile method, as originally proposed, requires that the portion of work used to calculate the measured mile must be free or essentially free of disruptions and continuous in time, which limits its application. In order to address the weaknesses in the measured mile method, Thomas and his collaborators introduced the baseline concept [12, 13, 15, 16, 17, 18, 19]. Thomas defined that a baseline period is a period of time when the best productivity is achieved, but its baseline procedure requires the baseline to be selected from the reporting periods with highest production [19]. The baseline period is not required to a continuous, unimpacted time frame, while the measured mile period has to be a consecutive set of time periods. The steps to determine a baseline proposed by Thomas and his collaborators can be summarized as follows. • Determine the total number of reporting periods; • The size of the baseline subset, n, is 10% of the total number of reporting periods and should not be less than 5; • The contents of the baseline subset are the n reporting periods that have the highest production or output; and, • The baseline is the median of productivity value in each reporting period or the quotient of total production divided by total input in the baseline subset.
  • 6. 2012 AACE INTERNATIONAL TRANSACTIONS CDR.980.6 In the attempt to overcome the shortcomings of having subjective percentage used in selecting the measured mile or baseline, Ibbs and Liu proposed a statistical clustering method to separate the productivity data into different groups [6]. The average value for the group with the best productivity would serve as the measured mile or baseline. Although Ibbs and Liu’s method could select the best baseline based on the available data, and was claimed to be more objective and neutral, the baseline selected by Ibbs and Liu’s method may include data points that does not represent the best-sustained productivity. Zink’s measured mile method requires that the measured mile needs to be in a period with a linear or near linear relationship between the expended labor hours and percent of work complete, which implies that the level of productivity should maintain in the period that is disruption free or nearly so. The assumption behind the baseline method proposed by Thomas for selecting the reporting periods with the highest production or output as the baseline period can be understood as that the disruption impact per output unit is relatively lower in the periods in which best production is achieved. Ibbs and Liu’s method employs a statistical clustering technique to segregate the periods with best productivity from all the others and uses the average as the baseline productivity, which implies that the baseline period is not necessarily continuous. In terms of baseline selection, Ibbs and Liu’s method may include unstained productivity data point into the baseline set, because no productivity of a reporting period outside the baseline period can be better than that in the baseline period when relying on this technique. Zink and Thomas’s procedures appear to seek the best-sustained productivity, and as a result, the reporting period with the highest productivity if not sustained would appear outside the measured mile/baseline set. Despite the differences among various procedures, the core of measured mile/baseline method is a comparison of productivity in an unimpacted or lightly impacted area with the productivity of similar work in an impacted area. The comparison relies on an unbiased baseline representing the best sustained productivity. Engineering Productivity Measurement Reliable labor productivity measurement is a crucial element of measured mile/baseline method to prove productivity loss in construction, and then reliable engineering productivity measurement is also crucial to the method’s application to proving engineering productivity loss. In spite of the awareness of the essentiality of engineering productivity, there have been only limited studies in engineering productivity measurement. Thomas and his co-authors proposed a conceptual model for measuring productivity on design and engineering, in which conversion factors and rule of credit were used to account for the differences of various work products in different stage of design engineering [14]. The application of this conceptual model is discouraged by the involvement of conversion factors and rule of credit, which are heavily affected by personal preference. The accuracy of the model is also compromised due to lack of an industry consensus on design document complexity.
  • 7. 2012 AACE INTERNATIONAL TRANSACTIONS CDR.980.7 The Engineering Productivity Measurement Research Team of Construction Industry Institue (CII), or Research Team 156 (RT 156), acknowledged that there was no standard measurement of productivity in the engineering phase for internal and external benchmarking [4]. CII RT 156 proposed to use measurable installed quantities for the measurement of design output. RT 156 conducted a detailed evaluation of the piping design process and found a good correlation between the engineering productivity measured as worker-hours spent per linear foot of piping and the number of equipment pieces in the piping systems. On the basis that engineering productivity is affected by project complexity, quality of input, quality of design output, RT 156 proposed a conceptual model for engineering productivity, in which engineering productivity is measured as engineering hours per installed quantity adjusted by three factors, input quality factor, scope and complexity factors, and design effectiveness factor. Song and others focused on the activities of steel drafting to characterize complexity factors for engineering productivity through literature review, interview and survey [10]. They proposed a neutral network model of engineering productivity quantification to facilitate project management using 17 project-level influence factors, including project type, contract type, piece cloning, etc. In contrast to project level factors, Song and AbouRizk proposed a conceptual scope definition method, quantitative engineering project scope definition (QEPSD), to measure engineering project scope quantitatively and quantify engineering complexity at the element level, such as number of fittings and drafted quantity for steel drafting [11]. In QEPSD, different design components are converted into the same design units using complexity functions, which may only exist conceptually. For the purpose of establishing a precise and reliable engineering productivity benchmarking in the construction industry, the CII Benchmarking and Metrics (BM&M) program developed the Engineering Productivity Metric System (EPMS), which included quantity-based metrics. BM&M proposed using direct work-hours as the input and issued for construction (IFC) quantities as the output to measure engineering productivity [7]. The EPMS includes a set of metrics hierarchically at multiple levels, including Level I (project), Level II (major category), Level III (sub-category), and Level IV (element). EPMS consists of six major categories, including concrete, steel, electrical, piping, instrumentation, and equipment. Engineering productivity was proposed to be measured at various levels and categories. BM&M collected engineering productivity data from 87 projects provided by 21 different owner and contractor companies and examined the engineering productivity in different categories and levels. BM&M also performed a correlation analysis between direct engineering work-hours and IFC design quantities on structural steel and piping, and found statistically significant bivariate relationships in those two categories. CII’s research effort also included the method to calculate a comprehensive index for productivity assessment at the project level based on the interdependencies among various disciplines and at different levels [8]. Other researches on engineering productivity include Chang and Ibbs and Ebrahimy and Rokni [2, 5]. Chang and Ibbs used a deliverable-based engineering productivity measure. They examined various engineering productivity factors, and highlighted two significant ones: phase involvement and project size. Ebrahimy and Rokni illustrated the expected values for existing metrics in the industry are dependent on the size of the projects.
  • 8. 2012 AACE INTERNATIONAL TRANSACTIONS CDR.980.8 In summary, although various attempts have been made to establish a standard measurement of engineering productivity and develop engineering productivity benchmarking for construction industry, the models and methods proposed by various researchers remain in a conceptual stage. Moreover, researchers still differ significantly in how to quantify the measurement of engineering output, but most researchers agree that engineering productivity is influenced by multiple factors, including project size and complexity, which could explain why a linear or close to linear relationship was not observed between engineering work-hours and output quantities based on the historical data from various projects. Measured Mile/Baseline Method to Calculate Lost Engineering Productivity Although a consensus on reliable engineering productivity measurement for construction industry has not been widely reached, it does not prevent the measured mile/baseline method from being an effective method to calculate engineering productivity loss. First, measured mile/baseline method has been a widely accepted method in the construction industry. Second, measured mile/baseline method is project specific, which is not influenced by the factors that differ from project to project. In the measured mile/baseline method for labor productivity, the measured mile/baseline is defined as the period of time during which the labor productivity was unimpacted or lightly impacted. This definition is not appropriate for engineering work. According to AIA Document B141 [1], design professionals provide services in five phases, schematic design, design development, construction document, bidding or negotiation, and construction or contract administration. For a design build project, the design and engineering work usually cover from design development, construction documents through the end of construction. The output for design professionals during the period from design development through the end of construction includes drawings, specifications, calculations, data sheets and others. The engineering efforts are also spent in both design and construction phases. The engineering output for a particular item in a project may go through multiple design revisions as the construction proceeds. Therefore, it is more appropriate to define the engineering measured mile/baseline as the area (segment, system, component, unit …) where engineering productivity was not impacted or lightly impacted. Loulakis and Santiago presented the following basic guidelines that should be followed in determining a measured mile for labor productivity [9]. • The work performed in the measured mile and the impacted period should be substantially similar in type, nature and complexity; • The composition and level of skill of crews should be comparable; and, • The above principles should also apply to the measured mile/baseline for engineering productivity. The output used for engineering productivity calculation needs to represent the scope of construction work that is designed and engineered. There are three different ways to quantify engineering output in literature:
  • 9. 2012 AACE INTERNATIONAL TRANSACTIONS CDR.980.9 Quantities of Engineering Documents [2][14] In order to account for the differences among various documents, conversion is needed to normalize the quantities, which compromises the reliability of this measurement because of the lack of a standard definition of complexity and content, and the use of CAD technology [3, 4, 11]. Although this approach is not preferred, the authors would not rule out the possibility that under some special circumstances, it may be appropriate to quantify engineering output with the mutual agreements between the parties in the project. Installed Quantities or the IFC Quantities CII used the installed quantities and the IFC quantities to measure engineering output. CII’s research indicates that significant correlation exists between expended engineering work-hours and engineering output measured with Installed quantities or the IFC quantities [4, 7]. Other Quantifiable Elements for the Scope of Work Song and others proposed to use the quantity of design items within a discipline, such as a beam or a window to measure engineering output [11]. Since this paper is focused on a general measured mile/baseline method for engineering productivity, engineering output quantification is not specified here, and it should be chosen depending on the data and the characteristics of the work to be designed and engineered. The measured mile/baseline calculation for engineering productivity can be performed using the following procedure: • Segregate the scope of engineering work into areas (segments, systems, components, units …). • Quantify work hours for each area (segment, system, component, unit …). • Quantify engineering output for each area (segment, system, component, unit …). • Calculate engineering productivity for each area (segment, system, component, unit …). • Identify unimpacted or lightly impacted areas (segments, systems, components, units …) as the measured mile/baseline subset. (This is generally determined by the magnitude of changes, modifications, or review oversight initiated by the owner or third parties, and the engineering effort required to address them) • The measured mile/baseline productivity is the productivity of the measured mile/baseline subset using total work-hours divided by the total quantities representing design output in the same subset. It is known that disruptions reduce productivity; therefore, it is natural to rule out disrupted areas (segments, systems, components, units …). The proposed method is only dependent on the causation study to determine the baseline, which is different from Zink’s measured mile procedure, Thomas’s baseline method, and Ibbs and Liu’s K-means clustering technique based approach. In order to test the quality of the baseline, a correlation analysis on the measured mile/baseline set may be performed. Furthermore, the above baseline selection and calculation should be corroborated by a cause-and-effect analysis to ascertain the causes for the productivity losses, and allocate the losses to the responsible parties.
  • 10. 2012 AACE INTERNATIONAL TRANSACTIONS CDR.980.10 Case Study The proposed measured mile/baseline method to calculate engineering productivity loss has been applied to a multi-hundred million dollar international project to design and build a process plant. The project experienced multiple owner responsible impacts, which caused tremendous cost overrun. The owner issued extensive change orders and the EPC contractor was paid for part of the direct cost of the changes estimated for the normal conditions, adding up to several hundred million dollars. There was, however, still millions of dollars in engineering that remained uncompensated, which could not be discretely captured in those change orders. During the course of the design and construction of the project, the owner and its representatives issued tens of thousands of design comments, the majority of which were owner changes. The measured mile/baseline method was used to quantify the engineering productivity loss, which was impossible to be captured discretely in the change orders, because of the cumulative impacts of numerous changes that the owner was responsible for. This case study is limited to the piping discipline to demonstrate the application of the proposed method. For confidentiality reason, productivity data used here was scaled and altered from the actual. The engineering work on piping is divided by various systems in the case study and the number of pipe lines is used to measure engineering output. Detailed project cost reports were evaluated to segregate and summarize direct work-hours on each system. Then the as built P&ID and isometrics were studied to identify the number of pipe lines in each system. The engineering productivity in this case study was defined as the work-hours spent on a pipe line. The direct work-hours, number of pipe lines, and calculated productivities are summarized in table 1.
  • 11. 2012 AACE INTERNATIONAL TRANSACTIONS CDR.980.11 System Name ID Direct Hours Number of Lines Hours Per Line Boiler Blowdown 140 5 28.0 Boiler Feedwater 340 7 48.6 Chemical A 20 1 20.0 Chemical B 730 24 30.4 Chemical C 190 2 95.0 Chemical D 10 1 10.0 Fire Protection Foam 190 4 47.5 Fire Water 26,870 144 186.6 Instrument Air 1,370 95 14.4 Liquid State Chemical B 19,690 90 218.8 Low Pressure Steam 7,550 350 21.6 Lube Oil 50 2 25.0 Process Water 1,000 44 22.7 Service Air 960 55 17.5 Service Water 7,005 275 25.5 Steam Condensate 7,600 330 23.0 Tempered Water 365 17 21.5 Waste Water 1,650 29 56.9 Table 1— Piping Productivity Data According to the contract, the design builder was required to prepare a 90% design, and then complete the IFC design upon the receipt of the owner’s comments on 90% design. In this case study, systems were segregated into those where the owner made fewer or no changes, and those where the owner made significant changes. The systems summarized in table 2 are those with little or no owner changes, so they were selected as the measured mile/baseline. The baseline productivity was calculated to be 22.2 hours per line. System Name Direct Hours Number of Lines Hours Per Line Boiler Blowdown 140 5 24.0 Chemical A 20 1 16.0 Chemical D 10 1 12.0 Instrument Air 1,370 95 14.4 Low Pressure Steam 7,550 350 22.3 Lube Oil 50 2 25.5 Process Water 1,000 44 23.0 Service Air 960 55 17.4 Service Water 7,005 275 25.1 Steam Condensate 7,600 330 23.0 Tempered Water 365 17 20.6 Total 26,070 1,175 22.2 Table 2— Piping Design Productivity Baseline
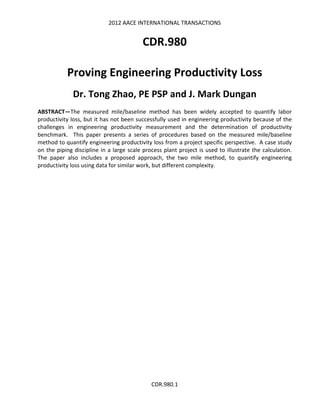
  • 12. 2012 AACE INTERNATIONAL TRANSACTIONS CDR.980.12 The remaining systems were determined to be the impacted, as either 90% design had to be redone due to modification by the owner or the IFC documents were revised multiple times because of the owner’s changes. The productivity loss calculation is summarized in table 3. In order to assess the quality of the measured mile/baseline subset, a correlation analysis between number of lines and work-hours expended is conducted for the subset, as shown in figure 1. The calculated correlation coefficient was 0.9869, which shows a significant linear relationship between the number of lines and work-hours expended in the case study. This indicates that in the case study, not only the number of lines is a good metric to quantify piping design and engineering, but also the selected measured mile/baseline has been proven to be consistently unimpacted or lightly impacted systems. System Name Direct Hours Number of Lines Hours Per Line Baseline Productivity Loss Boiler Feedwater 340 7 48.0 22.2 181 Chemical B 730 24 30.3 22.2 195 Chemical C 190 2 92.5 22.2 141 Fire Protection Foam 190 4 47.5 22.2 101 Fire Water 26,870 144 186.6 22.2 23,670 Liquid Chemical B 19,690 90 218.8 22.2 17,692 Waste Water 1,650 29 56.9 22.2 1,007 Table 3— Piping Design Productivity Loss
  • 13. 2012 AACE INTERNATIONAL TRANSACTIONS CDR.980.13 y = 23.114x - 98.96 R² = 0.9869 (1,000) - 1,000 2,000 3,000 4,000 5,000 6,000 7,000 8,000 9,000 0 50 100 150 200 250 300 350 400 EngineeringWork-Hours Number of Lines Two Mile Method to Quantify Engineering Productivity Loss with Complexity Difference The underlying premise for the measured mile/baseline method is comparison of identical or similar work with the same complexity. Unlike labor productivity, which can be isolated and sampled daily, weekly or monthly, sampling engineering productivity requires the whole life cycle of design and construction. The engineering effort on a particular area (segment, system, component, unit …) of the facility to be built does not end when the IFC documents are issued; instead the effort may continue until the construction is completed. Furthermore, it is impractical to record engineering work-hours for each installed unit of work. Engineering productivity sampling relies on the work break down in the project cost accounting system, and the time keeping efforts by every designer/engineer on the project. Even though it may be possible to measure engineering productivity for each dividable area (segment, system, component, or unit …) under a well designed project cost accounting system and with the diligent efforts for each engineering time keeper, the number of comparable areas (segments, systems, components, or units …) are often limited, and finding quantifiable engineering work with the same complexity is still very difficult. Therefore, although the concept of measured mile/baseline method is straightforward, the implementation in practice may be challenging because of the difficulties in finding the measured mile/baseline with the same complexity as the impacted. RT 156 of CII researched the relationship between piping engineering work hours and physical measurement of quantities, and concluded that equipment piece count represents the complexity of piping engineering [4]. RT 156 then formulated a linear relationship between the piping Figure 1 — Correlation Between Work Hours and Number of Lines in the Baseline
  • 14. 2012 AACE INTERNATIONAL TRANSACTIONS CDR.980.14 engineering productivity measured as work-hours per installed quantity and number of pieces of equipment in the piping discipline based on a regression analysis on the data from 40 projects. Hours/Feet of Piping ⋅+= 00134.044985.0 (Number of Pieces of Equipment) equation 1 The above finding by RT 156 of CII indicates that piping engineering productivity when measured as work hours per feet of piping is driven by the number of pieces of equipment, and the more pieces of equipment that are in the piping system, the more engineering hours are expended. This finding proved that it is a practical and reasonable assumption to model engineering productivity (P) as a linear function of a variable (C) that represents engineering complexity (complexity variable), or bCaP +⋅= equation 2 P = engineering productivity. C = the variable representing engineering complexity. a, b = parameters. If productivity and complexity information are available for two not impacted (or lightly impacted) areas (segments, systems, components, or units …), or bCaP +⋅= 11 equation 3 bCaP +⋅= 22 equation 4 then parameters a and b can be solved as 21 21 CC PP a − − = equation 5 21 1221 CC PCPC b − − = equation 6 Given the actual productivity P3,a per linear foot of piping and complexity C3 for an impacted area (segment, system, component, or unit …), the productivity that would have been without impacts (or lightly impacted) P3 is bCaP +⋅= 33 equation 7
  • 15. 2012 AACE INTERNATIONAL TRANSACTIONS CDR.980.15 or 21 1221 3 21 21 3 CC PCPC C CC PP P − − +⋅ − − = equation 8 Then the productivity loss on a linear foot of piping for the impact area is 3,3 PPP a −=Δ equation 9 Since data from two unaffected (or lightly impacted) areas (segments, systems, components, or units …) is needed to solve equations (3) and (4) for parameters a and b, this method is named the two mile method. If there are more than two unaffected areas (segments, systems, components, or units …) available in the unaffected set, or the measured mile/baseline set, least square regression is recommended to approximate the parameters a and b that would be representative. In fact, the size of the measured mile/baseline set should not be limited to 2, and it should include all the areas (segments, systems, components, or units …) that can be identified as unaffected or lightly impacted. The advantage of this method is that it makes it possible to calculate engineering productivity at different complexity with as few as two measured mile/baseline needed. The procedures to implement the two mile method, summarized below, are similar to the measured mile/baseline method, and are also very straightforward: • Segregate the scope of engineering work into areas (segments, systems, components, units …). • Quantify work hours for each area (segment, system, component, unit …). • Quantify engineering output for each area (segment, system, component, unit …). • Calculate engineering productivity for each area (segment, system, component, unit …). • Identify the complexity factor, and determine the complexity value for area (segment, system, component, unit …). • Determine all the unaffected or lightly impacted areas (segments, systems, components, units …) as the benchmark. • If there are only two areas (segments, systems, components, units …) in the benchmark subset, go to 8; if there are more than two areas (segments, systems, components, units …), go to 9. • Use Equations (5) and (6) to calculate parameters a and b, go to 10. • Use least square regression to determine parameters a and b. • Use Equations (8) and (9) to calculate productivity loss for a linear foot of piping in the impacted area (segment, system, component, unit …). And, • The total productivity loss for a given area (segment, system, component, unit …) is calculated as the product of the productivity loss per linear foot and the total pipe length in the area (segment, system, component, unit …).
  • 16. 2012 AACE INTERNATIONAL TRANSACTIONS CDR.980.16 Conclusion This paper has reviewed and summarized the measurement technique of engineering productivity, and applied the measured mile/baseline method to quantify engineering productivity loss for cumulative impacts of multiple disruptions, which are difficult to quantify discretely. The implementation has been demonstrated by a case study, which illustrates that project specific information can be successfully used to prove engineering productivity loss. In addition, in order to alleviate the difficulty of identify measured miles or baseline from areas (segments, systems, components, units …) with same complexity, a two mile method is proposed. The two mile method is designed to calculate engineering productivity loss for similar work with different complexity under the condition that engineering productivity is a linear function of engineering complexity. The proposed method is straightforward and easy to understand and use.
  • 17. 2012 AACE INTERNATIONAL TRANSACTIONS CDR.980.17 1. American Institute of Architects (AIA) Standard Form of Agreement Between Owner and Architect, AIA Document B141, AIA, Washington, DC, 1997. 2. Chang, A.S., and W. Ibbs. System Model for Analyzing Design Productivity, Journal of Management in Engineering, 22, 1 (2006): Pgs. 27-34. ASCE, Reston, VA. 3. Chang, L., M.E. Georgy, and L. Zhang. Engineering Productivity Measurement, Research Report 156-11 CII, Austin, TX, 2001. 4. Construction Industry Institute (CII). Engineering Productivity Measurement, CII Publication 156, CII, Austin, TX, 2001. 5. Ebrahimy, Y., and S. Rokni. Validity of Industry Benchmarks and Metrics for Engineering Productivity. Proceedings, Construction Research Congress, Banff, Canada, 2010. 6. Ibbs, W., and M. Liu. Improved Measured Mile Analysis Technique. Journal of Construction Engineering and Management, 131, 12 (2005): Pgs 1249-1256. ASCE, Reston, VA. 7. Kim, I. Development and Implementation of an Engineering Productivity Measurement System (EPMS) for Benchmarking. Ph.D. thesis, University of Texas, Austin, TX, 2007. 8. Liao, P.C. 2008 Influence Factors of Engineering Productivity and Their Impact on Project Performance, Ph.D. thesis, University of Texas, Austin, TX. 9. Loulakis, M.C., and S.J. Santiago. Getting the Most Out of Your “Measured Mile” Approach, Civil Engineering, 69, 11 (1999): Pgs. 69. ASCE, Reston, VA. 10. Song, L., M. Allouche, and S.M. AbouRizk. Measuring and Estimating Drafting Productivity, Proceedings. Construction Research Congress, Honolulu, HI, 2003. 11. Song, L., S.M. AbouRizk. Quantifying Engineering Project Scope for Productivity Modeling. Journal of Construction Engineering and Management, 131, 3 (2005): Pgs. 360-367. ASCE, Reston, VA. 12. Thomas, H.R., and I. Zavrski. Construction Baseline Productivity: Theory and Practice Journal of Construction Engineering and Management, 125, 5 (1999): Pgs. 295-303. ASCE, Reston, VA. 13. Thomas, H.R., D.R. Riley, and V.E. Sanvido. Loss of Labor Productivity Due to Delivery Methods and Weather. Journal of Construction Engineering and Management, 125, 1 (1999): Pgs. 39-46. ASCE, Reston, VA. 14. Thomas, H.R., Q.C. Korte, V.E. Sanvido, and M.K. Parfitt. Conceptual Model for Measuring Productivity of Design and Engineering. Journal of Architectural Engineering, 5, 1 (1999): Pgs. 1-7. ASCE, Reston, VA. 15. Thomas, H.R., and V.E. Sanvido. Quantification of Losses Caused by Labor Inefficiencies Where is the Elusive Measured Mile? Construction Law and Business, 1, 3 (2000): Pgs. 1-14. Aspen Law & Business, New York, NY. 16. Thomas, H.R., and V.E. Sanvido. Role of the Fabricator in Labor Productivity. Journal of Construction Engineering and Management, 126, 5 (2000): Pgs. 358-365. ASCE, Reston, VA. 17. Thomas, H.R., M.J. Horman, R.E. Minchin, and D. Chen. Improving Labor Flow Reliability for Better Productivity as Lean Construction Principle. Journal of Construction Engineering and Management, 129, 3 (2003): Pgs. 251-261. ASCE, Reston, VA. 18. Thomas, H.R., R.E. Minchin, and D. Chen. Improving Role of Workforce Management in Bridge Superstructure Labor Productivity. Journal of Management in Engineering, 19, 1 (2003): Pgs. 9-16. ASCE, Reston, VA.
  • 18. 2012 AACE INTERNATIONAL TRANSACTIONS CDR.980.18 19. Thomas, H.R. Quantification of Economics Losses Caused by Labor Inefficiencies. Proceedings. Construction Super Conference, San Francisco, CA, 2007. 20. Wickwire, J.M., T.J. Driscoll, and S.B. Hurlbut. Chapter 10, Calculating Contractor’s Damages, Construction Scheduling: Preparation, Liability, and Claims Implementing, First Edition, (1991):page 302, John Wiley & Sons, Inc., New York. 21. Zink, D.A. Impacts and Construction Inefficiency. AACE International Cost Engineering Journal, 32, 11 (1990): Pgs. 21-23. AACE International, Morgantown, WV. 22. Zink, D.A., The Measured Mile: Proving Construction Inefficiency Costs. AACE International Cost Engineering journal, 28, 4 (1986): Pgs. 19-21. AACE International, Morgantown, WV. Dr. Tong Zhao, PE PSP Delta Consulting Group, Inc. tzhao@delta-cqi.com J. Mark Dungan Delta Consulting Group, Inc. mdungan@delta-cqi.com