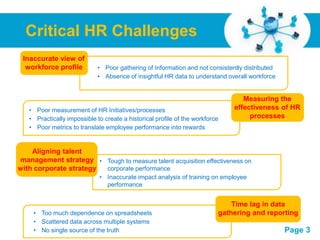
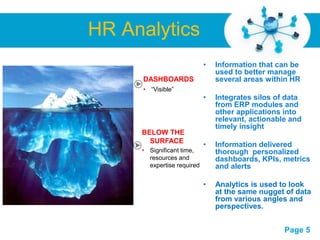
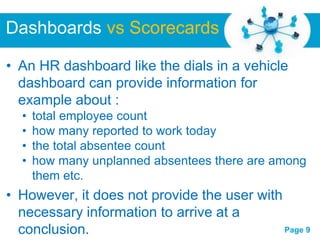
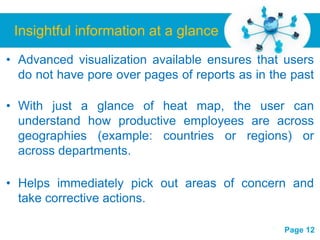
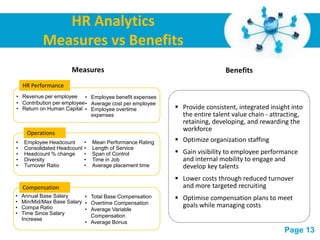
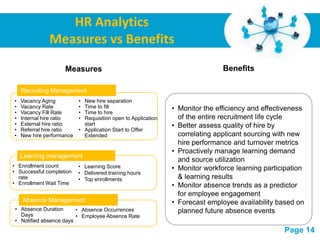
PPM Challenge #1: Prioritizing Demand – 2012 PPM Challenge and Opportunity We...EPM Live
2012 is quickly approaching and many organizations are preparing their portfolio strategies for the New Year. EPM Live recently partnered with Gartner in sponsoring the 2011 Gartner Symposium ITxpo. This week, Gartner published some of the key takeaways from the event and among them were a list of challenges that we as PPM supporters should look out for in 2012. The good news is ….with every challenge there is opportunity! Please join EPM Live as we lead you through a 4 part webinar series that focuses on these common Project Management challenges and leave you with the Enterprise Project management tools you need to create opportunity across your organization as you tackle these challenges one by one.
Challenge: Have you ever been asked to accomplish more than your technology and resources could handle? Prioritizing demand is not an easy task when there are many factors to consider: strategic objectives, benefits, risk factors and so on.
Opportunity: Join EPM Live as we walk you through the critical steps that must be taken to prioritize your 2012 Project Portfolio Management while taking into consideration the environmental factors that play a role in affecting the outcome. Find out how you can plan the most profitable portfolio for your organization while meeting all of your strategic goals. A profitable portfolio leads to a profitable business. Topics Include:
- Project and Work Requests
- Project and Work Definition
- Portfolio Capacity Planning
- Portfolio What-if Modeling
- Portfolio Selection
IT Project Portfolio Planning Using ExcelJerry Bishop
To provide a simple and transparent paper-based method for setting up an IT project portfolio using Excel.
Excel Workbook for this presentation also in my Slideshare uploads.
Realizing the Business Value of PPM - What to Expect When Implementing PPMEPM Live
Organizations who strive to improve their Project Portfolio Management (PPM) processes by leveraging a PPM tool are given a strategic advantage in today’s market.
Project Portfolio Management (PPM) is a set of business practices that bring projects together into tight integration with other business operations synchronizing strategies, resources and executive oversight. PPM provides the structure and processes for project portfolio governance.
Benefits of a PPM tool provide the organization a centralized location for stakeholders, PMs and project team members to easily view project portfolio items, resource demands, tasks, and project costs. It provides structure and standardization for project selection and execution and should be flexible to let users work the way that is most comfortable to them, improving user adoption and productivity. PPM solutions streamline collaboration between all invested personnel by providing easily accessible dashboards and reports and enabling more accurate and timely decision-making. Overall a good PPM solution provides the organization the toolset for selecting the right projects, improving ROI and creating a leading business edge.
In this advanced business analysis training session, you will learn RPA. Topics covered in this session are:
• What is RPA?
• Making Office Productive
• Consequences
• Automation
For more information, click here: https://www.mindsmapped.com/courses/business-analysis/advanced-business-analyst-training/
Want More Out of your SharePoint Environment? Extend your SharePoint Environm...EPM Live
SharePoint is the most common collaboration tool on the market today. It was common in the early adoption years to see SharePoint implementations that were intended for content management purposes only. Now, IT organizations are thinking outside of the box. If you must do more with less, what better way to protect your current investment and minimize costs then to leverage the same platform to bring Project Management, Product Development and Service Management to your IT organization?
Join us in a one hour webinar to learn how you can extend an underutilized SharePoint deployment into a full Enterprise project, product and service management solution. Topics includes:
- Common Uses of SharePoint
- SharePoint Deployment Best Practices
- SharePoint Recommendations
- Benefits of Centralization
- SharePoint for IT Planning and Control – Projects, Products and Services
Hard to believe I put this together over 11 years ago! It could have and should have been its own business and product line, actually, it became that! :) |
Executive Overview - Improving Performance Improvement |
Executives and Managers have the Responsibility of managing the performance-of and improvements-to: People, Process, Assets/Technology/$, & Information |
This Presentation’s Purpose: Define a more effective approach
for management to improve people’s performance. |
The market requirements are made up of four main things:
1) understanding high performance - a) capturing and b) analyzing performance metrics, and
2) teaching high performance - a) determining causes of high and low performance and b) driving high performance behaviors
Oracle Innovation Management - driving success through aligned InnovationFrancois Thierart
Innovation Management is the selection and translation of the best ideas and inventions into profitable offerings for customers.
The problem is not a shortage of ideas, but a breakdown in the selection and translation process, combined with the “pull of the past”.
Introduction to our public domain project to deliver a core portfolio, programme and project management data set. Portfolio, Programme and Project Management
Presenting a mental framework for strategic analysis of project portfolios in an organization. The example used is IT-Business alignment, but many components of this framework may be used in other applications.
Ambition PMO Focus Group
Sandra Arps, Agile PMO & Agile Transformation Consultant provides a step by step guide for evaluating and implementing a new Project & Portfolio Management Tool.
HR / Talent Analytics orientation given as a guest lecture at Management Institute for Leadership and Excellence (MILE), Pune. This presentation covers aspects like:
1. Core concepts, terminologies & buzzwords
- Business Intelligence, Analytics
- Big Data, Cloud, SaaS
2. Analytics
- Types, Domains, Tools…
3. HR Analytics
- Why? What is measured?
- How? Predictive possibilities…
4. Case studies
5. HR Analytics org structure & delivery model
Way before anyone began using the term BIG to describe data, Human Resources professionals had been using HR Metrics. So why is Big Data such a Big Deal? In this session, we will discuss HR Metrics, Big Data and HR Analytics.
We’ll uncover the real reasons you really need HR Analytics and dissect a few myths that could be holding you back from making the shift. We will then take a tactical approach diving into some practical tips and best practices on how you can get your organization up and running with HR analytics.
A storytelling session, exemplified through data, will cover everything from a talent strategy overhaul, to implementing emerging technologies, and how to tenaciously keep shaking things up - even when things don't go as planned.
Practical tips to start using predictive HR analytics in your organization.
Creating a distinction between HR Metrics, Big Data and Analytics.
Big Data progression and how this can affect your department.
Predictive Analytics for HR: A Primer to Get Started on your HR Analytics Jou...Dr Susan Entwisle
Traditionally, HR teams have made decisions on hiring, retaining, assigning and developing employees using intuition, experience, and basic descriptive statistical reports. Predictive analytics complements and extends on these approaches by enabling HR teams to make proactive ‘forward-looking’ data-driven decisions on its people across the employee lifecycle. Examples of this include gaining insights into the drivers and predicting who are our top performers, what employees are at risk of leaving, is our training program effective, and more. This capability can support HR teams to better align HR programs with strategic business goals.
This presentation outlines the limitations with current approaches and explain what predictive analytics is so business users can understand the business opportunity and problems it can be applied to. A number of case studies on its use across the employee lifecycle are described and guidance given on how to get started on your HR predictive analytics journey.
ASSIST Software Brochure.
ASSIST Software Romania specializes in outsourcing software development projects. Based in Eastern Europe, we are operating in a challenging economy that creates a fertile environment for Information Technology and business outsourcing. Our team has a solid and proven track record, delivering high quality and timely services.
Predicting your employee feelings with data scienceSankar Nagarajan
Predictive analytics of employee feelings and drivers . HR functions can gauge employee feelings (Affect Psychology) and the drivers behind them in an organisation . For instance Data science can reveal the reasons about dismal performance or attrition
This presentation shows how Predictive Analytics can be more futuristic than BI in using past events to predict the future.
Furthermore, we explore the best practices in Predictive Analytics, the challenges in deployment and how this solution can be used to create business value for the organization.
Presented by Ajay Gopikrishnan, our expert in Predictive Analytics and Data Mining at the BA4ALL (Business Analytics Insight 2014) event in the Netherlands.
http://www.capgemini.com/big-data-analytics
Softengi Software Development Company ProfileSoftengi
Softengi is a Ukrainian IT outsourcing service provider, which made its start in 1995, with more than 150 IT professionals daily implementing the business needs of our customers all over the world.
The company is The 2014 Global Outsourcing 100 ranked outsourcer, a member of Intecracy Group IT-consortium and Microsoft Gold certified partner.
Softengi's main competencies are outsourcing software development, establishment of development centers, outsourcing of IT business processes, IT consulting, development of solutions for business (based on Microsoft SharePoint), as well as providing customers its personnel for specific projects (IT-outstuffing).
Among Softengi’s customers there are such world-known companies as Enviance Inc. (cooperating with McDonalds, DuPont, Walmart, Chevron and FujiFilm), Ingersoll-Rand, the Boeing Company, Peterbilt Inc., PZU, Zeppelin and others.
Our exclusive value is “Inspired software engineering” – Softengi makes thoughtful solutions, being totally focused on customer’s expectations and turning into reality the business dreams of our clients.
The HR Business Partner is the most critical role in the modern HR Model. The HRBP is the employee, who acts as the single point of the contact for internal clients. However, the HRPB is not a pure sales person. The HRBP influences the work of Human Resources, participates in setting HR Goals and Objectives, leads difficult projects and collaborates with HR Centers of Excellence.
The role is critical, but many companies fail in choosing right employees for the position. The HR Business Partner has to be highly skilled and has to understand to all HR processes to sell them the right way.
Resource scheduling & capacity planning for project online webinar 25 oct18Mike Otranto
Resource management in an organization can be a challenge for any number of reasons. What if you had a more formal request and approval process that enabled greater visibility for resource managers into the allocation and capacity of their resources? Now you do – Resource Scheduling in Project Online.
Resource Scheduling provides functionality for both resource managers and project managers to enhance communication of resource assignments. Project managers request the needed resource and resource managers analyze and respond to the requests based on real information about other commitments the resource has already been committed to.
This webinar will show both the resource manager and project manager perspective in working with Resource Scheduling in Project Online. Join us and find out how you can get better control and visibility over your allocation and capacity using the new OnePlan for Resource Scheduling
Estimation is critical to IT demand management as today's senior IT executives deal with a familiar challenge - how to balance the size of the development team with the company's software wish list. Modern estimation techniques offer critical insight into this challenge. In this presentation, you will learn the ins and outs of estimation and how to effectively utilize estimation to ensure project success.
Building innovative digital platform dashboards to improve business and opera...Steve Ng
Presentation around “Building innovative digital platform dashboards to improve business and operational visibility and readiness” in the CIO/CISO Leaders Summit 2018 held on 28 Nov 2018 at Marina Bay Sands Singapore.
https://www.linkedin.com/feed/update/urn:li:activity:6473438094501777408/
Advanced Project Data Analytics for Improved Project DeliveryMark Constable
Data Analytics is already beginning to impact how projects are delivered. We can now automate minute taking and capturing actions, we can use Flow to progress chase, Power BI reduces the burden of reporting.
But we are just scratching the surface. It won’t be long before we can leverage the rich dataset of experience to predict what risks are likely to occur, understand which WBS elements will be susceptible to variance, deduce what the optimum resource profile looks like, define a schedule by leveraging data from those projects that have gone before.
The role of a project professional is about to change dramatically. In this webinar we will explore the challenges and opportunities, and how we should respond. It’s a call-to-action for the community to mobilise, help to reshape project delivery and understand the implications for you and your organisation.
Presenter Martin Paver is a Chartered Project Professional, APM Fellow and Chartered Engineer. In December 2017 he established the London Project Data Analytics meetup which has quickly spread across the UK and expanded to 3000+ members. Martin has major project experience including leading a $billion projects with a team of 220 and a multi-billion PMO with a team of 50. He has a detailed grasp of project management and combines this with a broad understanding of recent developments in the field of data science. He is on a mission to ensure that the project management profession readies itself for a transformed future.
Learning outcomes:
- Understand the implications of advanced data analytics on project delivery
- Understand the scope of which functions it is likely to impact
- Help you to develop a strategy for how you engage with it
- Understand how to leverage the benefits and opportunities that will emerge from it
Presenter:
Martin Paver, CEO & Founder, Projecting Success Ltd
In the past decade, the HR function has undergone a significant transformation. It has evolved from being a support function to a strategic business driver. Modern day HR’s can leverage plethora of data that to manage Employee Engagement. This presentation describes about BRIDGEi2i’s offering on Employee Engagement Analytics and how HR’s can leverage the data eco system to get granular insights for improving Employee Engagement
Project Server - Who can benefit from it and how?SPC Adriatics
Strict quantification of value provided by some software solution is very difficult. That’s especially true in the case of software which is supposed to increase value of project management discipline whose benefits are itself difficult to quantify. Difficulty to quantify doesn’t imply that such value doesn’t exist. It only means that we need to add an extra effort to recognize it.
The purpose of this presentation is to make that extra effort and, by examining different attributes like; industry, character and size of projects, maturity of the organization – recognize patterns that lead to value realization. The key Project Server capabilities will be discussed in context of how they provide value in specific usage scenarios.
As always, realized value have to be contrasted with required investment so we will estimate the cost of EPM implementation in on-premise and cloud model.
The target audience for the presentation are all of you who believe that projects could and should be better managed in your organizations, and you have a vote on decision on using software for such an improvement.
PPM Challenge #3: Providing Value to All Levels – 2012 PPM Challenge and Oppo...EPM Live
Challenge: Meeting stakeholder expectations is a challenge for most organizations. How do you keep stakeholders in the know with the current status of work and how do you prevent team members from making assumptions and more often than not, causing rework, due to a lack of project awareness? Keeping teams informed provides a healthy environment and reduces risks. Click through this webinar slide deck to see how EPM Live's SharePoint-based Project Management solution can help you meet your project deliverables.
What Does Agile Mean to the Modern PMOMike Otranto
Given that digital business require Agile PPM (bimodal IT), PMO leaders are challenged to adapt governance processes to cover new, agile Mode 2 efforts that are not from the same mold as “traditional” project management structures. The requirement of successfully delivering projects using multiple delivery approaches side-by-side is not just a possibility, it is a high probability.
How has Agile PPM (bimodal IT) impacted the PMO?
How are Agile PPM (bimodal IT) application projects different than traditional projects?
How should project management methods, strategies and techniques change to support digital PMO in bimodal IT organizations?
Project Server: Who can benefit from it and how?SPC Adriatics
Strict quantification of value provided by some software solution is very difficult. That’s especially true in the case of software which is supposed to increase value of project management discipline whose benefits are itself difficult to quantify. Difficulty to quantify doesn’t imply that such value doesn’t exist. It only means that we need to add an extra effort to recognize it.
The purpose of this presentation is to make that extra effort and, by examining different attributes like; industry, character and size of projects, maturity of the organization – recognize patterns that lead to value realization. The key Project Server capabilities will be discussed in context of how they provide value in specific usage scenarios.
As always, realized value have to be contrasted with required investment so we will estimate the cost of EPM implementation in on-premise and cloud model.
The target audience for the presentation are all of you who believe that projects could and should be better managed in your organizations, and you have a vote on decision on using software for such an improvement.
Igor Slišković
Five Attributes to a Successful Big Data StrategyPerficient, Inc.
The veracity, variety and sheer volume of data is increasing exponentially. With Hadoop and NoSQL solutions becoming commonplace, there are many technical options for managing and extracting value from this data. Many companies create labs to experiment with Big Data solutions, only later become IT playgrounds or unstructured dumping grounds.
To help avoid these pitfalls,companies with successful Big Data projects approach challenges by formulating a strategy that assures real business value is derived from their Big Data investments. In a Perficient poll, 73% of companies stated they are in the early-evaluation stage to find solutions to their Big Data problems and are only beginning to create their strategy.
Join us for a webinar featuring thought-provoking best practices used by successful companies to quickly realize business value from their Big Data investments. You'll learn:
The top five steps to increased business value
What the top companies are doing in Big Data that you need to know
Next steps to lay the ground work for a successful Big Data strategy
De-Mystifying ROI Calculation for SharePointsarahhaase
ROI is a "fancy" acronym for Return on Investment. While ROI implies success, it usually involves mysterious mathematical formulas that many people can't see or understand. So how does an everyday SharePoint business owner tackle the ROI puzzle? Do you just "flip the switch" on your implementation and move on? Or are you so busy with post-launch support that you don't have time to circle back and quantify your results?
This session will help you demonstrate the business value for your SharePoint implementation. We'll examine common ROI calculation methodologies while providing strategies for identifying your ROI niche and quantifying the business value of your SharePoint implementation.
Threats to mobile devices are more prevalent and increasing in scope and complexity. Users of mobile devices desire to take full advantage of the features
available on those devices, but many of the features provide convenience and capability but sacrifice security. This best practices guide outlines steps the users can take to better protect personal devices and information.
Goodbye Windows 11: Make Way for Nitrux Linux 3.5.0!SOFTTECHHUB
As the digital landscape continually evolves, operating systems play a critical role in shaping user experiences and productivity. The launch of Nitrux Linux 3.5.0 marks a significant milestone, offering a robust alternative to traditional systems such as Windows 11. This article delves into the essence of Nitrux Linux 3.5.0, exploring its unique features, advantages, and how it stands as a compelling choice for both casual users and tech enthusiasts.
DevOps and Testing slides at DASA ConnectKari Kakkonen
My and Rik Marselis slides at 30.5.2024 DASA Connect conference. We discuss about what is testing, then what is agile testing and finally what is Testing in DevOps. Finally we had lovely workshop with the participants trying to find out different ways to think about quality and testing in different parts of the DevOps infinity loop.
Maruthi Prithivirajan, Head of ASEAN & IN Solution Architecture, Neo4j
Get an inside look at the latest Neo4j innovations that enable relationship-driven intelligence at scale. Learn more about the newest cloud integrations and product enhancements that make Neo4j an essential choice for developers building apps with interconnected data and generative AI.
GridMate - End to end testing is a critical piece to ensure quality and avoid...ThomasParaiso2
End to end testing is a critical piece to ensure quality and avoid regressions. In this session, we share our journey building an E2E testing pipeline for GridMate components (LWC and Aura) using Cypress, JSForce, FakerJS…
Communications Mining Series - Zero to Hero - Session 1DianaGray10
This session provides introduction to UiPath Communication Mining, importance and platform overview. You will acquire a good understand of the phases in Communication Mining as we go over the platform with you. Topics covered:
• Communication Mining Overview
• Why is it important?
• How can it help today’s business and the benefits
• Phases in Communication Mining
• Demo on Platform overview
• Q/A
zkStudyClub - Reef: Fast Succinct Non-Interactive Zero-Knowledge Regex ProofsAlex Pruden
This paper presents Reef, a system for generating publicly verifiable succinct non-interactive zero-knowledge proofs that a committed document matches or does not match a regular expression. We describe applications such as proving the strength of passwords, the provenance of email despite redactions, the validity of oblivious DNS queries, and the existence of mutations in DNA. Reef supports the Perl Compatible Regular Expression syntax, including wildcards, alternation, ranges, capture groups, Kleene star, negations, and lookarounds. Reef introduces a new type of automata, Skipping Alternating Finite Automata (SAFA), that skips irrelevant parts of a document when producing proofs without undermining soundness, and instantiates SAFA with a lookup argument. Our experimental evaluation confirms that Reef can generate proofs for documents with 32M characters; the proofs are small and cheap to verify (under a second).
Paper: https://eprint.iacr.org/2023/1886
Why You Should Replace Windows 11 with Nitrux Linux 3.5.0 for enhanced perfor...SOFTTECHHUB
The choice of an operating system plays a pivotal role in shaping our computing experience. For decades, Microsoft's Windows has dominated the market, offering a familiar and widely adopted platform for personal and professional use. However, as technological advancements continue to push the boundaries of innovation, alternative operating systems have emerged, challenging the status quo and offering users a fresh perspective on computing.
One such alternative that has garnered significant attention and acclaim is Nitrux Linux 3.5.0, a sleek, powerful, and user-friendly Linux distribution that promises to redefine the way we interact with our devices. With its focus on performance, security, and customization, Nitrux Linux presents a compelling case for those seeking to break free from the constraints of proprietary software and embrace the freedom and flexibility of open-source computing.
In his public lecture, Christian Timmerer provides insights into the fascinating history of video streaming, starting from its humble beginnings before YouTube to the groundbreaking technologies that now dominate platforms like Netflix and ORF ON. Timmerer also presents provocative contributions of his own that have significantly influenced the industry. He concludes by looking at future challenges and invites the audience to join in a discussion.
Epistemic Interaction - tuning interfaces to provide information for AI supportAlan Dix
Paper presented at SYNERGY workshop at AVI 2024, Genoa, Italy. 3rd June 2024
https://alandix.com/academic/papers/synergy2024-epistemic/
As machine learning integrates deeper into human-computer interactions, the concept of epistemic interaction emerges, aiming to refine these interactions to enhance system adaptability. This approach encourages minor, intentional adjustments in user behaviour to enrich the data available for system learning. This paper introduces epistemic interaction within the context of human-system communication, illustrating how deliberate interaction design can improve system understanding and adaptation. Through concrete examples, we demonstrate the potential of epistemic interaction to significantly advance human-computer interaction by leveraging intuitive human communication strategies to inform system design and functionality, offering a novel pathway for enriching user-system engagements.
Essentials of Automations: The Art of Triggers and Actions in FMESafe Software
In this second installment of our Essentials of Automations webinar series, we’ll explore the landscape of triggers and actions, guiding you through the nuances of authoring and adapting workspaces for seamless automations. Gain an understanding of the full spectrum of triggers and actions available in FME, empowering you to enhance your workspaces for efficient automation.
We’ll kick things off by showcasing the most commonly used event-based triggers, introducing you to various automation workflows like manual triggers, schedules, directory watchers, and more. Plus, see how these elements play out in real scenarios.
Whether you’re tweaking your current setup or building from the ground up, this session will arm you with the tools and insights needed to transform your FME usage into a powerhouse of productivity. Join us to discover effective strategies that simplify complex processes, enhancing your productivity and transforming your data management practices with FME. Let’s turn complexity into clarity and make your workspaces work wonders!
Dr. Sean Tan, Head of Data Science, Changi Airport Group
Discover how Changi Airport Group (CAG) leverages graph technologies and generative AI to revolutionize their search capabilities. This session delves into the unique search needs of CAG’s diverse passengers and customers, showcasing how graph data structures enhance the accuracy and relevance of AI-generated search results, mitigating the risk of “hallucinations” and improving the overall customer journey.
Removing Uninteresting Bytes in Software FuzzingAftab Hussain
Imagine a world where software fuzzing, the process of mutating bytes in test seeds to uncover hidden and erroneous program behaviors, becomes faster and more effective. A lot depends on the initial seeds, which can significantly dictate the trajectory of a fuzzing campaign, particularly in terms of how long it takes to uncover interesting behaviour in your code. We introduce DIAR, a technique designed to speedup fuzzing campaigns by pinpointing and eliminating those uninteresting bytes in the seeds. Picture this: instead of wasting valuable resources on meaningless mutations in large, bloated seeds, DIAR removes the unnecessary bytes, streamlining the entire process.
In this work, we equipped AFL, a popular fuzzer, with DIAR and examined two critical Linux libraries -- Libxml's xmllint, a tool for parsing xml documents, and Binutil's readelf, an essential debugging and security analysis command-line tool used to display detailed information about ELF (Executable and Linkable Format). Our preliminary results show that AFL+DIAR does not only discover new paths more quickly but also achieves higher coverage overall. This work thus showcases how starting with lean and optimized seeds can lead to faster, more comprehensive fuzzing campaigns -- and DIAR helps you find such seeds.
- These are slides of the talk given at IEEE International Conference on Software Testing Verification and Validation Workshop, ICSTW 2022.
Sudheer Mechineni, Head of Application Frameworks, Standard Chartered Bank
Discover how Standard Chartered Bank harnessed the power of Neo4j to transform complex data access challenges into a dynamic, scalable graph database solution. This keynote will cover their journey from initial adoption to deploying a fully automated, enterprise-grade causal cluster, highlighting key strategies for modelling organisational changes and ensuring robust disaster recovery. Learn how these innovations have not only enhanced Standard Chartered Bank’s data infrastructure but also positioned them as pioneers in the banking sector’s adoption of graph technology.
GraphSummit Singapore | The Future of Agility: Supercharging Digital Transfor...Neo4j
Leonard Jayamohan, Partner & Generative AI Lead, Deloitte
This keynote will reveal how Deloitte leverages Neo4j’s graph power for groundbreaking digital twin solutions, achieving a staggering 100x performance boost. Discover the essential role knowledge graphs play in successful generative AI implementations. Plus, get an exclusive look at an innovative Neo4j + Generative AI solution Deloitte is developing in-house.
The Art of the Pitch: WordPress Relationships and SalesLaura Byrne
Clients don’t know what they don’t know. What web solutions are right for them? How does WordPress come into the picture? How do you make sure you understand scope and timeline? What do you do if sometime changes?
All these questions and more will be explored as we talk about matching clients’ needs with what your agency offers without pulling teeth or pulling your hair out. Practical tips, and strategies for successful relationship building that leads to closing the deal.
Secstrike : Reverse Engineering & Pwnable tools for CTF.pptx
Bryne
1. HR Analytics & Predictive Modeling
From data to action based on insight…
Free Powerpoint Templates
Page 1
6th March 2012
2. Agenda
• Critical HR Challenges and the need for
Insight
• What is Analytics?
• Benefits of HR Analytics
• Predictive Modeling
• HR Analytics Demo
Free Powerpoint Templates
Page 2
3. Critical HR Challenges
Inaccurate view of
workforce profile • Poor gathering of Information and not consistently distributed
• Absence of insightful HR data to understand overall workforce
Measuring the
• Poor measurement of HR Initiatives/processes effectiveness of HR
• Practically impossible to create a historical profile of the workforce processes
• Poor metrics to translate employee performance into rewards
Aligning talent
management strategy • Tough to measure talent acquisition effectiveness on
with corporate strategy corporate performance
• Inaccurate impact analysis of training on employee
performance
Time lag in data
• Too much dependence on spreadsheets gathering and reporting
• Scattered data across multiple systems
Free Powerpoint Templates
• No single source of the truth Page 3
5. HR Analytics
• Information that can be
used to better manage
DASHBOARDS several areas within HR
• “Visible”
• Integrates silos of data
from ERP modules and
other applications into
relevant, actionable and
timely insight
BELOW THE
SURFACE
• Information delivered
• Significant time, thorough personalized
resources and dashboards, KPIs, metrics
expertise required and alerts
• Analytics is used to look
at the same nugget of data
from various angles and
perspectives.
Free Powerpoint Templates
Page 5
6. Understand the Business Impact of HCM
Issues in Real-Time
What You Can Do So You
• Provide Reasoning and Level of • Know Before Hand
Impact • Have Time to React
• Compare Employee - Potential • Understand the Impact
Performance & Retention • Have an Integration Through
• “What If” Analysis Out
• Execute Organization or Worker • Get Smarter
changes • Use it Today
• Embed into Transactional
Applications
Free Powerpoint Templates
Page 6
7. An example..
Planning System
Time reporting system
Payroll system
Project
Costing &
Resource
Work Planning
Logs
Employee
Costs
Employee Utilisation (which employees are underutilised, overutilised etc.)
Impacts to project costing when project scope or timeline changes
Provide more accurate analysis of project costing to help develop better estimation models
Free Powerpoint Templates
Page 7
8. Analytics
• Business Intelligence/Data Warehousing and
Analytics - used to understand trends/patterns
in data and gather information about behaviour
and causal relationships.
• Analytics comes in various shapes, forms and
sizes – some of the most popular forms are
the dashboards and scorecards.
Free Powerpoint Templates
Page 8
9. Dashboards vs Scorecards
• An HR dashboard like the dials in a vehicle
dashboard can provide information for
example about :
• total employee count
• how many reported to work today
• the total absentee count
• how many unplanned absentees there are among
them etc.
• However, it does not provide the user with
necessary information to arrive at a
Free Powerpoint Templates
conclusion. Page 9
10. Dashboards vs Scorecards
• A Scorecard uses a set of pre-defined rules and
metrics to determine the state of health of a
company.
• For example : If the attrition rate goes above 8% it
shows as red in the scorecard prompting the user to
take action.
• Some leading vendors have analytic applications that
come packaged with predefined metrics, database
models and reports that make the implementation of
analytic solutions easier..
Free Powerpoint Templates
Page 10
11. Example of Analytic Workflow
A typical analytic work flow starts with a prompt
like the scorecard turning red for more than
allowable attrition rates.
In the previous example, to illustrate the analytic
workflow, the user starts with the scorecard, then
drills down to the next level to see that most of the
people quitting belong to a certain department and
a project.
Upon further analysis it is apparent that most of
the people who have quit in the past couple of
weeks have been working long hours for
several months and thus had very low morale.
The project has been running over budget and
beyond expected deadline.
To arrest the attrition the Manager takes action
to either shut thePowerpoint Templates more
Free project down or add
people to the project to help close it. Page 11
12. Insightful information at a glance
• Advanced visualization available ensures that users
do not have pore over pages of reports as in the past
• With just a glance of heat map, the user can
understand how productive employees are across
geographies (example: countries or regions) or
across departments.
• Helps immediately pick out areas of concern and
take corrective actions.
Free Powerpoint Templates
Page 12
13. HR Analytics
Measures vs Benefits
Measures Benefits
HR Performance
• Revenue per employee • Employee benefit expenses
• Contribution per employee • Average cost per employee
• Return on Human Capital • Employee overtime Provide consistent, integrated insight into
expenses the entire talent value chain - attracting,
retaining, developing, and rewarding the
workforce
Operations
• Employee Headcount • Mean Performance Rating Optimize organization staffing
• Consolidated Headcount • Length of Service
• Headcount % change • Span of Control Gain visibility to employee performance
• Diversity • Time in Job and internal mobility to engage and
• Turnover Ratio • Average placement time develop key talents
Lower costs through reduced turnover
Compensation and more targeted recruiting
• Annual Base Salary • Total Base Compensation Optimise compensation plans to meet
• Min/Mid/Max Base Salary • Overtime Compensation
• Compa Ratio goals while managing costs
• Average Variable
• Time Since Salary Compensation
Increase
• Average Bonus
Free Powerpoint Templates
Page 13
14. HR Analytics
Measures vs Benefits
Measures Benefits
Recruiting Management
• Vacancy Aging • New hire separation
• Vacancy Rate • Time to fill • Monitor the efficiency and effectiveness
• Vacancy Fill Rate • Time to hire
• Internal hire ratio • Requisition open to Application of the entire recruitment life cycle
• External hire ratio start • Better assess quality of hire by
• Referral hire ratio • Application Start to Offer
• New hire performance Extended correlating applicant sourcing with new
hire performance and turnover metrics
• Proactively manage learning demand
Learning management
and source utilization
• Enrollment count • Learning Score
• Successful completion
• Monitor workforce learning participation
• Delivered training hours
rate • Top enrollments & learning results
• Enrollment Wait Time • Monitor absence trends as a predictor
for employee engagement
Absence Management • Forecast employee availability based on
• Absence Duration • Absence Occurrences planned future absence events
Days • Employee Absence Rate
• Notified absence days
Free Powerpoint Templates
Page 14
16. Workforce Intelligence – Understanding the
Evolution
Analytics Description
Descriptive Those which summarize and compare operational and/or financial data on key workforce variables within
Reporting defined timeframes.
Examples: totals, averages, percentages and trends. These are used primarily to create lagging indicators
Retrospective Those which apply one or two internal data sources to derive useful information.
Analytics
Example: The past education experience of job candidates is compared to job performance during the first
year of employment.
These are used to create both lagging indicators, performance benchmarks and insights.
Predictive Mathematical models that use multiple internal and external data sources to predict future
Analytics workforce events.
Example: A predictive model that uses internal and external employee level data to predict
the likelihood that a particular employee will resign in the next six months and supply the
reasons for the prediction
These are used to create leading indicators and focus limited resources on small segments of
the employee population where the impact is likely to create the greatest benefit.
Free Powerpoint Templates
Page 16
17. What is Predictive Modeling?
– Predictive analytics uses available internal
and external data to predict future events at
the customer or employee level.
– Value is created by focusing limited
resources on the right customers/employees
at the right time resulting in improved
outcomes.
Free Powerpoint Templates
Page 17
18. WHAT-IF Analysis
• Predictive modeling techniques can be applied on top
of analytic tools to perform „WHAT-IF?” analysis to
help even predict what the future may have in hold.
• For example while designing a hiring campaign the
HR manager can adjust the various knobs and levers
like acceptance rate, education level, compensation,
etc which will not only help him design the campaign
but also can tell him the rate of head count growth
and thus allowing him Powerpoint Templates future.
Free
to plan for the
Page 18
19. Predictive Analytics – opportunities
Predictive analytics can generate key insights on where the
improvement opportunities exist, enabling the development of
strategies to maximize employee lifetime value
Characteristics of Application Opportunities Questions to Address
Predictive Analytics
Recruiting and hiring new What are the characteristics
Predictive analytics uses
employees of successful employees ?
available internal and external
data to predict future events Optimizing performance What are the attributes of
at the customer or employee management high-performing
level. employees?
Improving employee Which employees are at
Value is created by focusing
retention greater risk for leaving?
limited resources on the right
employees at the right time, What is the economic value
resulting in improved of reducing employee
outcomes. turnover?
Quantifying the value of What impact do training
training investments investments have on sales
performance?
Free Powerpoint Templates
Page 19
21. Typical HR Analytics Suite
9 Dashboards, 45 Dashboard Pages,
238 Reports, 400 Metrics
Functional Area Sample Metrics Metrics
Headcounts (Full-time employees, by roles),
Absence 32
Tenure related etc
Salary Ranges, Comparisons, Bonus
Compensation 90
Comparisons, time since last raise etc.
Learning Average enrollments, scores, completions etc 16
Performance metrics across grades, geography,
Performance 37
ethnicity, direct & indirect etc.
Applicant metrics, interview scores, service
Recruitment 130
milestones, offers vs acceptance ratios etc.
Promotion ratios, Satisfaction measures, rehires,
Workforce Profiles 95
avg service lengths etc.
Total 400
Free Powerpoint Templates
Page 21
22. System aspects
• BI tools nowadays have prebuilt dashboard pages which have
prebuilt interface to Tier 1 ERP applications.
• The Analytics suite could be implemented in about 6 to 8
weeks for an organization with 1000 employees.
• Emerging trends in Talent management which includes
performance and goal management, Talent review process
(9 box grid), workforce predictions, succession planning are
available in some of these applications.
• Talent management with embedded analytics is being
implemented by global organizations through a cloud model
(SaaS), where customer can utilize the service Pay as you
use model. There is no need to buy licenses and minimal
implementation effort is involved.
Free Powerpoint Templates
Page 22
23. HR Analytics vis-à-vis typical HRMS
reporting
HRMS Reporting Analytics Reporting
Flat – 2 dimensional Multi dimensional
Individual reports which need to be Metrics go across subject areas
collated
Reactive reporting Pro-active reporting
Need to define “what to see” Pre defined Metrics based on best
practices available
Report is from a single source Reporting can include non HRMS
sources as well
Metric definition is not Metric definition is consistent across the
standardized enterprise
Free Powerpoint Templates
Page 25
27. Oracle Fusion Performance
Management
For Business Leaders
• Monitor process
• Monitor guideline compliance
For Managers
• Easy to keep track
• Easy to complete
For Employees
• Know what‟s expected of me
• Easy to do
Free Powerpoint Templates
Page 29
31. Goal Management
For Business Leaders
• Set direction
• Ensure alignment
For Managers
• Assign targets
• Monitor progress
For Employees
• Tie goals to what matters
• Communicate progress
Free Powerpoint Templates
Page 33
32. Compensation Management
Make Every Compensation Decision Count
Free Powerpoint Templates
Page 34
33. Compensation Management
Make Every Compensation Decision Count
Free Powerpoint Templates
Page 35
34. Compensation Management
Make Every Compensation Decision Count
Free Powerpoint Templates
Page 36
35. Compensation Management
Make Every Compensation Decision Count
For HR Comp Analysts
• Enforce wide range of
business rules
• Model budget and
compensation scenarios
• Analyze, model and allocate
compensation across borders
and boundaries
For Managers
• Validate decisions with alerts
and summaries
• Research allocations with
real-time analytics
• Configure worksheet
according to personal
workstyle
Free Powerpoint Templates
Page 37
36. Compensation
Average income per employee
• This would help us evaluate how the average income of our company compares with the
market standards. We could group it with Position/Job/Performance bands for comparison
with market standards.
Comparative Ratio
• Compa ratio describes the individual's position in the pay range against the pay policy
reference point for the range and can be used to reposition an individual's pay in the range if it
is too high or low.
Compensation as percentage of Sales
• Helps compare compensation across departments with their sales output thereby ensuring
that the high performing departments are suitably rewarded.
Variable pay as percentage of compensation
• This helps us in knowing the variable component (commissions) paid as a percentage of the
total compensation.
Over Time Pay as percentage of compensation
• This will indicate the Overtime efforts put in, and combined with the sales KPI could indicate
under staffing in particular departments.
Free Powerpoint Templates
Page 38
37. Attrition
Employee turnover percentage
This KPI would indicate whether the total terminations have improved/worsened or within permissible limits.
Merging it would other tradition KPIs like Sales output of a department would help us understand the how the
productivity is affected by these terminations.
Voluntary turnover percentage
Voluntary terminations refer to those initiated by the employees, these kinds of terminations harms the
Organization.
Involuntary turnover percentage
Involuntary terminations refer to those initiated by the Organization. This could be coupled with other traditional
KPIs to improve recruiting procedures and minimize involuntary terminations.
Average period of service of employees who resign
This KPI helps us understand service bands of the employees leaving the organization and plan the replacements
accordingly. Suitable retention plans can be developed improved if we know which category of people we are at a
higher risk of losing.
Top Performer Voluntary turnover
Losing top performer is always a concern. Knowing the top performers and the reasons/department/supervisor we
have lost them will help prevent such cases in the future.
Productivity turnover rate per department
This coupled with the turnover rate will help us understand the loss of productivity caused due to terminations.
Free Powerpoint Templates
Page 39
38. Performance
Sales turnover
• This KPI will indicate if the sales turnover has been in an uptrend or downtrend.
Sales turnover per employee
• This KPI will help us understand the top performing departments. A higher value is always
preferable but it could also indicate under staffing in certain scenarios.
Profit per employee
• This KPI will be quite similar to the one mentioned above, but it will help us locate areas
where higher sales is not translating to higher profits. It possibly indicates higher
expenditure which needs to be controlled.
Administration cost per employee
• This KPI will reveal a major expense namely labour cost involved. A combination of all
these KPIs will reveal if the employees of high performing departments are suitable
rewarded.
Labour cost as percentage of sales
• This KPI shows the labour cost as a percentage of sales.
Free Powerpoint Templates
Page 40
39. Retention
At Risk top performer count
• It’s important to know the top performers whom we are at a risk of losing. The KPI will be
calculated based on the values of compa ratio and performance ratings of an employee.
Percentage Average Satisfaction
• This KPI will indicate if employees are satisfied with the work environment. A detailed
report can be created that help us find the reasons for dissatisfaction if any (work life
balance, overtime hours, compensation etc).
Average increase in compensation
• It will help us understand if employee’s efforts are suitable rewarded in a timely manner.
Training programme enrollments per employee
• It will help us understand if employees are getting a chance to upgrade skills for career
progression, could be an indicator for assessing voluntary turnover.
Overtime Hours
• If the employees have to consistently put in extra efforts to meet the targets, it could be
because of labour constraints. If not fixed appropriately it might lead to voluntary
turnovers. Free Powerpoint Templates
Page 41
40. Diversity
Contingent worker as a percentage of total workforce
• Indicates the composition of contract workers in the organization.
Full Time workers as a percentage of total workforce
• Indicates the percentage of Full Time workers in the workforce.
Headcount
• Headcount metric could be used with a variety of dimension columns to
understand the diversity in the workforce. To name some -
– Nationality/Ethnicity
– Gender
– Skill
– Educational Qualification
– Age Band
– Service Band
– Performance band Free Powerpoint Templates
Page 42
41. Oracle Fusion Talent Review
Maximize the Value of Leadership Meetings
Free Powerpoint Templates
Page 43
43. Oracle Fusion Workforce Predictions
Proactively Identifying Potential Issues and Taking Action
Value for Managers
• Understand
organizational impacts
real time, take early
corrective action
Value for HR
Professionals
• Monitor global
conditions and take
early corrective action
• Guided through taking
the right corrective
action
Free Powerpoint Templates
Page 45