Download to read offline
![IJRET: International Journal of Research in Engineering and Technology eISSN: 2319-1163 | pISSN: 2321-7308
_______________________________________________________________________________________
Volume: 05 Issue: 01 | Jan-2016, Available @ http://www.ijret.org 75
Fig -5: V/C Ratio of Link Segments
Fig -6: Level of Service on I-94 Eastbound
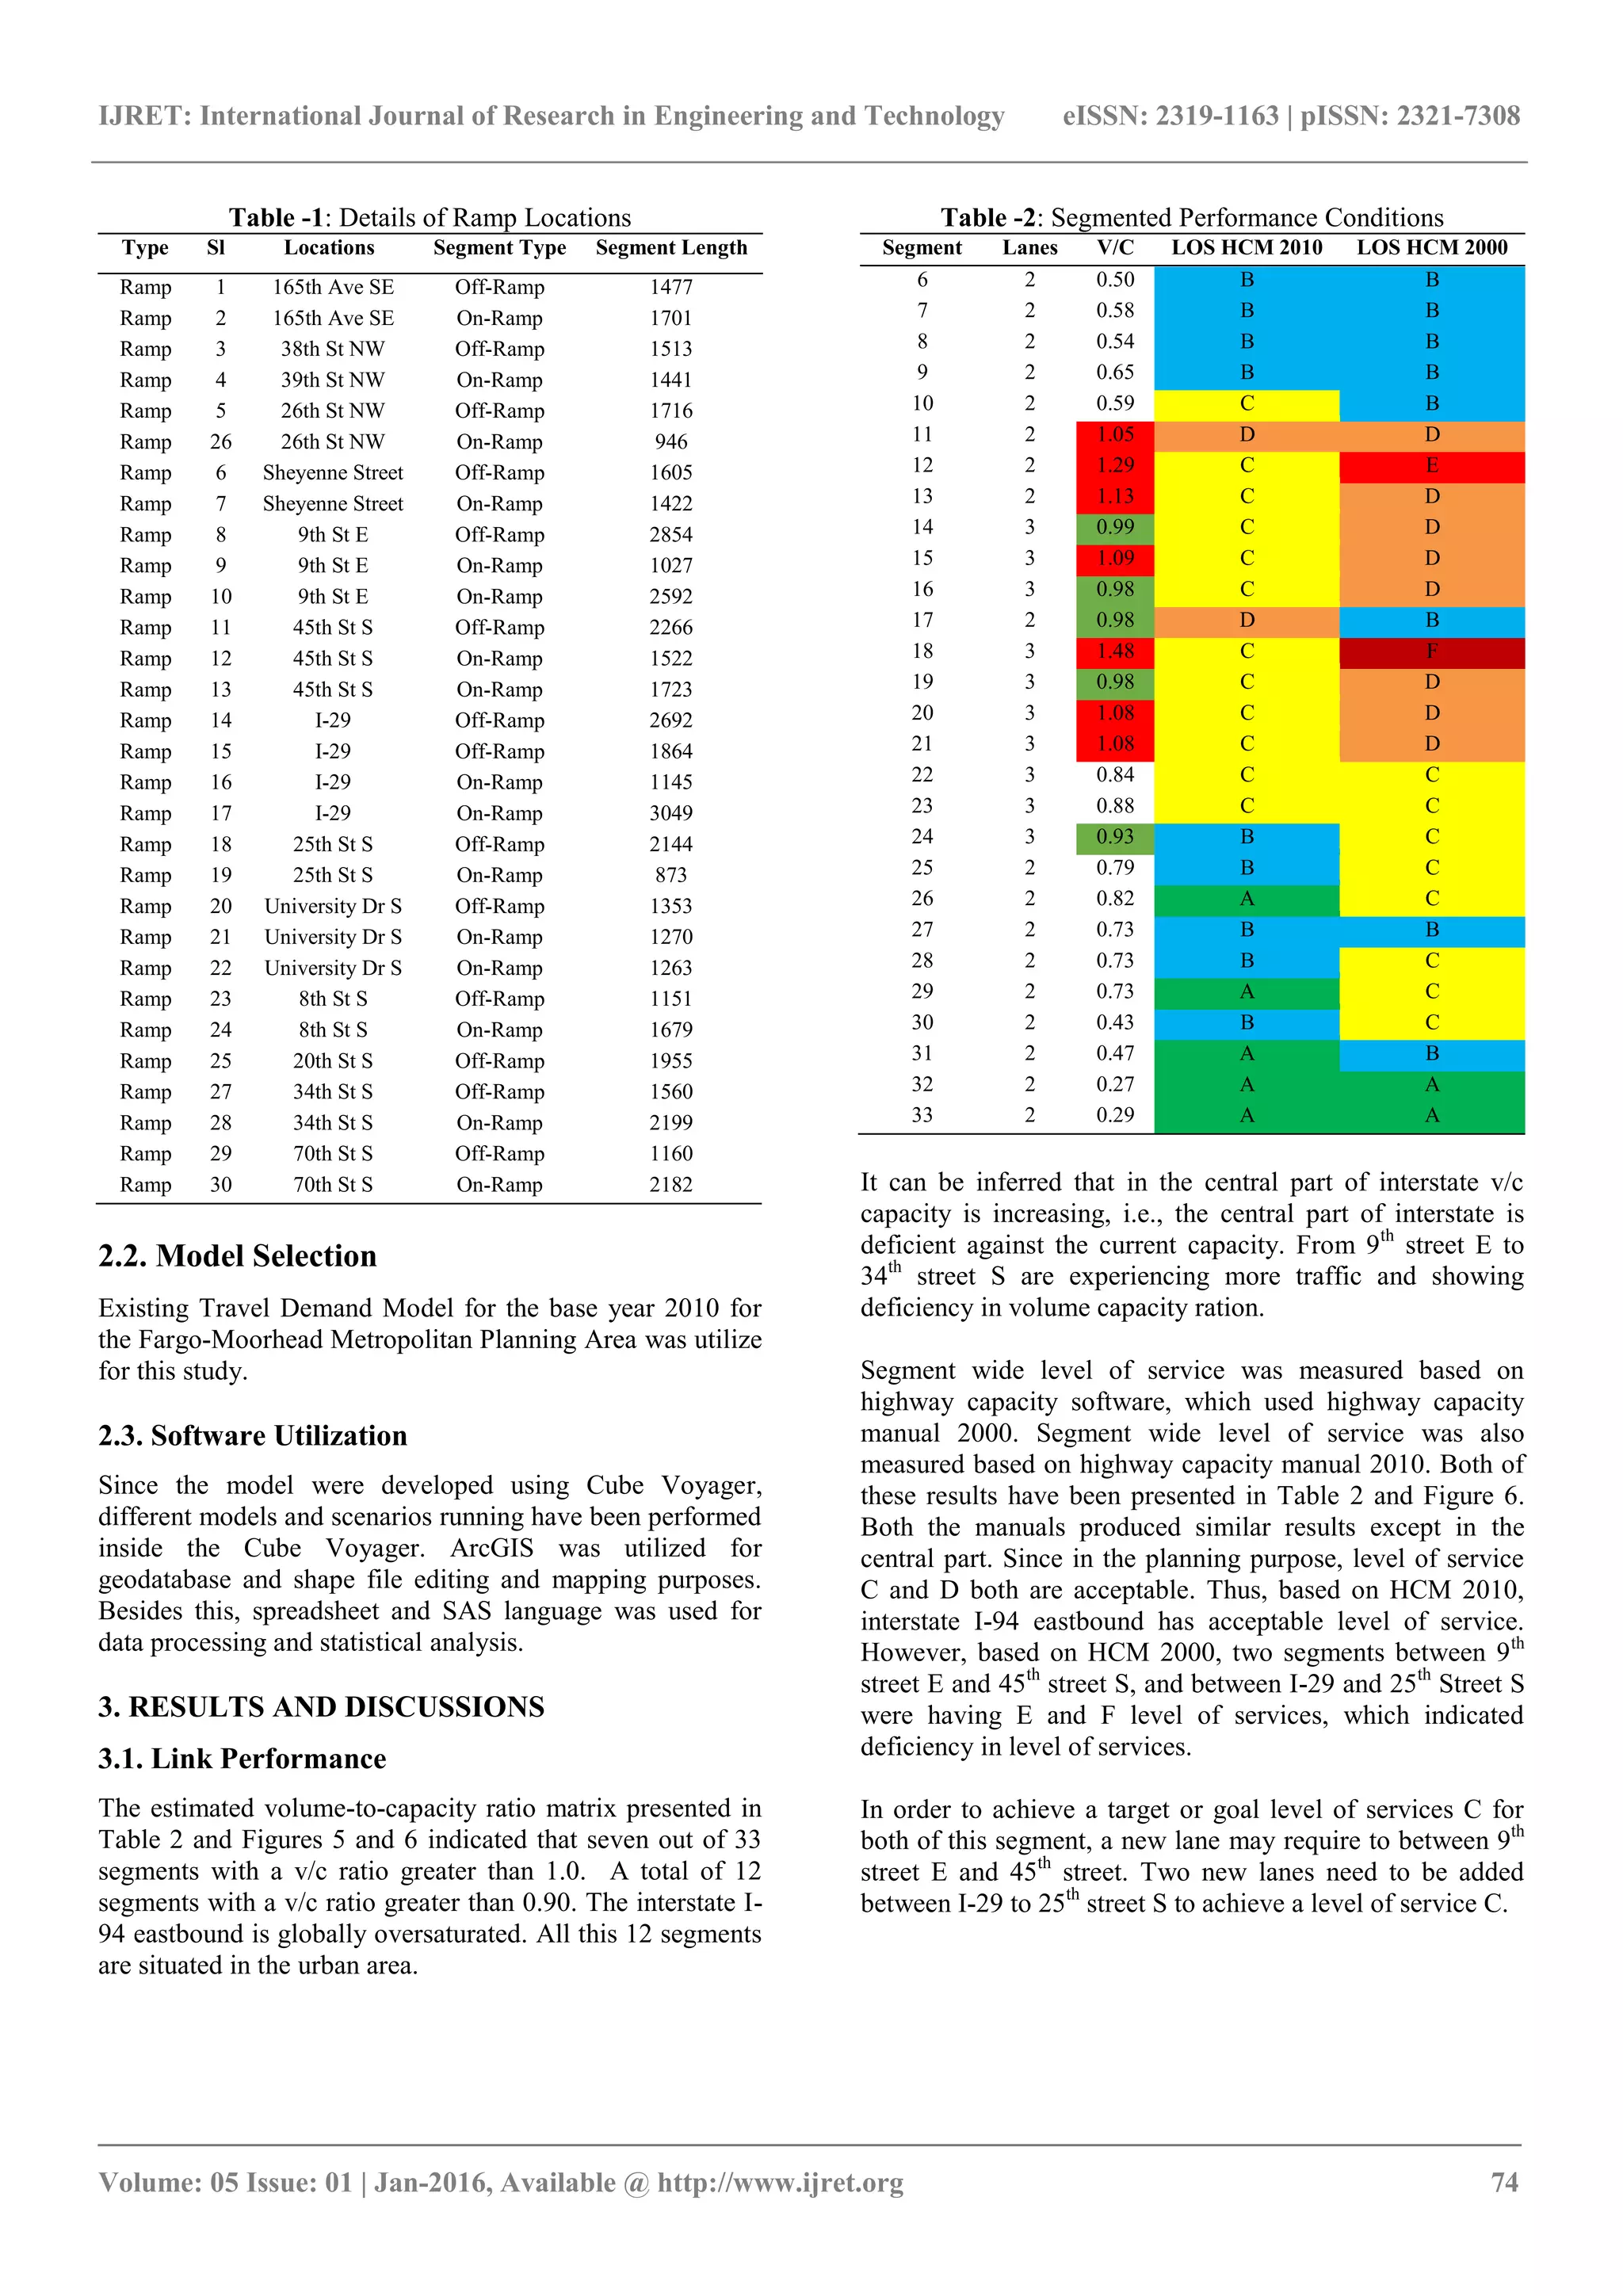
3.2. Ramp Performance
Even though I-94 eastbound link segments is showing pretty
good level of services, however, 13 interchanges along the
eastbound are showing severely deficiency in level of
service in the central part of the metropolitan planning area.
Volume to capacity and level of service is presented in
Table 3. More details of each interchanges is included in
Appendix A.1.
It was revealed that five ramps located (on-ramp in 9th
St E,
off-ramp I-29, on-ramp I-29, 25th
St S off-ramp, and 8th
Street S off-ramp) is having severe volume to capacity ratio,
which was more than 1.0. Based on HCM 2010, four ramps
(off-ramp I-29, on-ramp I-29, 25th
St S off-ramp, and 8th
Street S off-ramps) are having level of service F and on-
ramp in 9th
St E are having level of service E. Since majority
of the ramp from 9th
St E to University Dr. S is deficient in
level of service, which has the similar case in link segment,
therefore, special focus is necessary for the deficient ramp
and areas. There are many ways the better level of service of
ramp could be attained. Here, addition of lanes approach
was considered. Adding one more lane on ramp segment
number 9 to 19 except ramp segment number 16 where two
more lanes requires defined in Table 3 may facilitate to
attain a desired level of service C.
Table -3: Performance of Interchanges
Segment Locations Segment Type V/C LOS HCM 2010 LOS HCM 2000
1 165th Ave SE Off-Ramp 0.07 A A
2 165th Ave SE On-Ramp 0.40 B B
3 38th St NW Off-Ramp 0.02 A B
4 39th St NW On-Ramp 0.23 A B
5 26th St NW Off-Ramp 0.03 A B
26 26th St NW On-Ramp 0.11 A B
6 Sheyenne Street Off-Ramp 0.09 A B
7 Sheyenne Street On-Ramp 0.25 A C
8 9th St E Off-Ramp 0.15 A B
9 9th St E On-Ramp 1.05 E F
10 9th St E On-Ramp 0.55 C F
11 45th St S Off-Ramp 0.36 B D
12 45th St S On-Ramp 0.80 D E
13 45th St S On-Ramp 0.35 B D
14 I-29 Off-Ramp 0.37 B D
15 I-29 Off-Ramp 1.12 F D
16 I-29 On-Ramp 2.06 F D
17 I-29 On-Ramp 0.75 D F
18 25th St S Off-Ramp 1.71 F E
19 25th St S On-Ramp 0.34 B F
20 University Dr S Off-Ramp 0.79 D D
21 University Dr S On-Ramp 0.12 A D
22 University Dr S On-Ramp 0.18 A C
23 8th St S Off-Ramp 1.37 F C
24 8th St S On-Ramp 0.07 A F
25 20th St S Off-Ramp 0.21 A C
27 34th St S Off-Ramp 0.68 D B
28 34th St S On-Ramp 0.09 A C
29 70th St S Off-Ramp 0.41 B A
30 70th St S On-Ramp 0.05 A B
The results revealed deficiencies of interstate I-94 eastbound
with respect to volume capacity ratio and level of services. It
can be concluded that the findings of the study indicated
potential problems of existing condition of interstate
facilities, which need to be under consideration seriously in
order to avoid the congestion. The result also reveals
significant difference in Highway Capacity Manual 2000
and 2010 in producing level of service measures.
4. CONCLUSIONS
This study compared the implications of highway capacity
manual 2010 and 2000 on measuring freeway level of
service and volume-capacity ratio. The study revealed
dissimilarity between the year 2000 and 2010. The study
presents a case study based on planning model approach.
However, the results could be useful to make suitable
transportation planning and decision making on freeway.
Road segment can be further divided into smaller pieces so
that details analysis would revealed better results.
REFERENCES
[1] Fargo-Moorhead Metropolitan Council of
Governments. (2014). 2014 Long Range Transporation
Plan. Fargo, ND.
[2] Federal Highway Administration. (2015, 3 26).
Highway Functional Classification: Concepts, Criteira](https://image.slidesharecdn.com/implicationsofhighwaycapacitymanualonfreewaymeasureofeffectivenessacasestudy-160920095925/75/Implications-of-highway-capacity-manual-on-freeway-measure-of-effectiveness-a-case-study-4-2048.jpg)
![IJRET: International Journal of Research in Engineering and Technology eISSN: 2319-1163 | pISSN: 2321-7308
_______________________________________________________________________________________
Volume: 05 Issue: 01 | Jan-2016, Available @ http://www.ijret.org 76
and Procedures. Retrieved from
http://www.fhwa.dot.gov/planning/processes/statewide/
related/highway_functional_classifications/fcauab.pdf
[3] Transportation Research Board. (2000). Highway
Capacity Manual 2000. Washington, D.C.
[4] Transportation Research Board. (2007). Metropolitan
Travel Forecasting. Washington, D.C.
[5] Transportation Research Board. (2010). Highway
Capacity Manual. Washinton, D.C.
[6] Transportation Research Board. (2012). Travel Demand
Forecasting: Parameteres and Techniques, NCHRP
Report 716. Washington, D.C.
[7] Ulteigh and McKibben Demographics Research.
(2012). Demographic Forecast Study for the FM
Metropolitan Area. FArgo, ND. Retrieved 3 26, 2015,
from
http://www.fmmetrocog.org/new/assets/documents/Ma
ps/2012%20Demographic%20Forecast%20Final%20Re
port_Approved.pdf
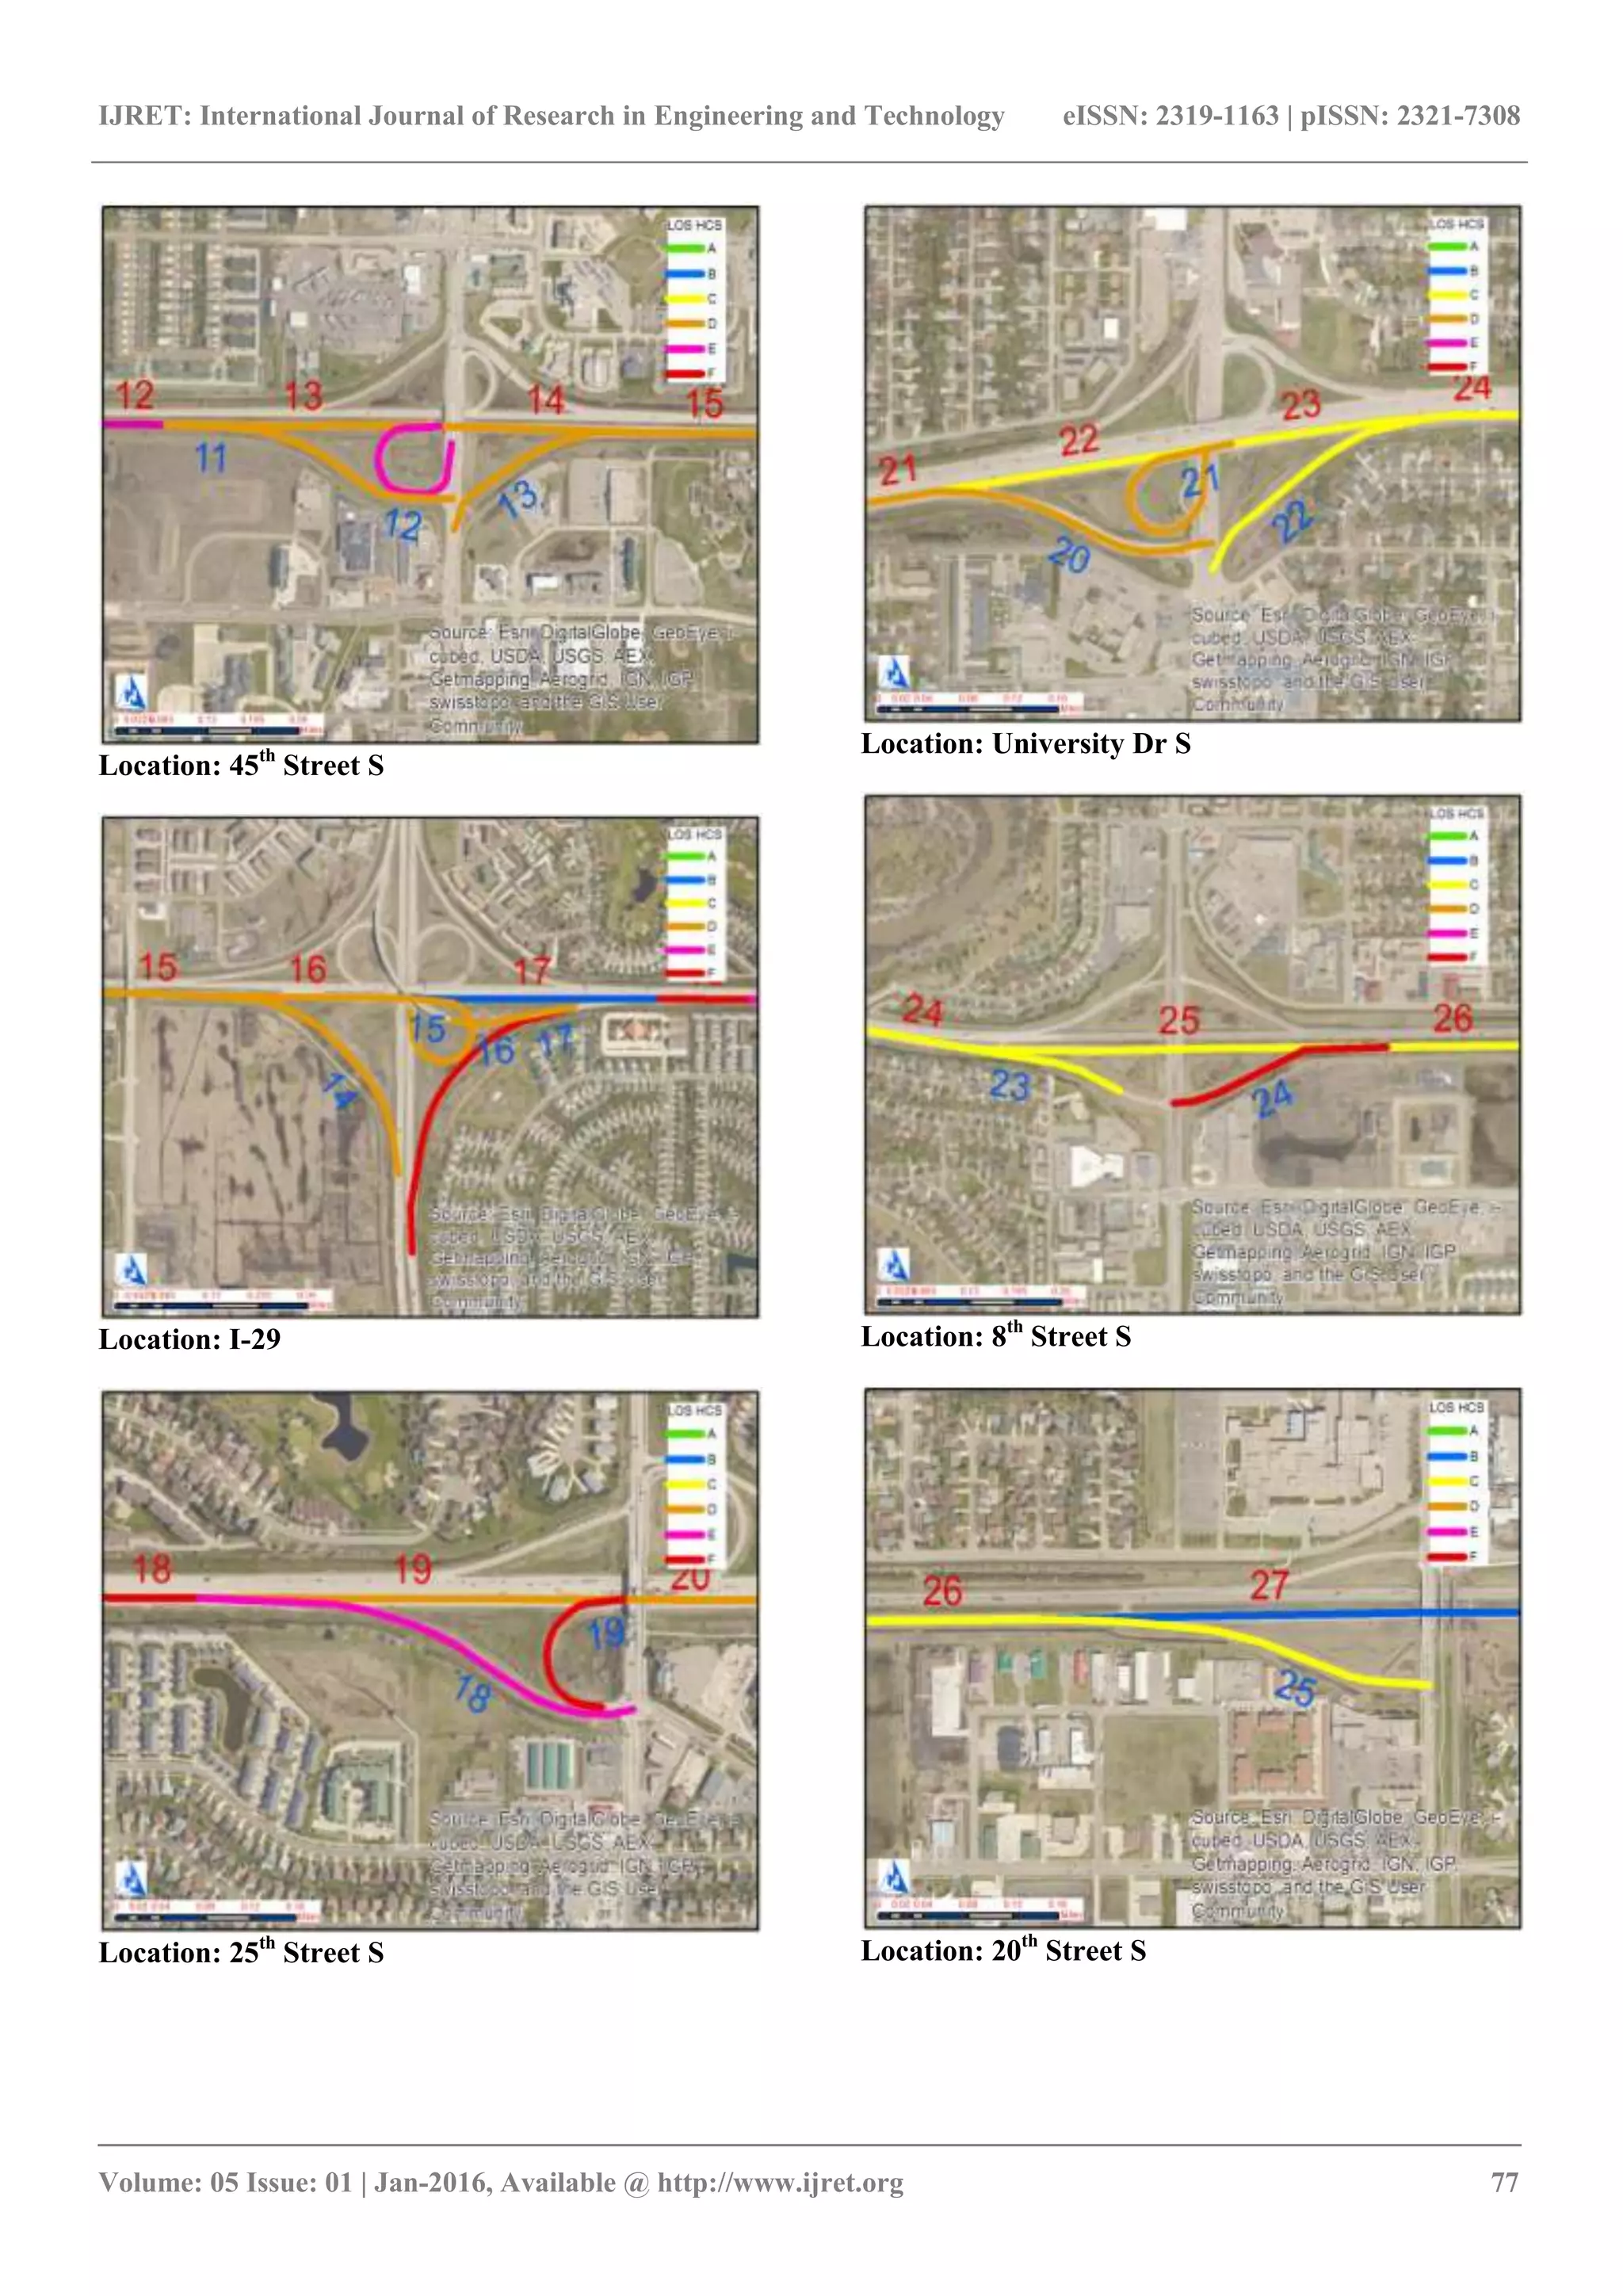
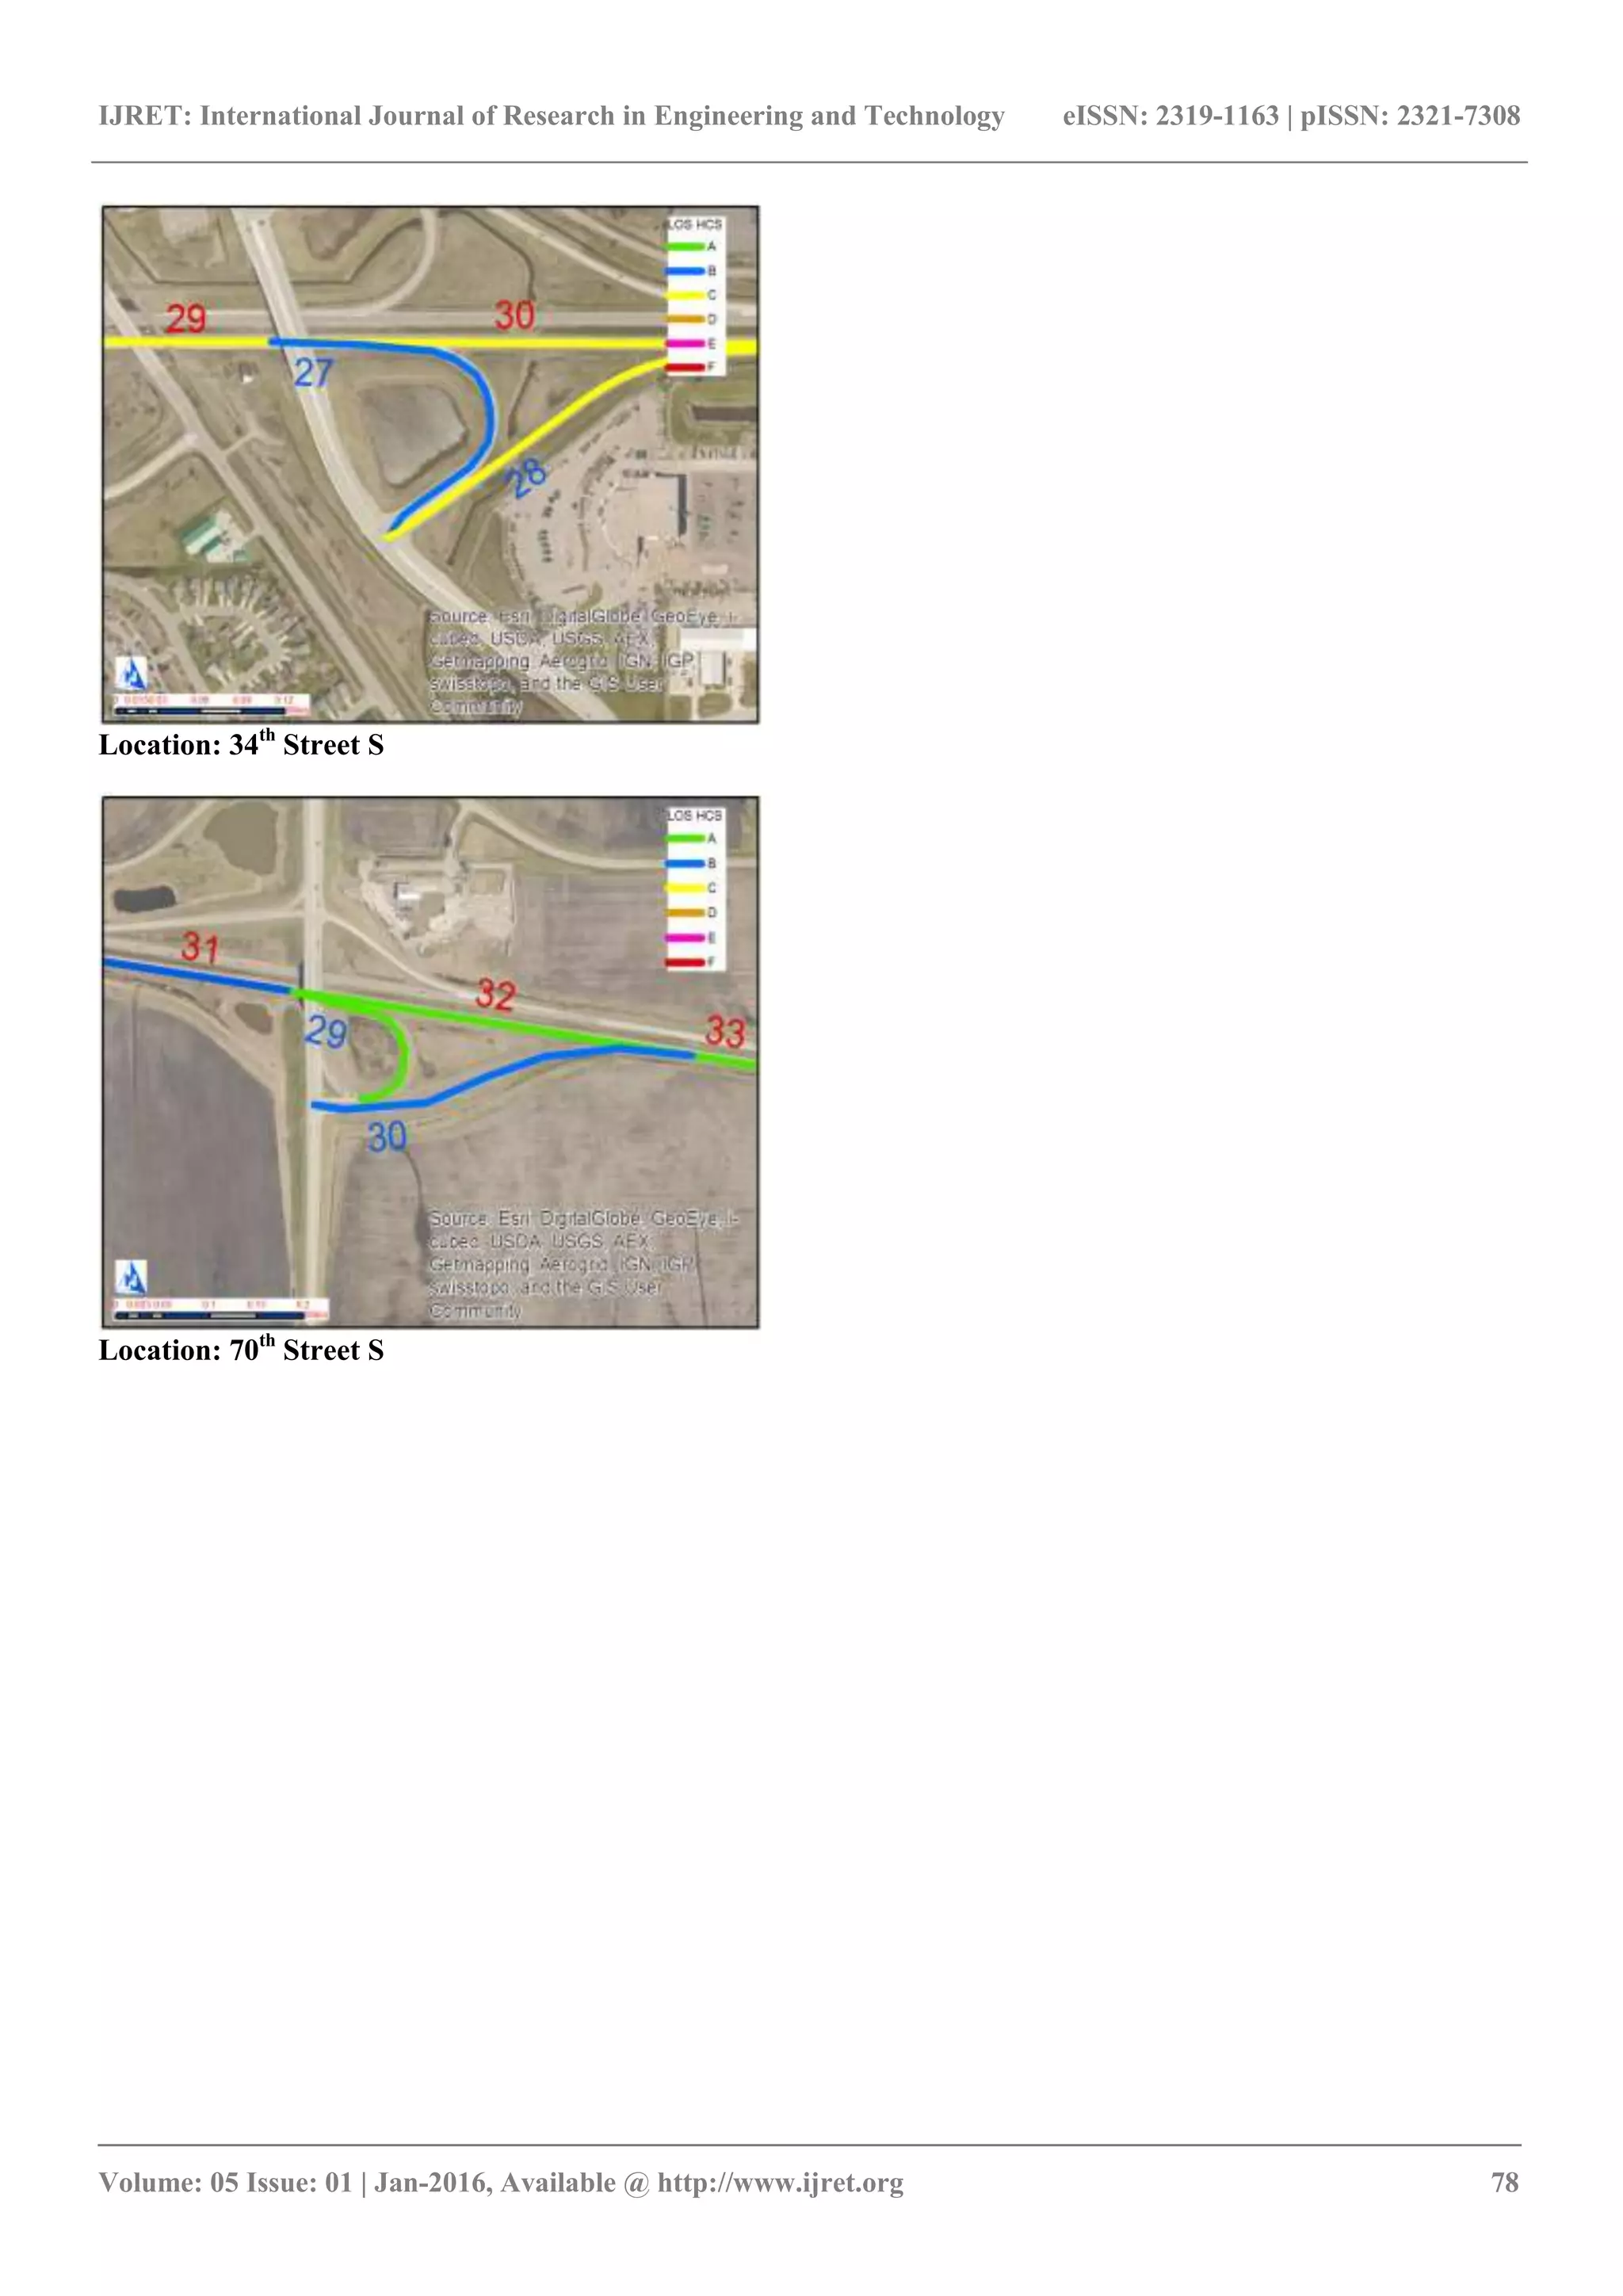
APPENDIX A
A.1. I-94 Eastbound Interchange Details
Location: 165th
Ave SE
Location: 38th
Street NW
Location: 26th
Street NW
Location: Sheyenne Street
Location: 9th Street E](https://image.slidesharecdn.com/implicationsofhighwaycapacitymanualonfreewaymeasureofeffectivenessacasestudy-160920095925/75/Implications-of-highway-capacity-manual-on-freeway-measure-of-effectiveness-a-case-study-5-2048.jpg)

This document summarizes a study of highway capacity and level of service on sections of Interstate 94 and its interchanges in the Fargo-Moorhead metropolitan area. The study found that several segments and ramps were approaching or exceeding capacity based on 2010 and future travel demand projections. In particular, segments from 9th Street to 45th Street and ramps from 9th Street to University Drive were shown to be deficient. The implications of using Highway Capacity Manual 2000 versus 2010 for analysis were also examined.