Download to read offline


![113Appendix IV Data and country selection for Part II
wages, employment, consumption and related economic issues in both rural and
urban areas of China.
The analysis for India is based on the Employment–Unemployment Survey
(EUS) carried out by the National Sample Survey Office (NSSO) of India. It covers
all major Indian states. The year (known as round) considered for the analysis is
the 68th (July 2011 to June 2012).
The statistics for Indonesia are based on the national labour force survey
(Survei angkatan kerja nasional, SAKERNAS). This provides the basis for calcu-
lation of all statistics related to employment, wages, income from self-employment
and household employment-related income. The year 2009 is used for the analyses.
For Mexico, the Encuesta Nacional de Ocupación y Empleo (ENEO) is used,
taking data for the last quarter of 2014.
For Peru, the Encuesta Nacional de Hogares sobre Condiciones de Vida
y Pobreza (ENAHO) is used. It has been conducted since 1995 by the Instituto
Nacional de Estadística e Informática (INEI) and is national in scope. Data are
used for 2012.
FortheRussianFederation,theanalysiswasbasedontheRussianLongitudinal
Monitoring Survey (RLMS-HSE).37
The RLMS-HSE is conducted by the Higher
School of Economics and ZAO “Demoscope” in cooperation with the Carolina
Population Center, University of North Carolina at Chapel Hill in the United States,
and the Russian Academy of Sciences’ Institute of Sociology. The RLMS-HSE is
nationally representative and is used because none of the regular official surveys
contains information on wages and household income. Gorodnichenko and col-
leagues conclude that the “RLMS appears to be a reliable data source for examining
the inequality trends in labor market outcomes, reported income, [and] consump-
tion, with the common caveats of income underreporting and underrepresentation
of the super-rich” (Gorodnichenko, Sabirianova and Stolyarov, 2010, p. 13). The
World Bank also favours the RLMS over official data sources in a number of pub-
lications on inequality and poverty (e.g. World Bank, 1999).
For South Africa, different data sets are used for the labour market and house-
hold income indicators since there is no single nationally representative survey for
the appropriate period that includes enough detailed information on all variables.
The labour force survey is used for the last quarter of 2013.
For Uruguay, the Encuesta Continua de Hogares, implemented by the
Instituto Nacional de Estadística (INE), is used for 2012.
Data on Viet Nam are from the Household Living Standard Surveys (HLSS)
for 2010.
Enterprise-level surveys to estimate the wage distribution of individuals
We provide estimates for Chile, China, Indonesia, South Africa and Viet Nam.
The data for Chile draw on the Encuesta Longitudinal de Empresas (ELE),
a survey representative of small, medium and large enterprises with a sample that
covers about 2 per cent of all formal establishments in Chile. The data set includes
both wage information and information on the revenue side of the establishment.
We use the 2012 data, selecting only the last quarter of the year.
ContentsContents](https://image.slidesharecdn.com/iloglobalwagereport2016-2017-171014171342/75/Ilo-global-wage-report-2016-2017-132-2048.jpg)


![126
Herr, H. 2009. “The labour market in a Keynesian economic regime: Theoretical
debate and empirical findings”, in Cambridge Journal of Economics, Vol. 33,
No. 5, pp. 949–965.
—. 2015. “Japan”, in M.V. Klaveren, D. Gregory and T. Schulten (eds): Minimum
wages, collective bargaining and economic development in Asia and Europe
(Basingstoke, Palgrave Macmillan), pp. 78–100.
Hertz, T.; Winters, P.; de la O, A.P.; Quiñones, E.J.; Davis, B.; Zezza, A. 2008.
Wage inequality in international perspective: Effects of location, sector, and
Gender, ESA Working Paper No. 08-08.
ILO (International Labour Office). 1944. Declaration concerning the aims
and purposes of the International Labour Organisation (Declaration of
Philadelphia), International Labour Conference, 26th Session, Philadelphia,
10 May 1944; available at: http://www.ilo.org/wcmsp5/groups/public/---
asia/---ro-bangkok/---ilo-islamabad/documents/policy/wcms_142941.pdf
[25 Oct. 2016].
—. 1966. Resolution concerning statistics of labour cost, adopted by the 11th
International Conference of Labour Statisticians (Geneva).
—. 1973. Resolution concerning an integrated system of wages statistics, adopted
by the 12th International Conference of Labour Statisticians (Geneva).
—. 1993. Resolution concerning the International Classification of Status in
Employment (ISCE), adopted by the 15th International Conference of
Labour Statisticians (Geneva).
—. 1998. Resolution concerning the measurement of employment related
income, adopted by the 16th International Conference of Labour
Statisticians (Geneva).
—. 2007. Conclusions concerning the promotion of sustainable enterprises,
International Labour Conference, 96th Session, Geneva, June 2007;
available at: http://www.ilo.org/wcmsp5/groups/public/---ed_emp/---emp_
ent/documents/publication/wcms_093970.pdf [25 Oct. 2016].
—. 2008a. Declaration on Social Justice for a Fair Globalization, International
Labour Conference, 97th Session, Geneva, 10 June, http://www.ilo.org/
wcmsp5/groups/public/---dgreports/---cabinet/documents/genericdocument/
wcms_371208.pdf [25 Oct. 2016].
—. 2008b. Global Wage Report 2008/09: Minimum wages and collective
bargaining – Towards policy coherence (Geneva).
—. 2010a. Global Wage Report 2010/11: Wage policies in times of crisis (Geneva).
—. 2010b. Trends Econometric Models: A review of the methodology, 19 Jan.
(Geneva, Employment Trends Unit).
—. 2012a. Global Wage Report 2012/13: Wages and equitable growth (Geneva).
. 2012b. Decent work indicators: Concepts and definitions (Geneva). Available
at: http://www.ilo.org/wcmsp5/groups/public/---dgreports/---integration/
documents/publication/wcms_229374.pdf [25 Oct. 2016].
ContentsContents](https://image.slidesharecdn.com/iloglobalwagereport2016-2017-171014171342/75/Ilo-global-wage-report-2016-2017-144-2048.jpg)
![127Bibliography
—. 2014a. “Outcome of the discussion by the Committee on the Application
of Standards of the General Survey concerning minimum wage
systems”, Committee on the Application of Standards at the Conference,
International Labour Conference, 103rd Session, Geneva, 2014 (Geneva),
p. 53. Available at: http://www.ilo.org/wcmsp5/groups/public/---ed_norm/---
normes/documents/publication/wcms_320613.pdf [23 Oct. 2016].
—. 2014b. World Social Protection Report 2014/15 (Geneva).
—. 2015a. Global Wage Report 2014/15: Wages and income inequality (Geneva).
—. 2015b. Key Indicators of the Labour Market, 9th edition (Geneva).
—. 2015c. World Employment and Social Outlook: Trends (Geneva).
—. 2015d. Promoting collective bargaining (Geneva).
—. 2016a. Inclusive growth and development founded on decent work for all,
statement by Guy Ryder, ILO Director-General, to the International
Monetary and Financial Committee of the 2016 Annual Meetings of the
Boards of Governors of the World Bank and the IMF, 6 Oct. Available at:
http://www.ilo.org/global/about-the-ilo/newsroom/statements-and-speeches/
WCMS_531665/lang--en/index.htm [25 Oct. 2016].
—. 2016b. Non-standard employment around the world: Understanding challenges,
shaping prospects (Geneva).
—. 2016c. World Employment and Social Outlook: Trends (Geneva).
—. 2016d. World Employment and Social Outlook: Transforming jobs to end poverty
(Geneva).
—. 2016e. Minimum wage policy guide (Geneva).
—; OECD (Organisation for Economic Co-operation and Development). 2015.
The labour share in G20 economies, with contributions from IMF and
World Bank Group, report prepared for G20 Employment Working Group,
Antalya, Turkey, 26–27 Feb.
IMF (International Monetary Fund). 2012. “The labor share in Europe and the
United States during and after the Great Recession”, in World Economic
Outlook: Growth resuming, dangers remain, Apr. (Washington, DC), pp. 36–37.
—. 2016a. World Economic Outlook: Too slow for too long, Apr. (Washington, DC).
—. 2016b. World Economic Outlook: Subdued demand: Symptoms and remedies,
Oct. (Washington, DC).
Iranzo, S.; Schivardi, F.; Tosetti, E. 2008. “Skill dispersion and firm productivity:
An analysis with employer–employee matched data”, in Journal of Labor
Economics, Vol. 26, No. 2, pp. 247–285.
Jacobson, M.; Occhino, F. 2012. “Labor’s declining share of income and rising
inequality”, in Economic Commentary, No. 2012-13, 25 Sep. (Cleveland, OH,
Federal Reserve Bank of Cleveland).
Jeong, Y.; Gastwirth, J.L. 2010. Comments on the draft ILO report “Estimation
of global wage trends: Methodological issues”, mimeo (Montreal and
Washington, DC, HEC Montreal and George Washington University).
ContentsContents](https://image.slidesharecdn.com/iloglobalwagereport2016-2017-171014171342/75/Ilo-global-wage-report-2016-2017-145-2048.jpg)

![129Bibliography
Lübker, M. 2007. “Inequality and the demand for redistribution: Are the
assumptions of the new growth theory valid?”, in Socio-Economic Review,
Vol. 5, No. 1, pp. 117–148.
Machado, A.; Perez Ribas, R. 2010. “Do changes in the labour market take
families out of poverty? Determinants of exiting poverty in Brazilian
metropolitan regions”, in Journal of Development Studies, Vol. 46,
No. 9, pp. 1503–1522.
Machin, S.; Puhani, P. 2003. “Subject of degree and the gender wage differential:
Evidence from the UK and Germany”, in Economics Letters, Vol. 79, No. 3,
June, pp. 393–400.
Maître, N.; Sobeck, K. Forthcoming. Gender wage gaps among youth in
developing countries.
Massie, K.; Collier, D.; Crotty, A. 2014. Executive salaries in South Africa: Who
should have a say on pay? (Johannesburg, Jacana).
Maurizio, R.; Vazquez, G. 2016. “The consequences of minimum wages on
inequality: Evidence for Latin America”, paper presented to National
Minimum Wage Symposium and Policy Round Table, Johannesburg,
University of the Witwatersrand, 2–4 Feb.
May, T. 2016. Keynote speech to UK Conservative Party Conference, 5 Oct.
Available at: http://www.independent.co.uk/news/uk/politics/theresa-may-
speech-tory-conference-2016-in-full-transcript-a7346171.html [27 Oct. 2016].
Mehran, F. 2010. Estimation of global wage trends: Methodological issues, mimeo
(Geneva, ILO).
Mincer, J. 1974. Schooling, experience, and earnings (New York, National Bureau
of Economic Research Press).
Mindestlohnkommission. 2016. Erster Bericht zu den Auswirkungen des
Gesetzlichen Mindestlohns (Berlin).
Mortensen, D. 2005. Wage dispersion: Why are similar workers paid differently?
(Cambridge, MA, MIT Press).
Murphy, K.M.; Welch, F. 1992. “The structure of wages”, in Quarterly Journal of
Economics, Vol. 107, No. 285, pp. 285–326.
Nataraj, S.; Perez-Arce, F.; Srinivasan, S.V.; Kumar, K.B. 2014. “The impact of
labor market regulation on employment in low-income countries: A meta-
analysis”, in Journal of Economic Surveys, Vol. 28, No. 3, pp. 551–572.
Neumark, D.; Wascher, W. 2008. Minimum wages (Cambridge, MA, and
London, MIT Press).
Nikkei Asian Review. 2016. “Corporate Japan embracing stock options for
staffers”, 16 Apr., available at: http://asia.nikkei.com/Business/Trends/
Corporate-Japan-embracing-stock-options-for-staffers?page=1
Nopo, H.; Daza, N.; Ramos, J. 2011. Gender earnings gaps in the world, IZA
Discussion Paper No. 5736 (Bonn, IZA).
ContentsContents](https://image.slidesharecdn.com/iloglobalwagereport2016-2017-171014171342/75/Ilo-global-wage-report-2016-2017-147-2048.jpg)

![131Bibliography
Tillé, Y. 2001. Théorie des sondages: Echantillonage et estimation en populations
finies (Paris, Dunod).
—. 2010. Expertise report on the “Estimation of global wage trends:
Methodological issues”, mimeo (Neuchâtel, Institute of Statistics, University
of Neuchâtel).
Trapp, K. 2015. Measuring the labor share of developing countries: Learning from
social accounting matrices, WIDER Working Paper 2015/041. See also a
summary at: http://www1.wider.unu.edu/inequalityconf/sites/default/files/
posters/Trapp-poster.pdf [25 Oct. 2016].
Ugarte, S.M.; Grimshaw, D.; Rubery, J. 2015. “Gender wage inequality in
inclusive and exclusive industrial relations systems: A comparison of
Argentina and Chile”, in Cambridge Journal of Economics, Vol. 39,
No. 2, pp. 497–535.
UN (United Nations). 2016. Progress of the World’s Women 2015–2016:
Transforming economies, realizing rights (New York, NY, UN Women).
Visser, J.; Hayter, S.; Gammarano, R. 2015. Trends in collective bargaining
coverage: Stability, erosion or decline?, Labour Relations and Collective
Bargaining, Issue Brief No. 1, 29 Sep. (Geneva, ILO).
Weil, D. 2014. The fissured workplace: Why work became bad for so many and
what can be done to improve it (Cambridge, MA, Harvard University Press).
Woodcock, S. 2011. Match effects, unpublished.
World Bank. 1999. Russia: Targeting and the longer-term poor. Volume I –
Main report (Washington, DC).
—. 2012. “Overview”, in World Development Report 2012: Gender equality and
development (Washington, DC), pp. 2–40.
—. 2016. Poverty and shared prosperity 2016: Taking on inequality (Washington, DC).
Databases used
European Commission, AMECO (Annual macro-economic database)
Eurostat, EU-SILC survey
Eurostat, SES
ILO, Global Wage Database
ILOSTAT
OECD Earnings Database
World Bank Open Database
ContentsContents](https://image.slidesharecdn.com/iloglobalwagereport2016-2017-171014171342/75/Ilo-global-wage-report-2016-2017-149-2048.jpg)


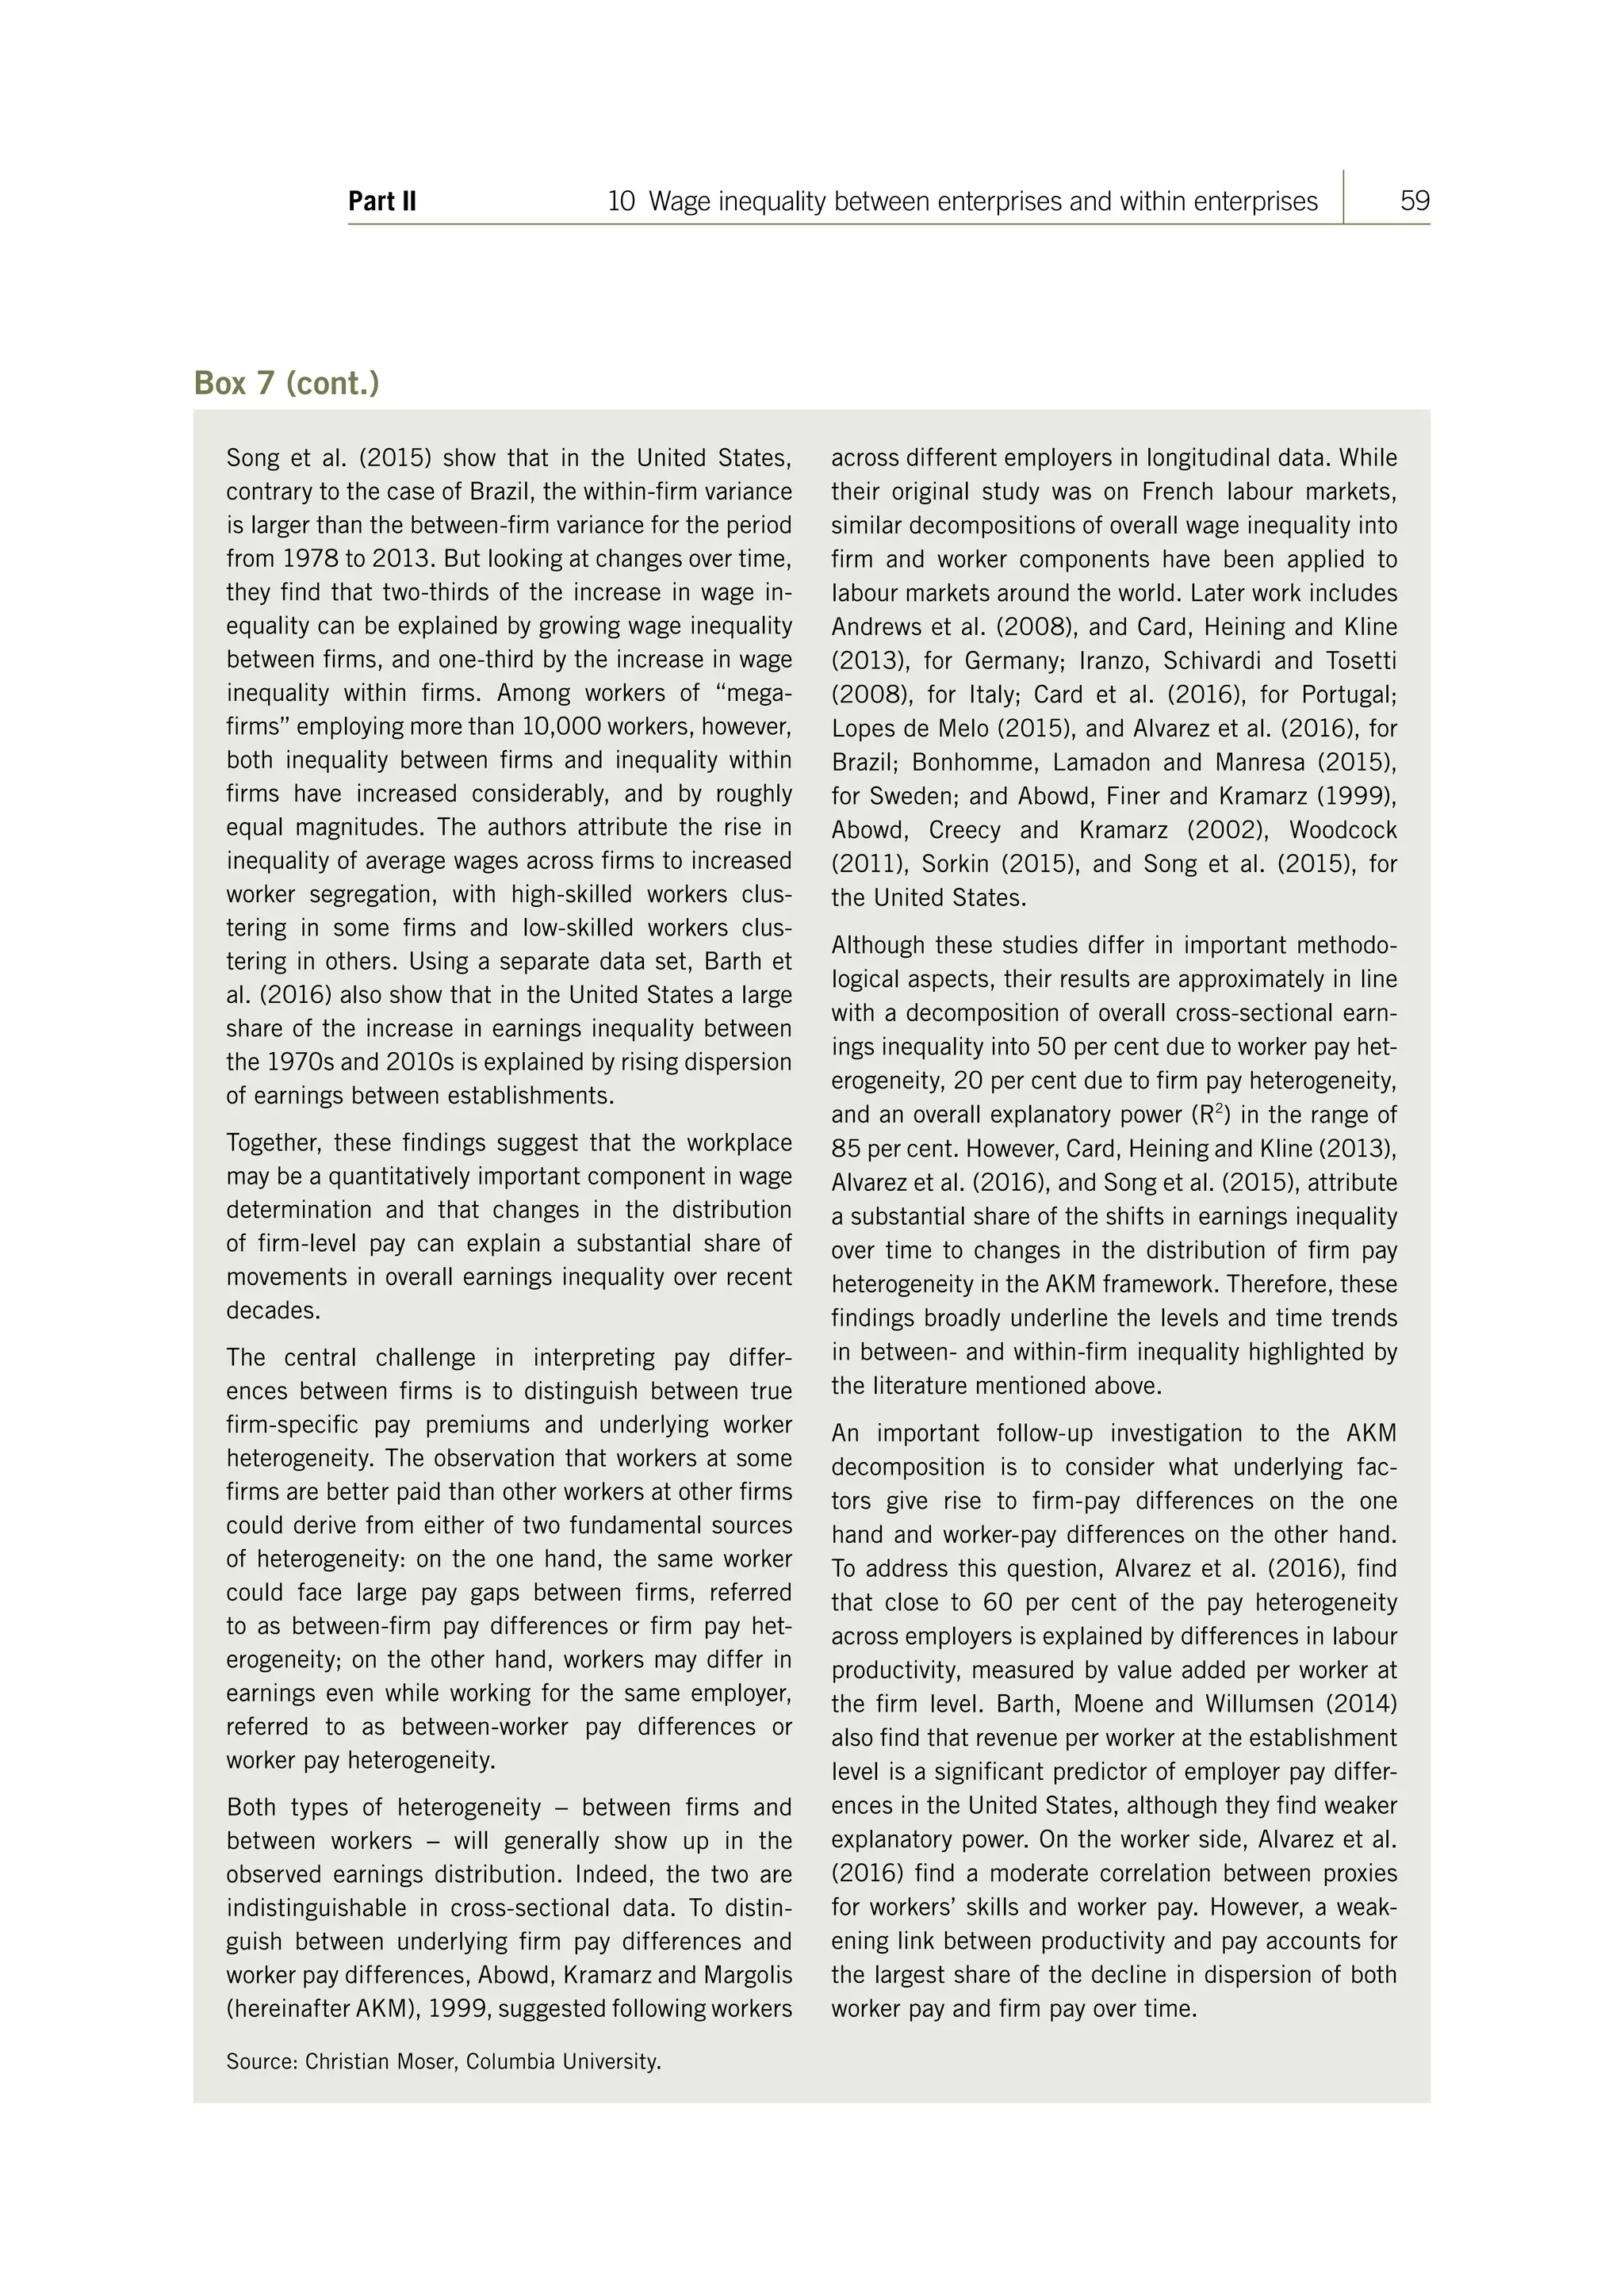
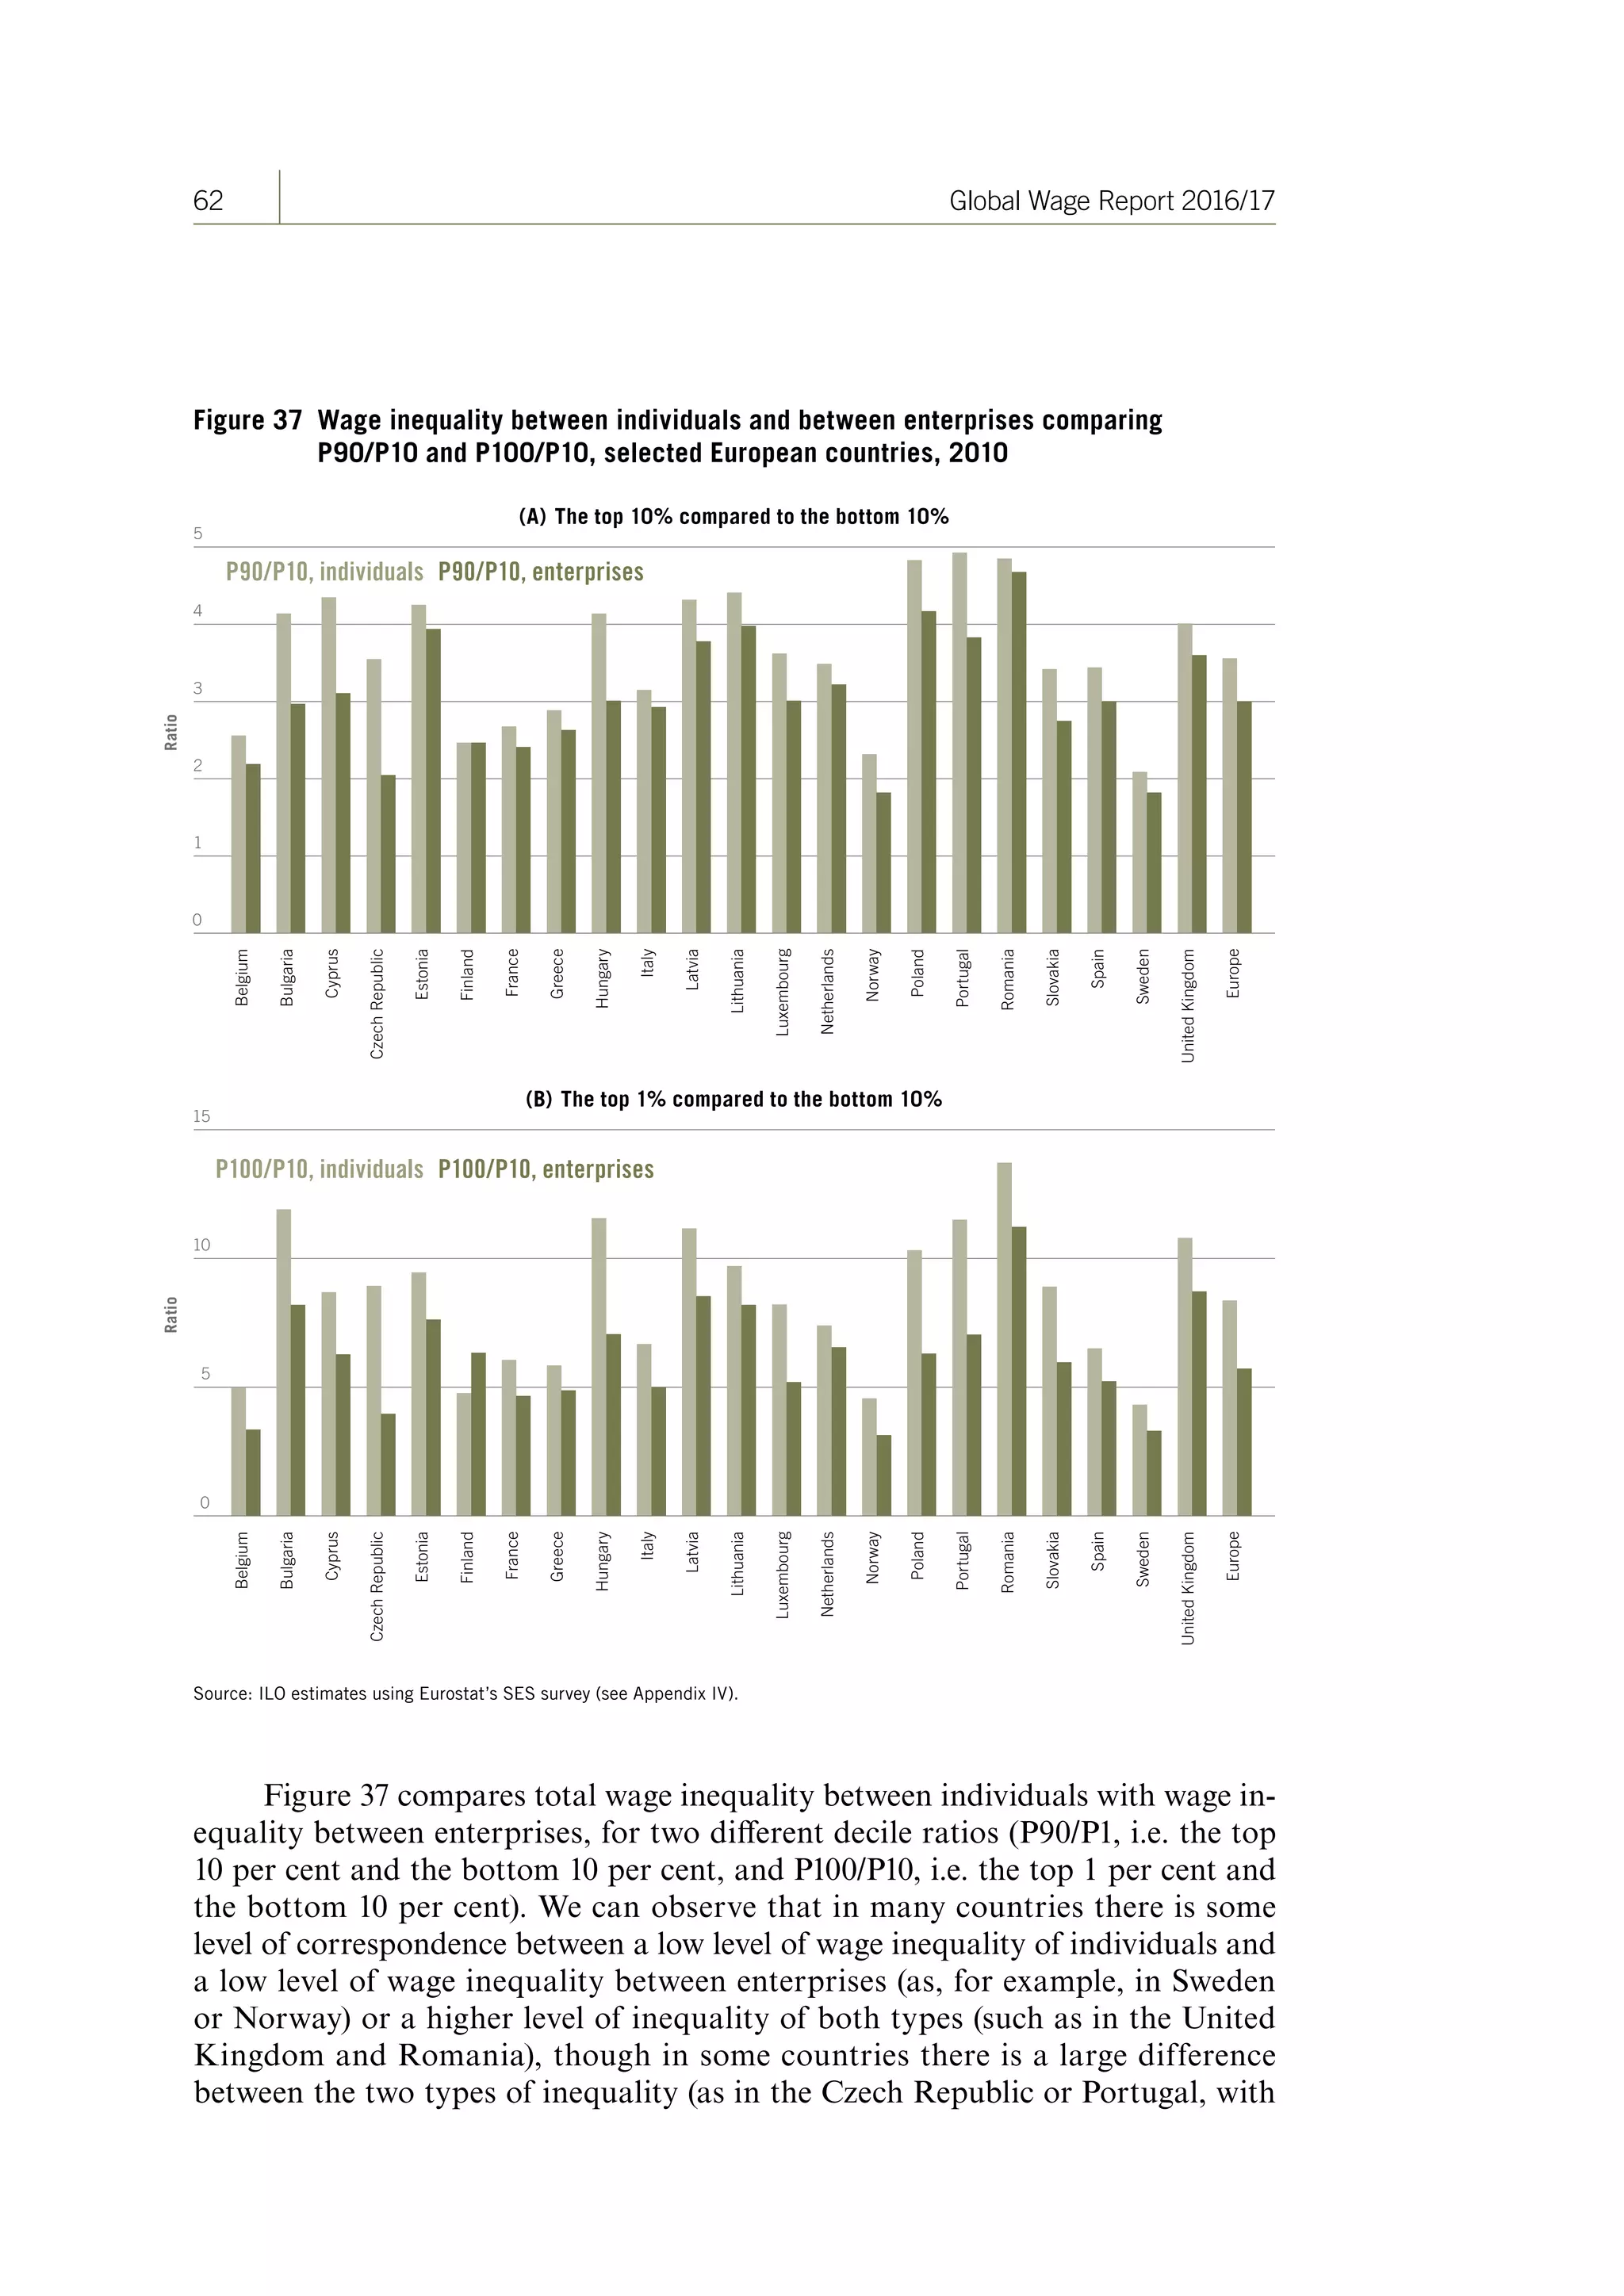
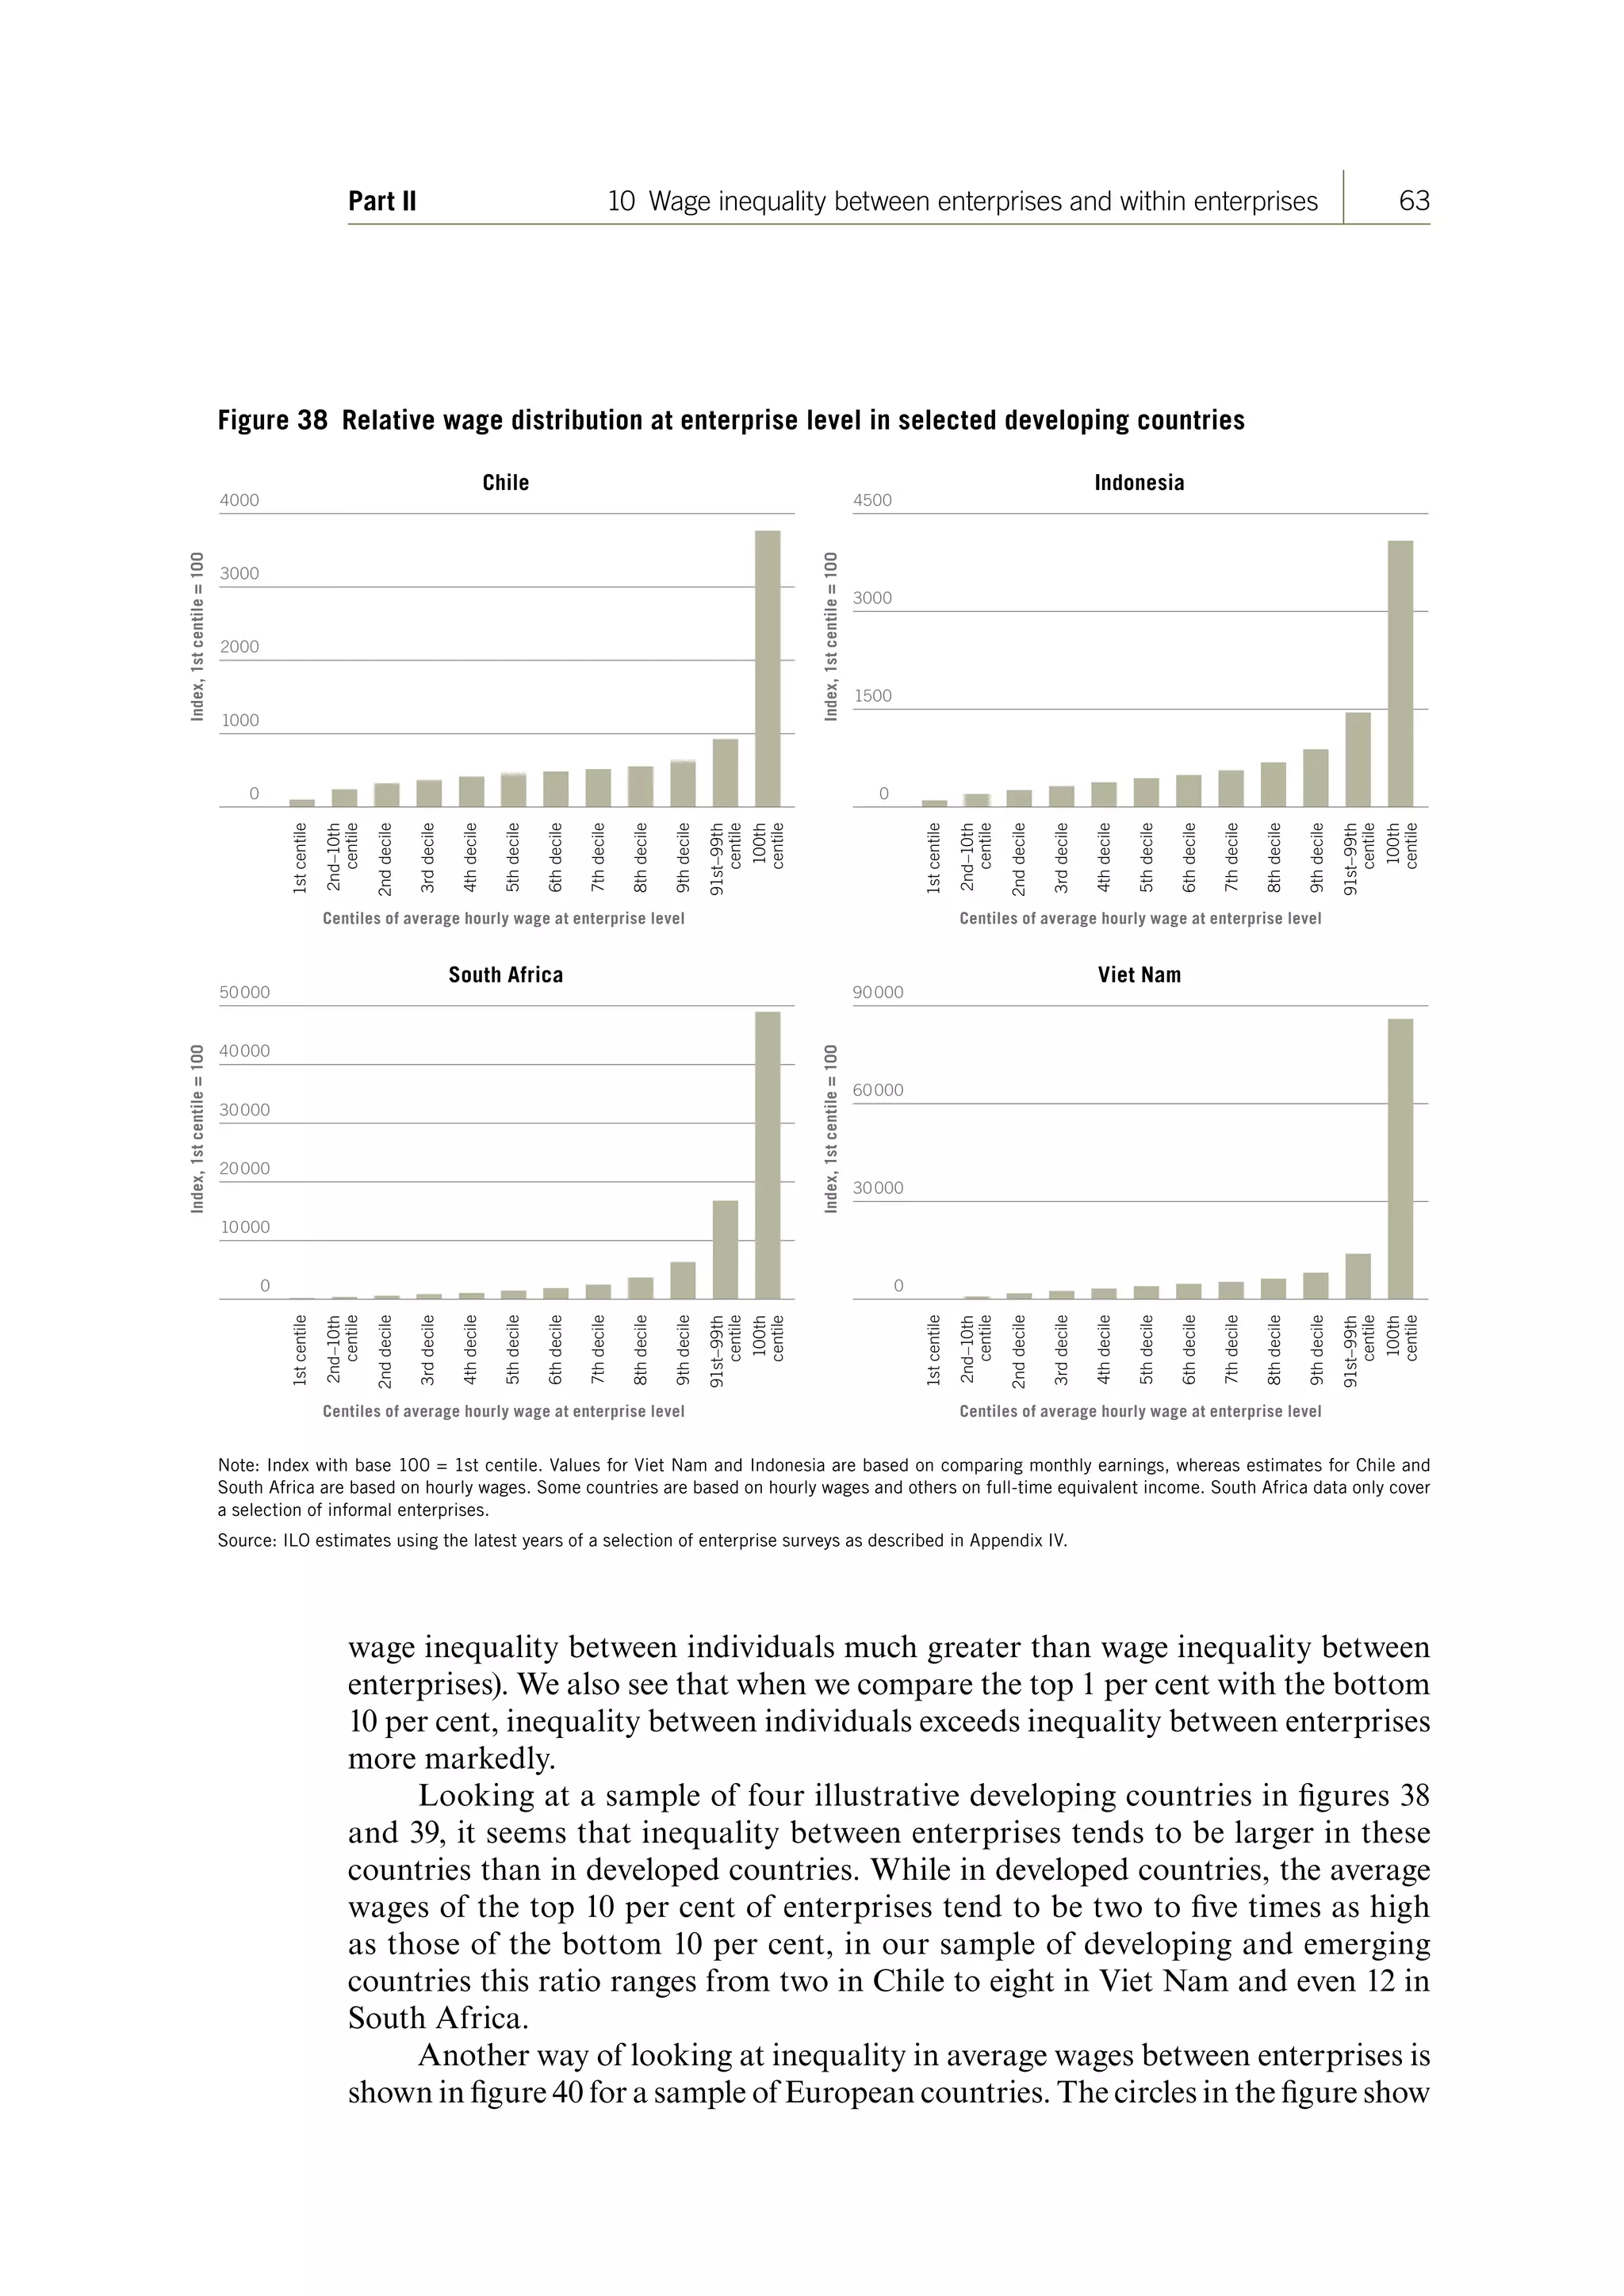
This report from the International Labour Organization analyzes wage inequality around the world. It finds that global real wage growth dropped sharply during the 2008 economic crisis and has since decelerated, falling below 1% in 2015 excluding China. The report examines wage inequality between enterprises and within enterprises. It finds that wage inequality within large enterprises, particularly among the top 1%, has become substantial and contributed significantly to overall wage inequality. The report discusses how collective bargaining and social dialogue can promote more inclusive wage growth and a narrower wage distribution.


![Unemployment_in_the_European_Union[1]](https://cdn.slidesharecdn.com/ss_thumbnails/79d3a8da-6a3c-47bd-94a5-380fa56dbba7-150825185631-lva1-app6892-thumbnail.jpg?width=640&height=640&fit=bounds)


