Download to read offline


![30 C R E AT I V E E C O N O M Y R E P O R T 2 0 1 0
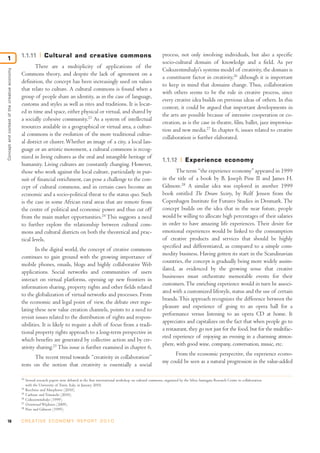
growth of 6.7 per cent. The creation and production phas-
es represents 55 per cent of total cultural activities.54
For Italy, as stated by the President of the Italian
Republic, “one of the strengths of our country [is] the cul-
ture of creativity. And in this new expression of Italian cre-
ativity we find the resurgent vigour of a tradition, heritage
and sensibility to which we must devote much more atten-
tion”.55
The cultural and creative industries accounted for
over 9 per cent of the Italian GDP and employed over 2.5
million people in 2004.56
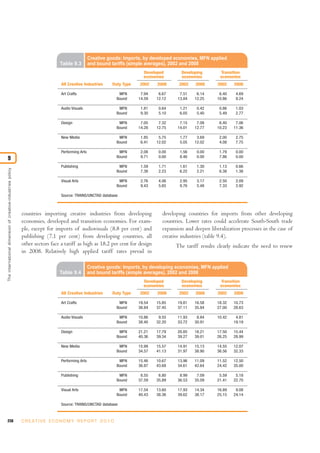
Denmark is another example
where the creative economy accounted for 5.3 per cent of
GDP, providing 12 per cent of total jobs and 16 per cent of
exports, and in Sweden, in the early 2000s the cultural sec-
tor accounted for 9 per cent of value added and 10 per cent
of total employment, as show in table 1.7.57
For the
Netherlands, the creative sector is characterised by an
increasing number of small enterprises and freelancers; in
the city of Amsterdam during the period 2006-2009, the
number of people working in the creative industries
increased 6.6 per cent.58
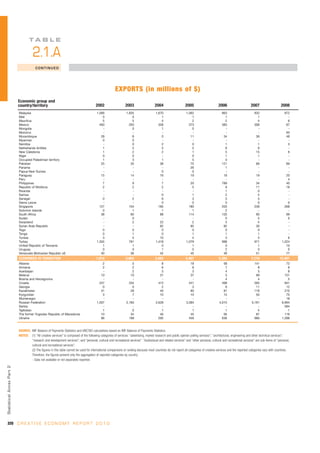
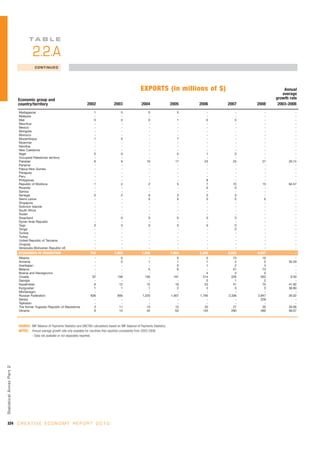
The creative industries contribute to output, value
added, income and the balance of payments.Typically, these
industries have contributed somewhere between 2 and 6 per
cent of GDP, depending on the definitions used. In 2007,
the creative industries accounted for 6.4 per cent of the U.S.
economy, generating foreign sales and exports in the order
of $125.6 billion, one of the larger exporting sectors in the
American economy.59
In Canada, the cultural sector provid-
ed 3.5 per cent of GDP and almost 6 per cent of the
growth in value added (GVA). In Australia, the growth in
the creative economy has been strong for nearly two decades,
with an annual average growth of 5.8 per cent. In 2007-
2008 the Australian creative economy was worth $31
billion (Australian dollars), making a real contribution to
the nation’s economic performance and flexibility, employ-
ing about 5 per cent of the workforce, and generating about
7 per cent of national earnings.60
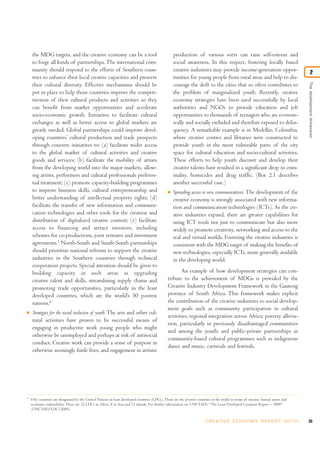
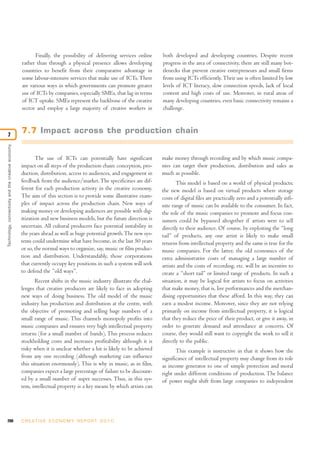
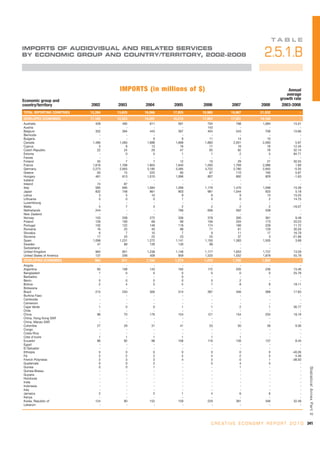
This chapter has been concerned primarily with the
evolution of concepts involved in any consideration of the
creative economy. This final section turns from concepts to
practice and considers some more detailed empirical evi-
dence for some of the propositions discussed earlier.
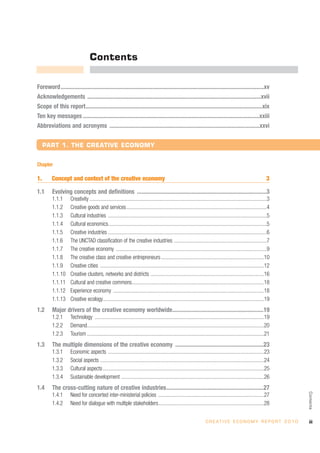
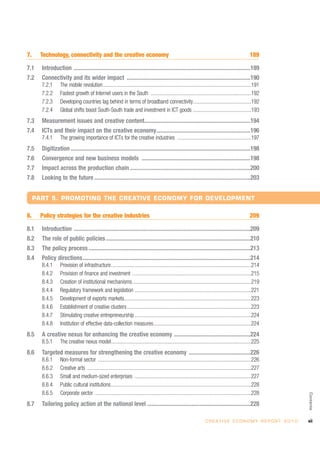
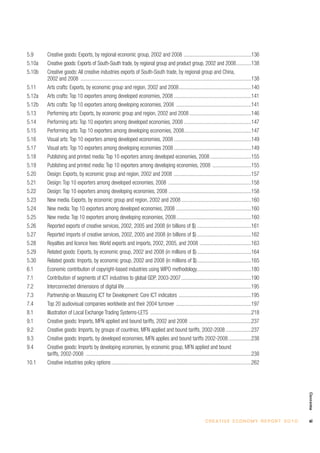
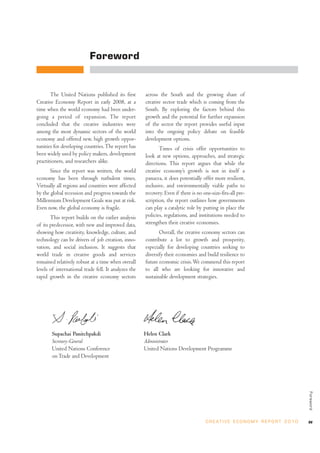
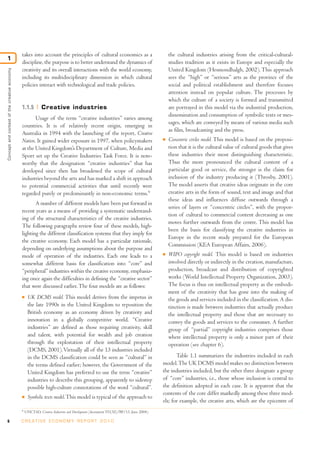
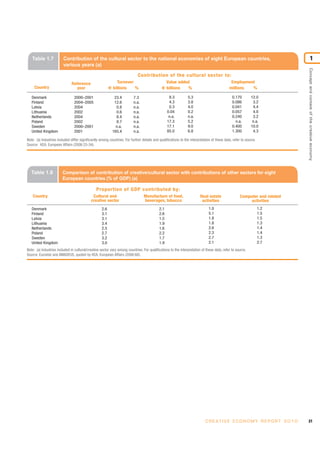
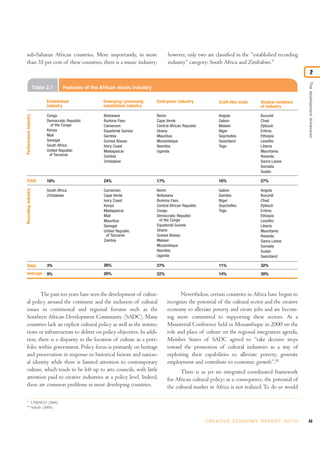
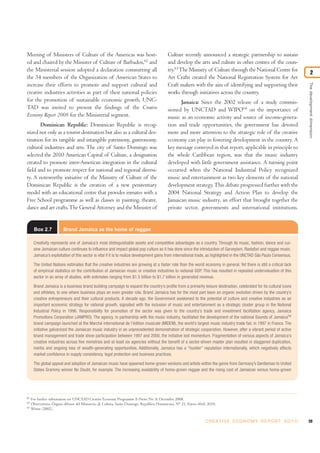
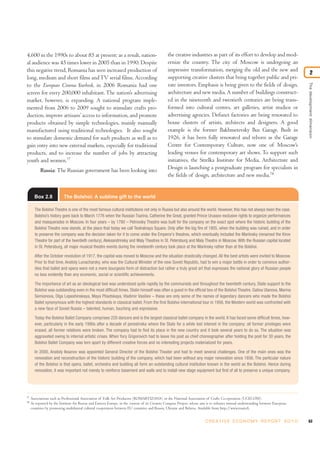
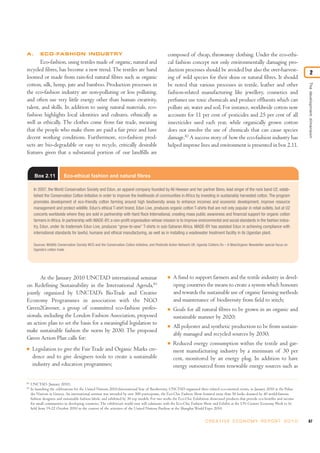
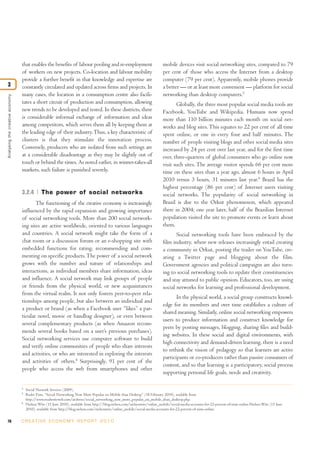
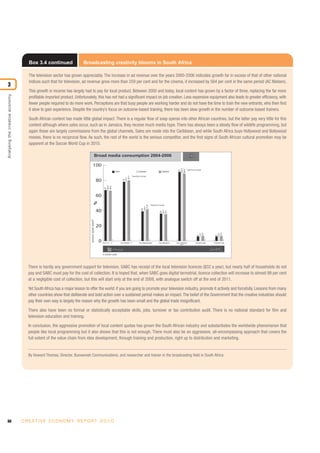
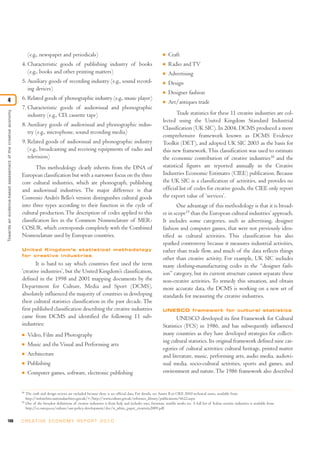
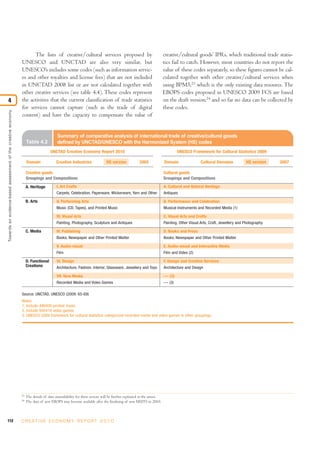
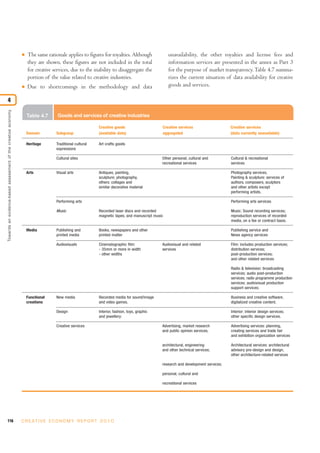
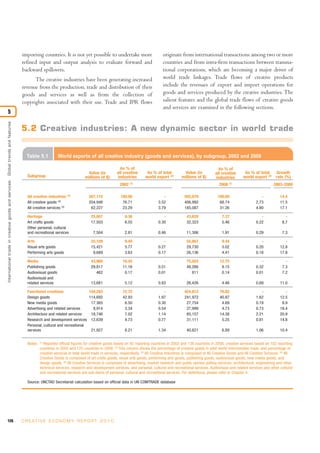
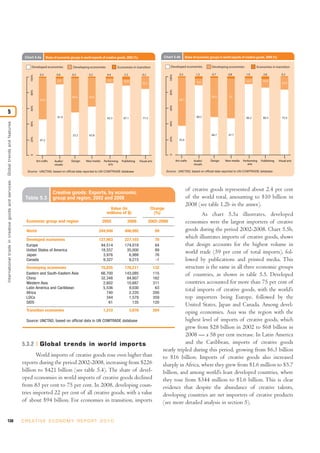
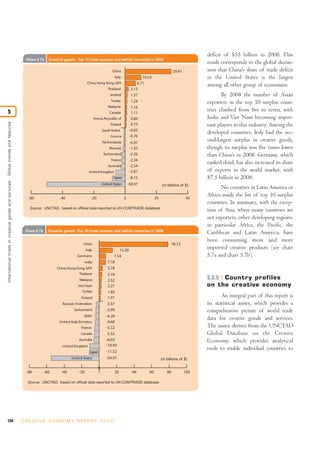
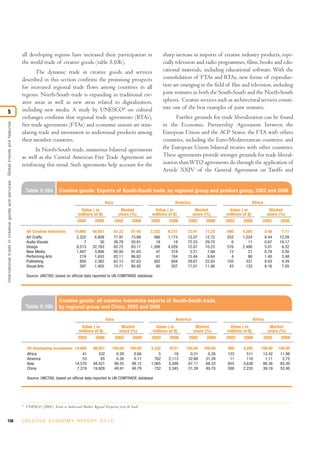
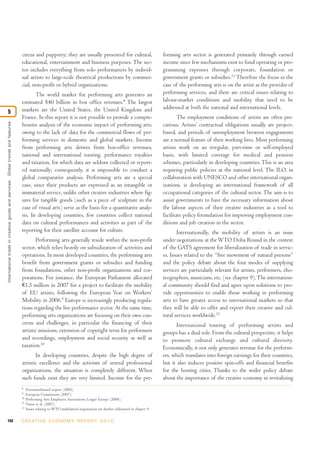
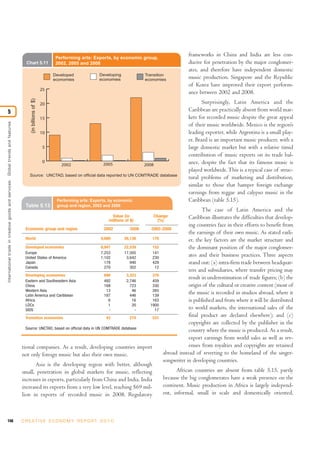
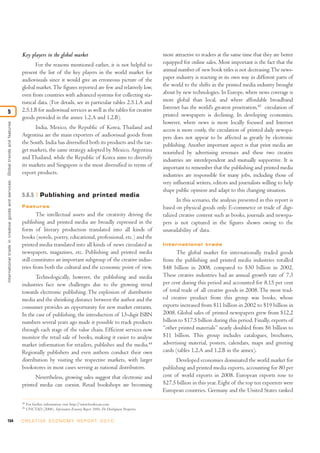
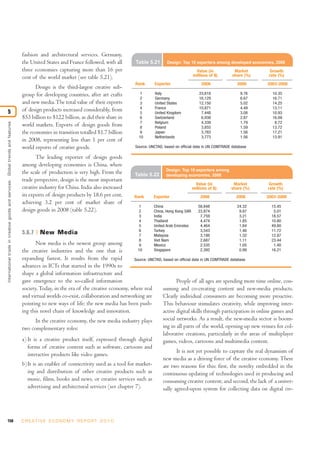
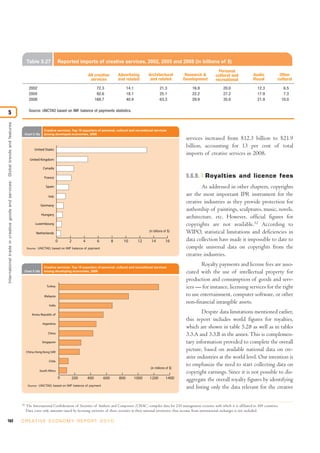
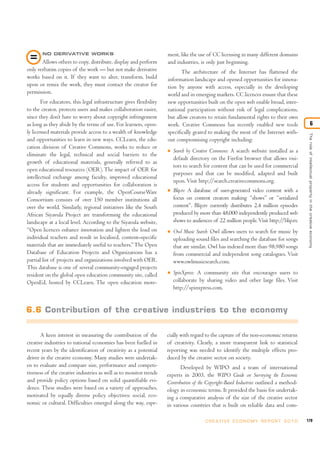
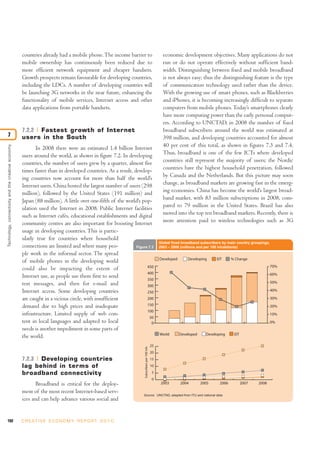
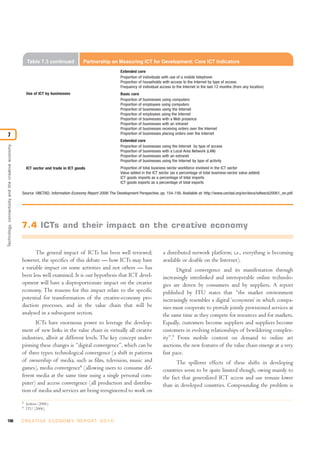
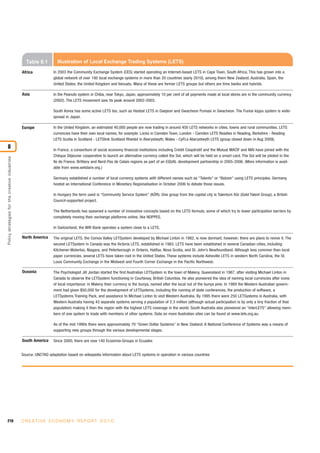
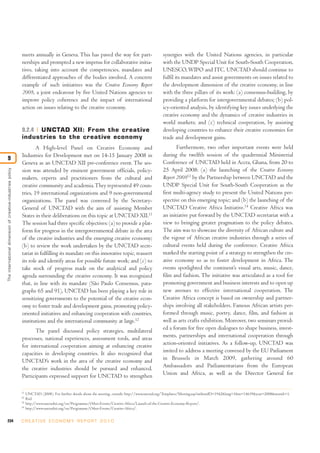
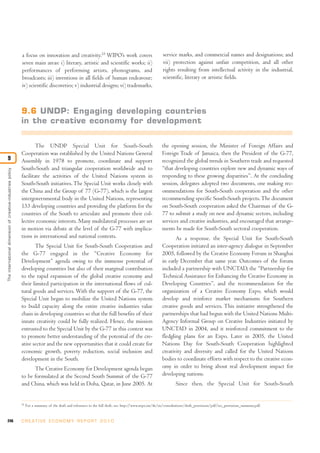
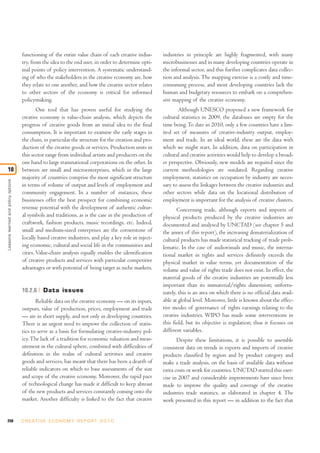
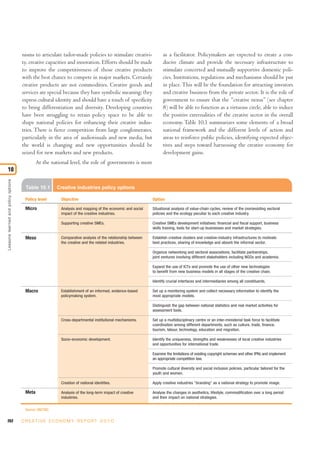
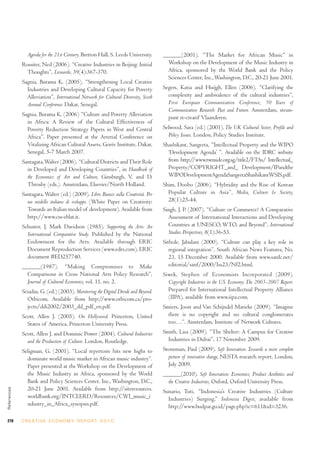
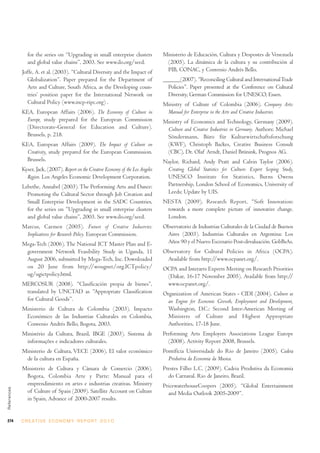
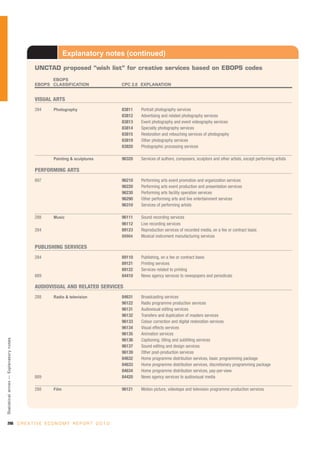
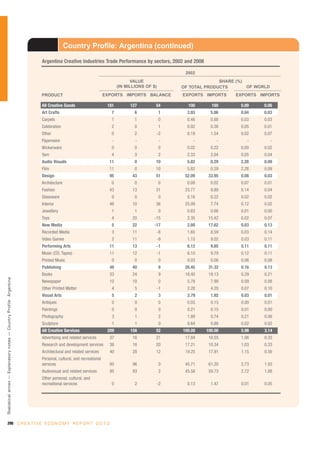
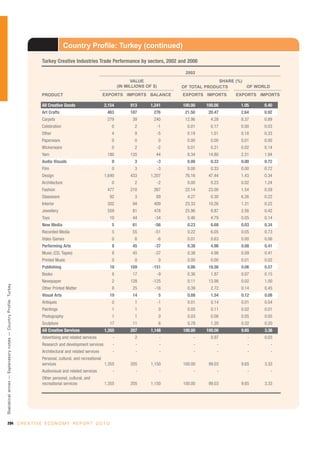
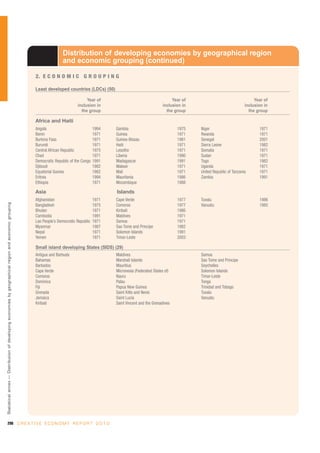
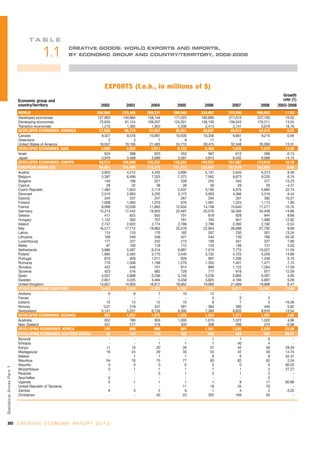
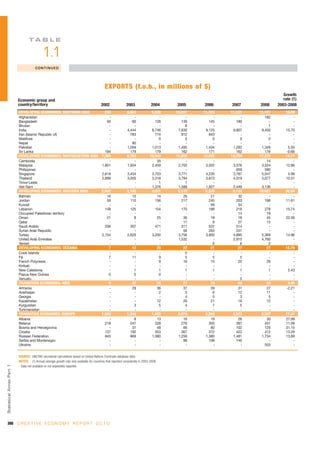
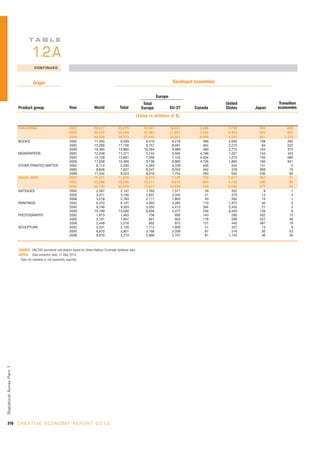
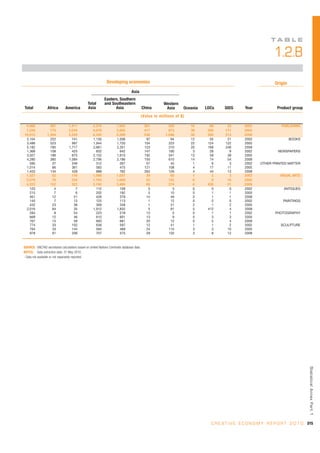
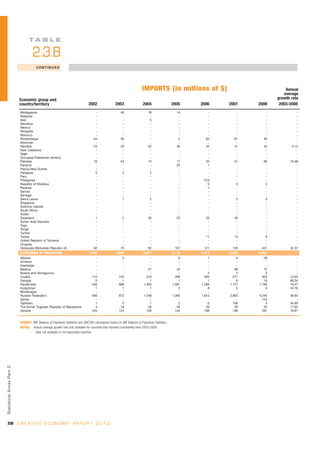
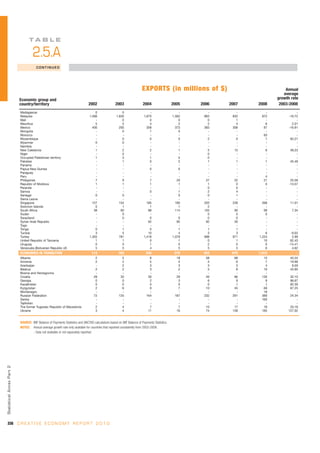
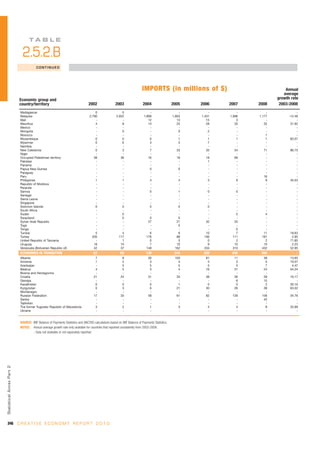
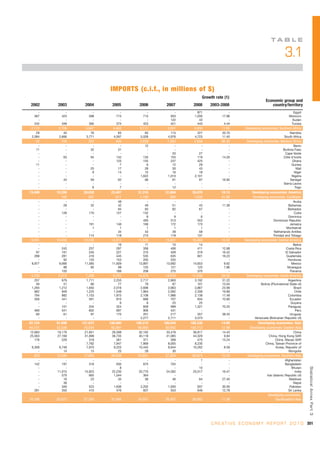
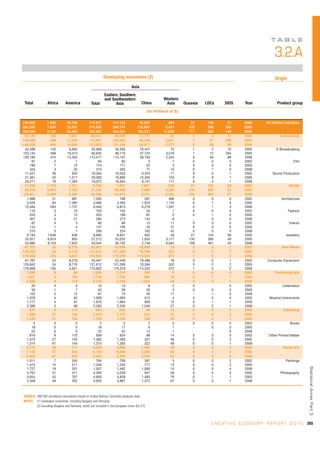
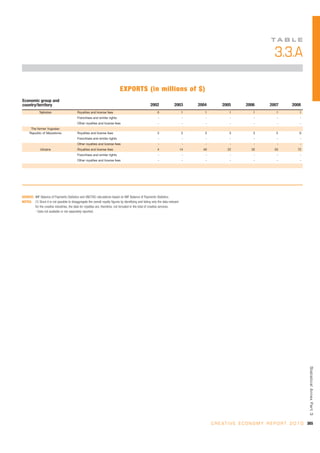
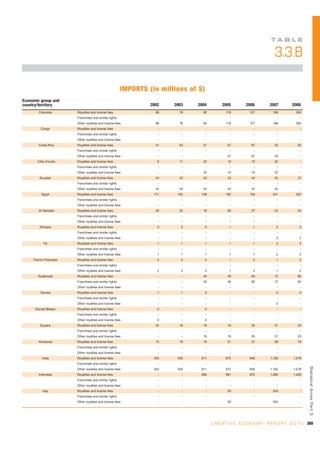
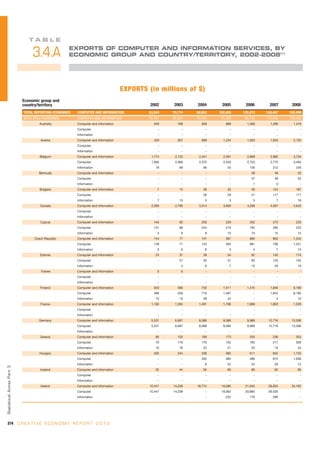
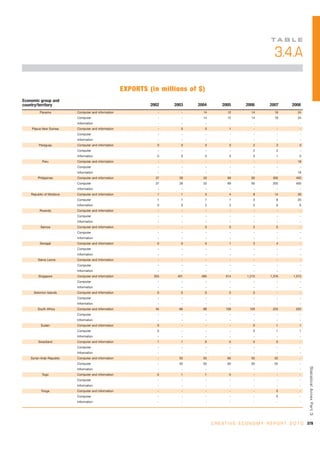
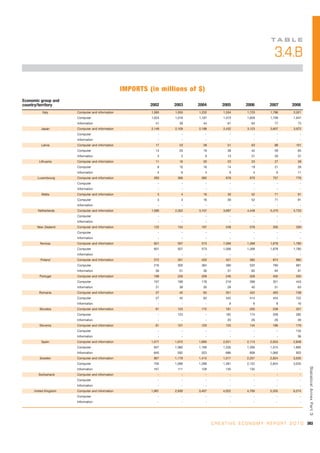
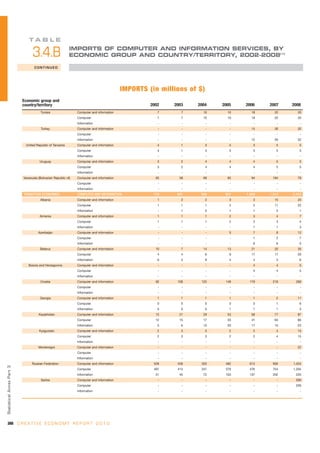
Some representative data are shown in tables 1.6 to
1.8. Table 1.6 shows the contribution of the cultural indus-
tries to GDP or GVA for five countries in various years.
Table 1.7 indicates the contribution of the cultural sectors
of eight European countries to the economy. It should be
noted that in four of the eight countries shown, the creative
industries contributed more than 5 per cent of GVA, and in
two countries, they contributed 10 per cent or more of
employment. Comparisons with other sectors of the
economies of developed countries are shown in table 1.8
and table 1.9.
Conceptandcontextofthecreativeeconomy
1
54
Ministry of Culture of Spain (2009).
55
Giorgio Napolitano, 31 December 2007, quoted in Santagata (2009).
56
Santagata (2009).
57
On the basis of Eurostat and AMADEUS databank, as reported by KEA, European Affairs in 2006.
58
Monitor Creative Industries (2008).
59
Siwek (2009).
60
ARC Centre of Excellence for Creative Industries and Innovation (2010).
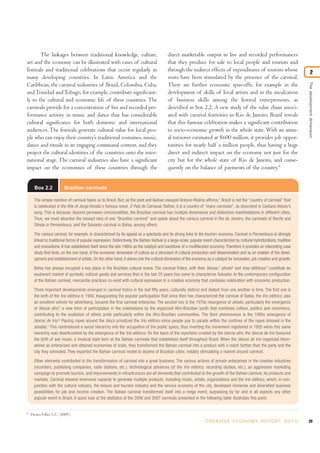
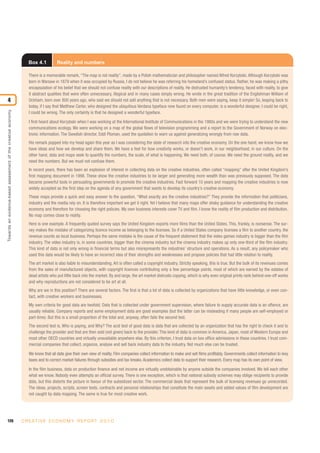
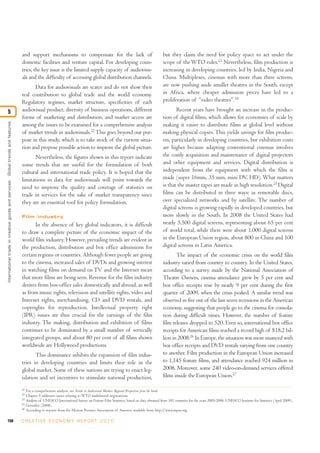
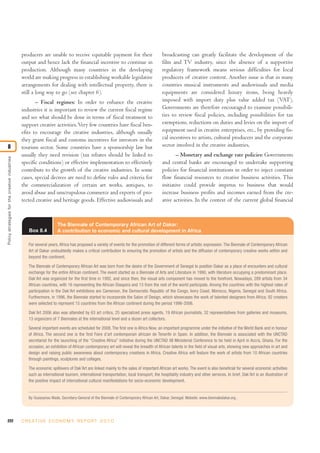
Table 1.6 Contribution of the cultural industries (a) to GDP or GVA for five countries, various years (b)
Notes: (a) Industries included: Advertising; architecture; video, film, photography; music, visual arts, performing arts; publishing, print media; broadcast media; art and antiques
trade; design, including fashion design.
(b) For qualifications to the interpretation of these data, refer to source.
Source: Gordon and Beilby-Orrin, International Measurement of the Economic and Social Importance of Culture, OECD (2007:54).
Country
Australia
Canada
France
United Kingdom
United States
Reference year
$A
$Can
€
£
$US
Currency Aggregate measured
GDP
GDP
GVA
GVA
GVA
1998–99
2002
2003
2003
2002
Value (millions)
Contribution of cultural industries
17,053
37,465
39,899
42,180
341,139
% of GDP/GVA
3.1
3.5
2.8
5.8
3.3](https://image.slidesharecdn.com/unctad-creativeeconomy-afeasibledevelopmentoption-110517093009-phpapp01-140509045035-phpapp02/85/Unctad-creativeeconomy-afeasibledevelopmentoption-110517093009-phpapp01-60-320.jpg)


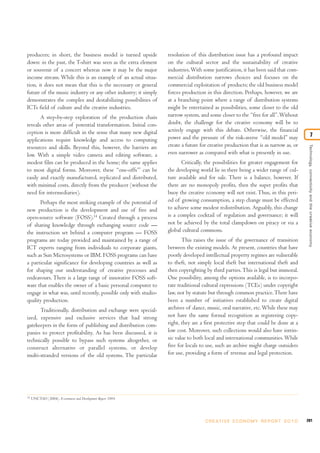
![173C R E AT I V E E C O N O M Y R E P O R T 2 0 1 0
Theroleofintellectualpropertyinthecreativeeconomy
6
4
According to the Bern Convention, literary and artistic works are protected without any formalities by the contracting parties. If a creator is a national or resident of a country party
to that Convention (or a member of the WTO), or has published the work initially in one of the member countries, his/her copyright will be automatically protected in all the
other countries that are party to the Convention. Other major legal instruments include the International Convention for the Protection of Performers, Producers of Phonograms
and Broadcasting Organizations (at the time of drafting this report, there were 86 parties to the Rome Convention, as it is commonly known), the Agreement on Trade-Related
Aspects of Intellectual Property Rights (commonly known as the TRIPS Agreement; at drafting time, there were 151 WTO members, all of which are parties to the TRIPS
Agreement), and the WIPO Copyright Treaty (WCT) of 1996 and the WIPO Performances and Phonograms Treaty (WPPT) of 1996 (at drafting time, there were 64 contracting
parties to the WCT and 62 to the WPPT).
5
For a thorough analysis of the economics of copyright, see Landes and Posner (1989:325, 325-333, 344-353).
6
If a creative product is produced under a “work [made] for hire” contract — which is common in the music and publishing industries — the contractor or employer is considered
the legal author. In this case, the creator of the work may or may not be publicly credited for the work (attribution) and this has no effect on the ownership status. For example,
news journals may attribute news articles as written by their staff but will retain the ownership and, from a copyright perspective, the authorship of the articles. In such cases, even
though the commercial component of the copyright is detached from the real creators, countries that are signatories of the Bern Convention recognize certain non-commercial moral
rights that are inalienable under work-for-hire contracts.
7
For example, in India, the term is 60 years after the creator’s death; in the European Union and the United States, 70 years; and in Mexico, 100 years. Copyright laws of a wide
range of countries can be consulted in the Collection of Laws for Electronic Access (CLEA) database of WIPO at http://www.wipo.int/clea/en/index.jsp.
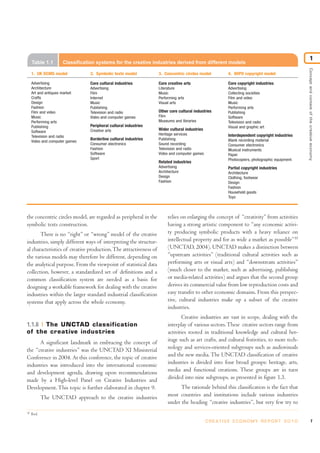
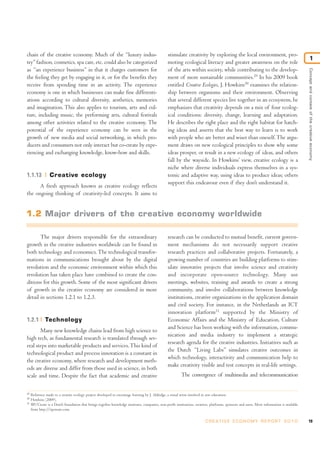
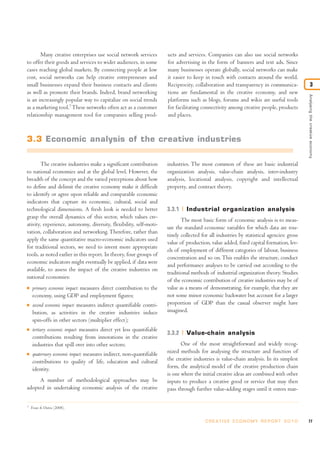
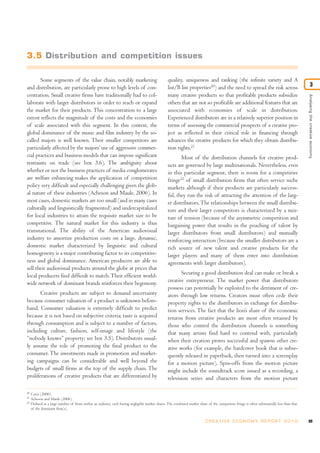
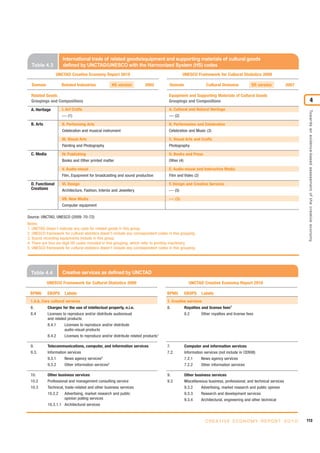
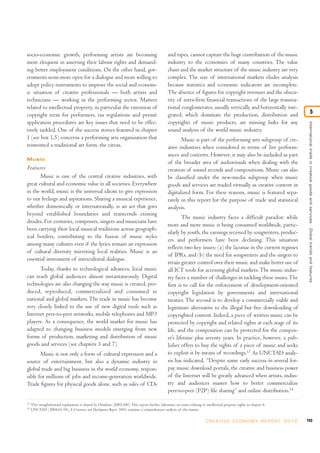
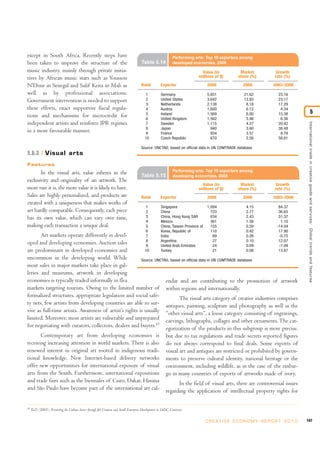
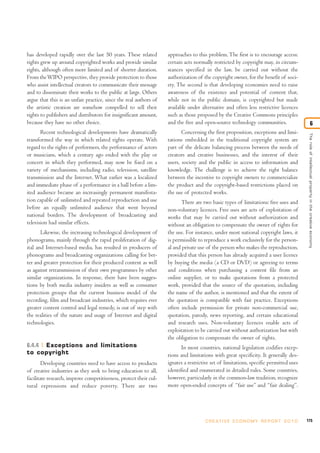
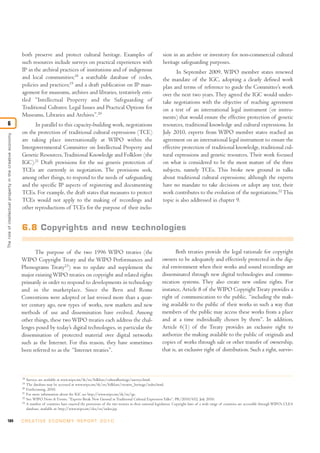
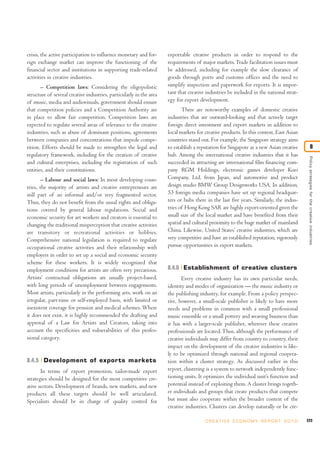
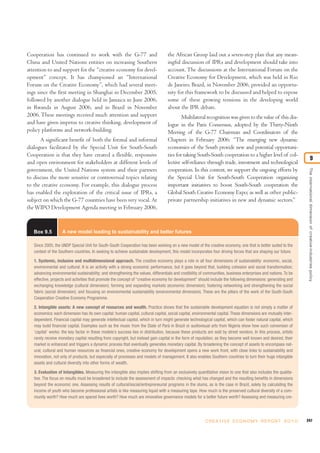
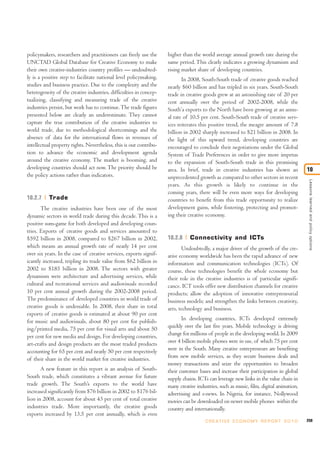
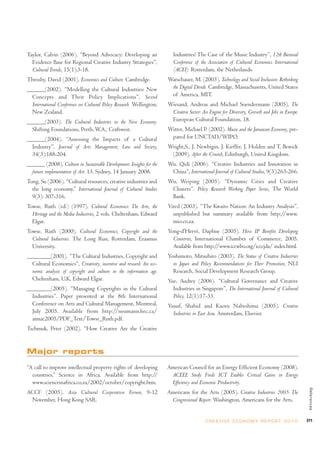
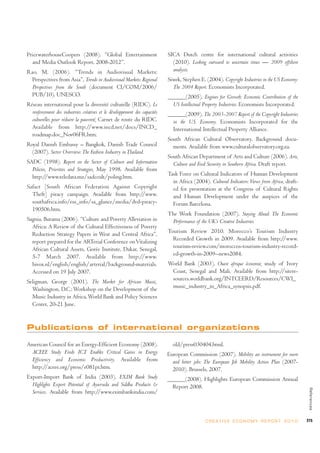
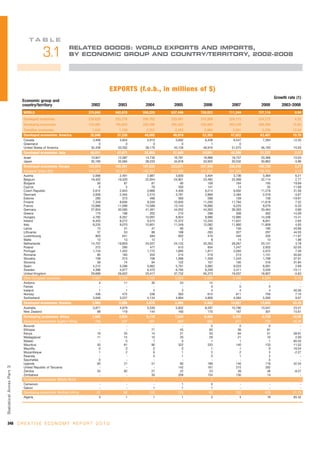
defined in national legislation.The basic concepts in nation-
al law are, however, largely consistent with the provisions of
international instruments. The most important of these is
the Bern Convention for the Protection of Literary and
ArtisticWorks; at the time of drafting this report, there were
163 contracting parties to the Convention.4
The economic necessity for copyright legislation aris-
es from the need to provide an incentive and a reward for the
commercial production and dissemination of creative works.
Copyright supports creativity by giving individuals — and
the creative industries in which they are involved — incen-
tives to invest time, efforts and money in creating, producing
and distributing works. In principle, copyright assures the
ownership of a tradable right that can be used to secure a
financial return on their investment.5
Certain legal philoso-
phies consider copyright law as originating from the ever-
increasing need of society to consume products of creative
industries and see copyright as the tool to bring the largest
number of quality products to market where consumers will
ultimately judge their merit. Others seek the legitimacy of
copyright in order to gain respect for works of the human
mind and rely on the moral principle that individuals should
be rewarded for their creative labour and contribution to cul-
tural diversity.
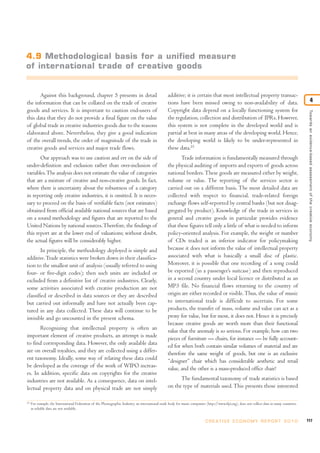
6.4.1 Exclusive rights
Copyright consists of a system of rights given to
creators in their literary and artistic works at the moment of
creation provided they are not under contract that specifies
otherwise.6
These rights are tradable and may be sold to other
individuals and firms. Creators and ultimately their heirs, or
rights owners, hold the exclusive rights to use or license
others to use the work on agreed terms. The holder of the
copyright of a work can prohibit or authorize, for example:
I its reproductions in various forms, such as printed publi-
cation or a CD;
I its public performance, as in a play or musical work;
I its broadcasting, including by radio, television or satellite;
I its translation into other languages or its adaptation, such
as the adaptation of a novel into a screenplay.
These economic rights have a time limit, according to
the relevant WIPO treaties, of 50 years after the creator’s
death. National law may establish longer time limits.7
This
limit enables both creators and their heirs to benefit finan-
cially for a reasonable period. Once the copyright term has
expired, works fall into the public domain.
Copyright provides exclusivity only over the form of
expression of an idea but not to the idea itself. The creativi-
ty protected by copyright law is creativity in the choice and
arrangement of words, musical notes, colours, shapes and so
on. For example, it is the way in which an artisan has cre-
atively executed the idea of creating a tea set or the way a
photographer has taken a picture of a specific subject that is
copyrightable, not the idea itself. Copyright law protects the
owner of rights in artistic works against those who “copy”,
i.e., those who take and use the form in which the original
work was expressed by the author. Ideas, processes, proce-
dures, methods of operation and facts by themselves may be
freely taken and applied or used, subject, of course, to other
types of limitations.
6.4.2 Moral rights
Copyright protection also includes moral rights, which
involve the right to claim authorship of a work and the right
to oppose changes to it that could harm the creator’s reputa-
tion. Moral rights correspond to the interests of creators in
being identified as the originators of a particular work, and
the ability to control the conditions that surround its dis-](https://image.slidesharecdn.com/unctad-creativeeconomy-afeasibledevelopmentoption-110517093009-phpapp01-140509045035-phpapp02/85/Unctad-creativeeconomy-afeasibledevelopmentoption-110517093009-phpapp01-203-320.jpg)
![174 C R E AT I V E E C O N O M Y R E P O R T 2 0 1 0
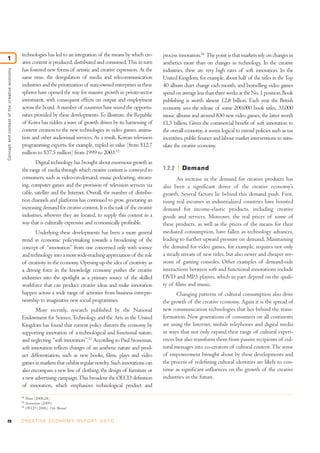
semination, be it from the very decision to go public to the
safekeeping of authenticity, thus addressing both economic
and cultural dimensions. Moral rights are inalienable from
the authors and cannot be transferred to third parties under
commercial contracts.8
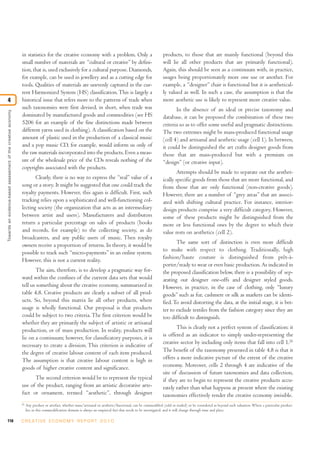
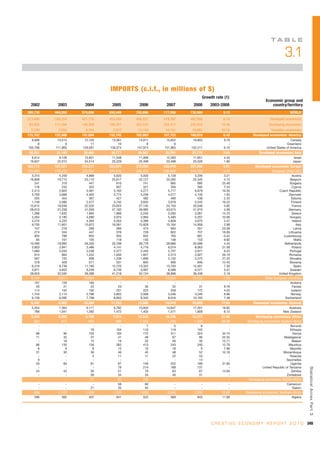
6.4.3 Related rights
Many creative works protected by copyright require
mass distribution, communication and financial investment
for their dissemination (for example, publications, sound
recordings and films); hence, creators often sell or license the
copyrights to their works to individuals or companies best
able to market the works in return for payment. These pay-
ments are often made dependent on the actual use of the
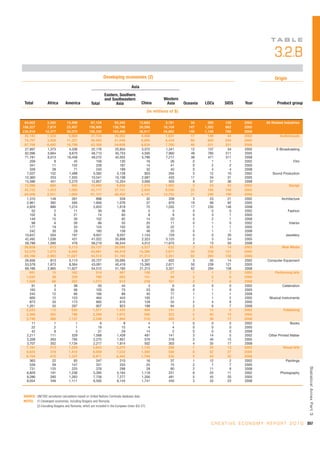
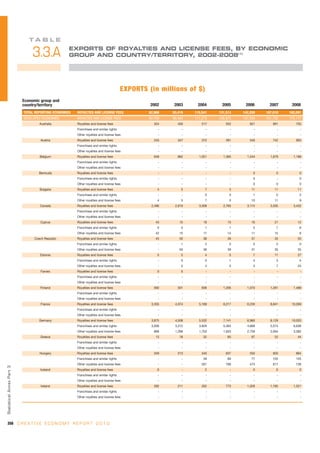
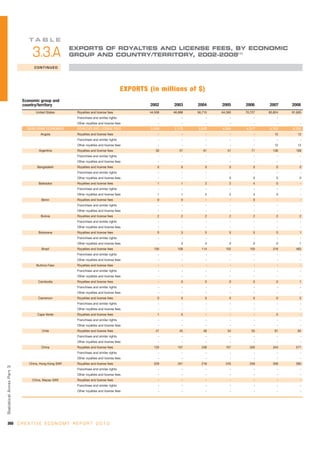
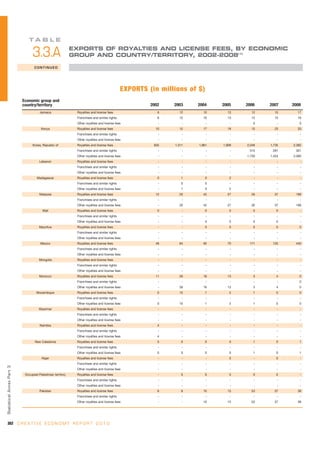
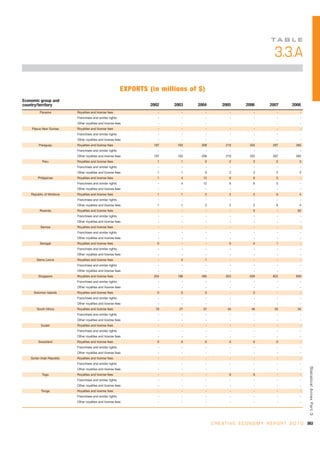
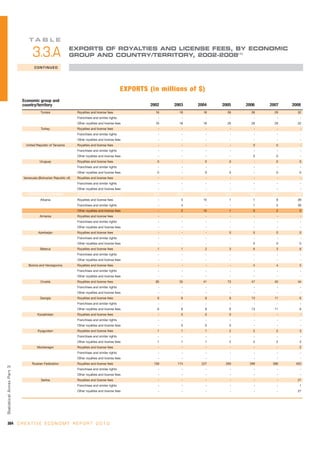
work and are then referred to as “royalties”. In chapter 5 and
the annex of this report, statistics related to trade of royal-
ties are presented as an indication of the magnitude of the
trade flows. The market of royalties has been expanding
quickly, from $83 billion in 2002 to $182 billion in 2008.
However, this data covers all royalties, of which creative
industries are just a part. As the data is not disaggregated, it
is not included in the world trade of creative industries.This
is a crucial area that requires more work in order to measure
and evaluate the full contribution of the creative industries
to the world economy. WIPO is examining possibilities for
improving its data collection system, so hopefully in the near
future we will be able to discern a clearer picture of the earn-
ings from royalties originating from the creative industries.
In principle, works of the mind are created in order to
be disseminated to a wider audience. This generally cannot
be done by an author alone, since it requires financial invest-
ment by intermediaries that have the necessary production
and reproduction infrastructure, access to retailers and dis-
tribution networks and professional competencies — such as
management, marketing and public relations — that the
author may not possess. A play needs to be represented on
stage; a song needs to be performed by artists, reproduced in
the form of CDs or broadcast by means of radio facilities.
All persons who make use of literary, artistic or scientific
works in order to make them publicly accessible to others
require their own protection against the unauthorized use of
their contributions in the process of communicating the
work to the public. The field of rights related to copyright
Theroleofintellectualpropertyinthecreativeeconomy
6
8
While the Bern Convention is “moral rights” friendly, the United States does not recognize it.
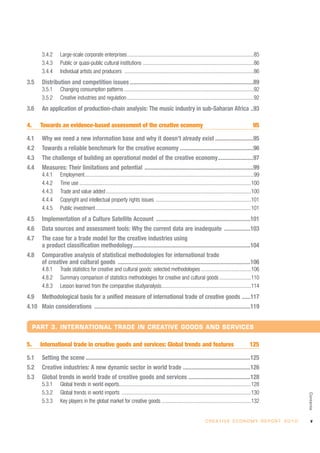
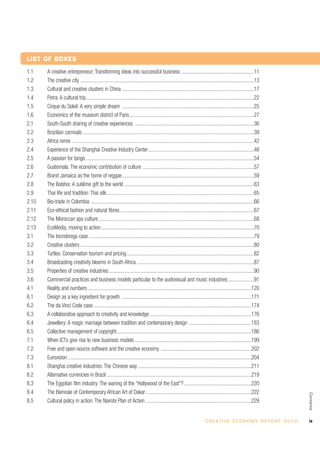
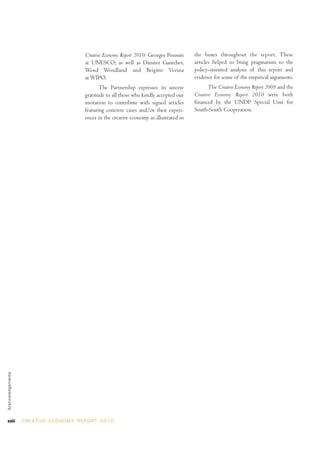
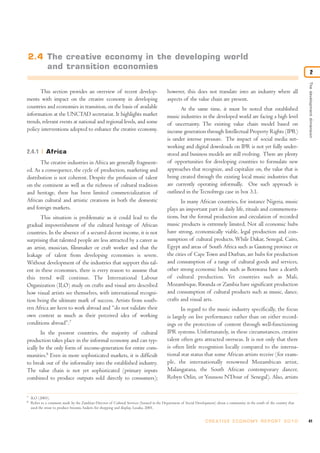
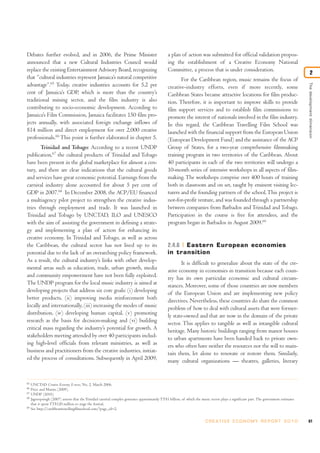
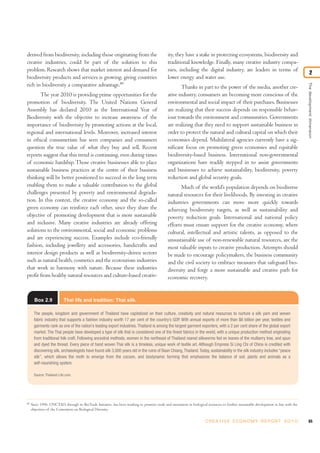
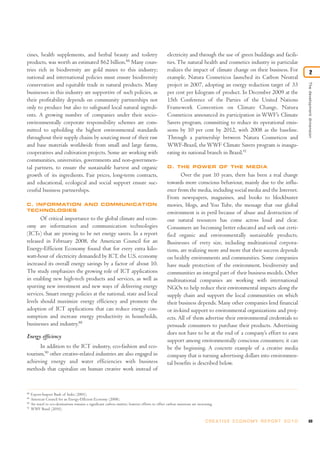
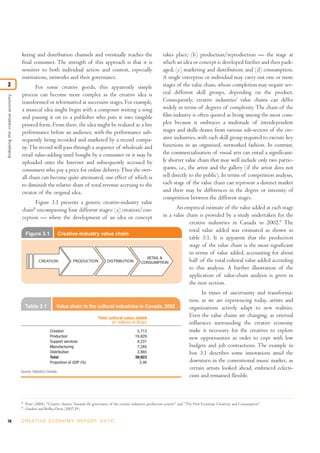
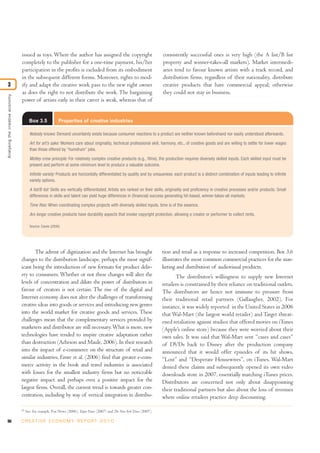
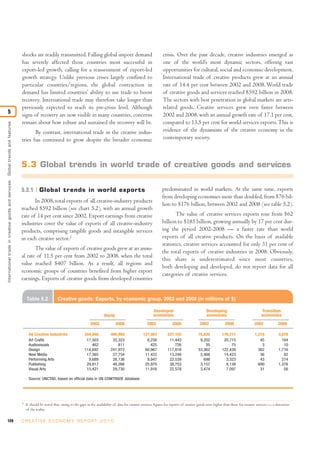
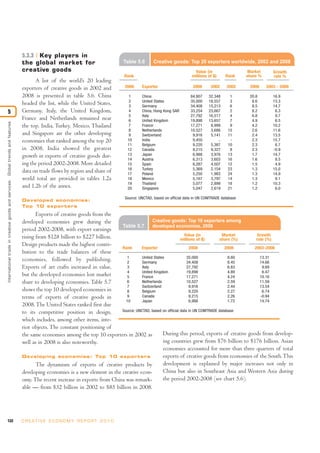
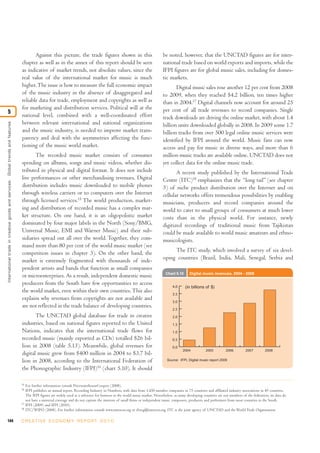
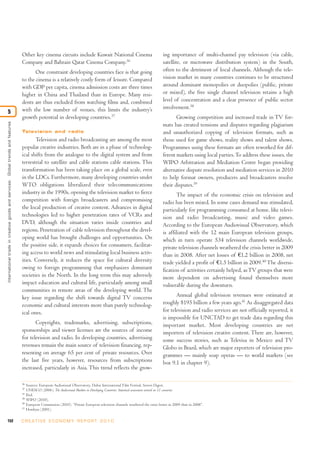
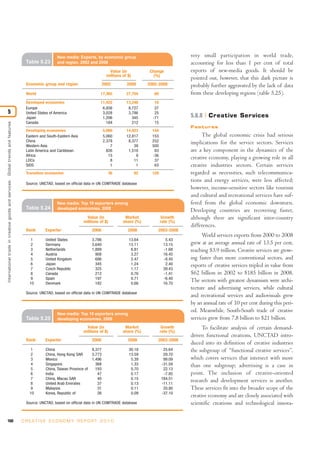
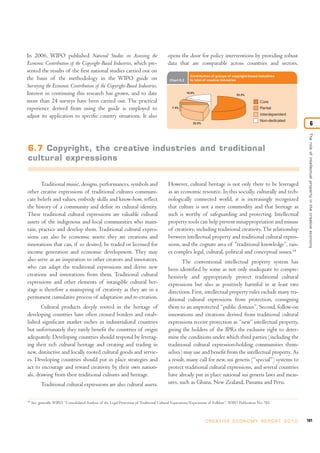
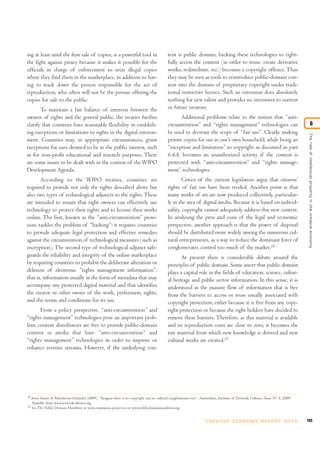
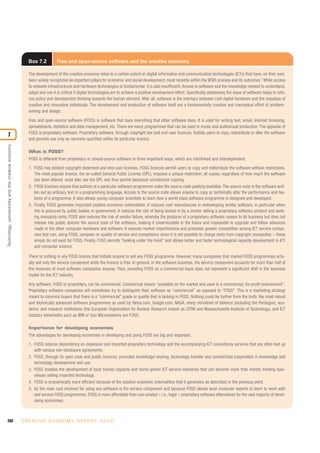
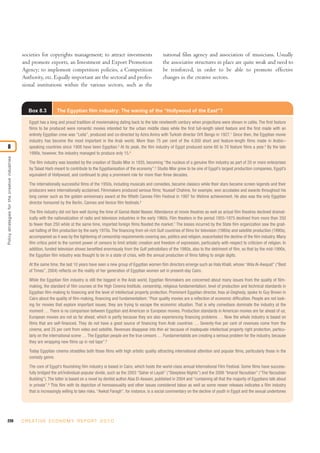
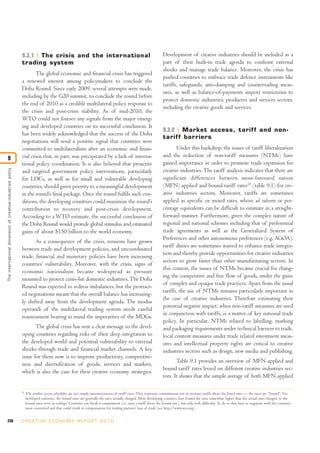
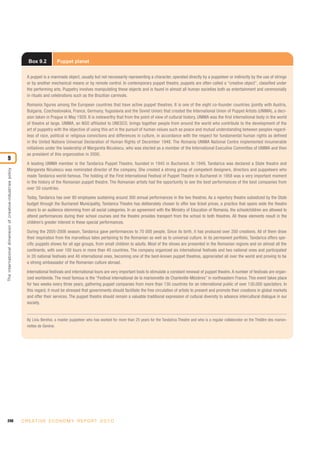
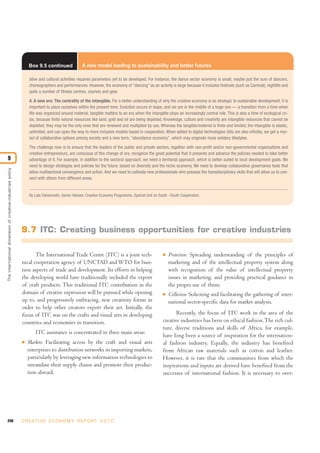
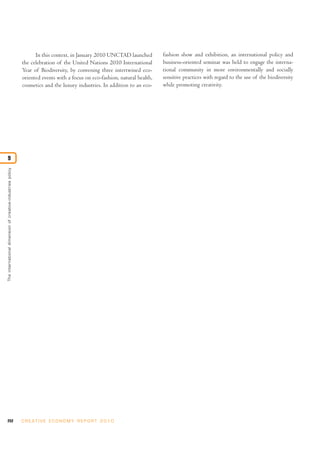
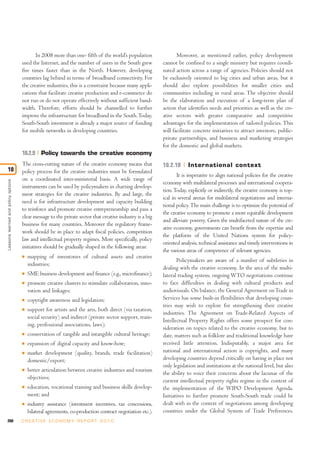
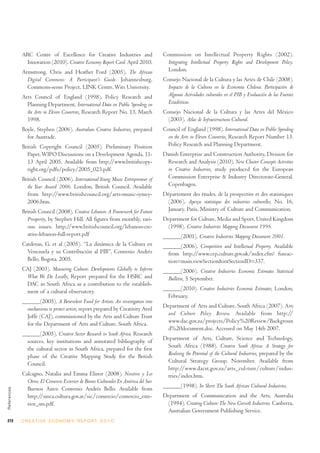
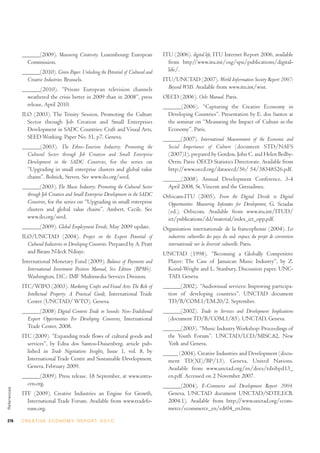
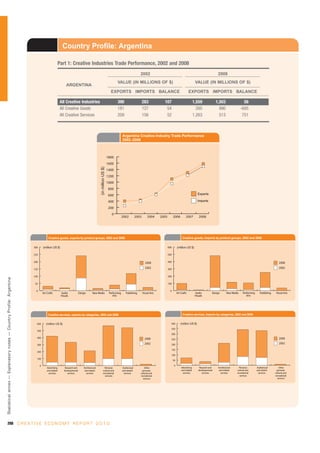
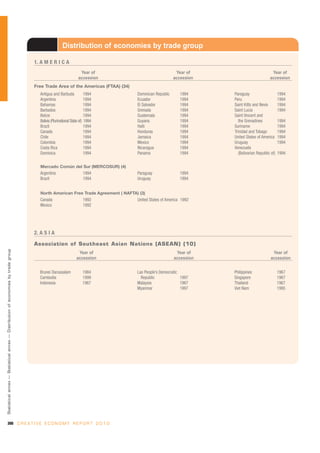
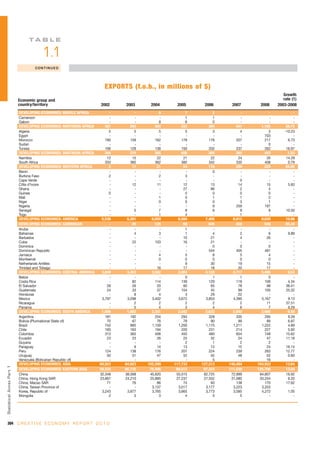
Box 6.2 The Da Vinci Code case
A copyright infringement case was brought against the publishers of The Da Vinci Code by Michael Baigent and Richard Leigh, two of the authors of a
1982 non-fiction work, The Holy Blood and The Holy Grail. According to an article in the June 2006 issue of WIPO Magazine, “At the centre of the dis-
pute was a ‘hypothesis’ presented in The Holy Blood and The Holy Grail” according to which “references to the Grail in early manuscripts were disguised
references not to the chalice, but rather to holy blood or Sang real, i.e. to the bloodline of Jesus Christ, and to the belief that this bloodline … had
continued and merged with the French Merovingian dynasty”.
The plaintiffs “claimed copyright in the literary work and alleged that Dan Brown”, author of The Da Vinci Code, “had copied the way in which they had
made the sequence of connections of the facts of the merging of the bloodlines. Since there was little copying of the actual text of The Holy Blood and
The Holy Grail, the claim was that there had been non-literal copying of a substantial part of their literary work”.
The Holy Blood and The Holy Grail “is comprised largely of historical facts which are unprotectable ideas. Baigent and Leigh based their case, therefore,
on the claim that Brown had taken a substantial part of the ‘manner’ in which they had expressed those ideas, as opposed to taking the ideas themselves”.
“The court held that, while the evidence was clear that Dan Brown and his primary researcher (his wife) had drawn on The Holy Blood and The Holy Grail
to a greater extent than Brown had acknowledged, this did not mean that he had infringed copyright in the book. Rather, they had used The Holy Blood
and The Holy Grail, and other books, to provide general background material for the writing of The Da Vinci Code”.
“The significance of the case for copyright law relates to the fact that the lawyers acting for Baigent and Leigh attempted to make – and lost – an argu-
ment that there can be non-literal copying of a work of literature. The non-literal argument has previously been successfully used, usually in the case of
computer programs or recipes or knitting patterns.”
Source: Dr. Uma Suthersanen, “Copyright in the Courts: The Da Vinci Code”, WIPO Magazine, June 2006, available at:
http://www.wipo.int/wipo_magazine/en/2006/03/article_0004.html. See Michael Baigent and Richard Leigh v. The Random House Group Limited Neutral Citation
Number: [2006] EWHC 719 (Ch), available at: http://www.binarylaw.co.uk/2006/04/smithy_code.htm.](https://image.slidesharecdn.com/unctad-creativeeconomy-afeasibledevelopmentoption-110517093009-phpapp01-140509045035-phpapp02/85/Unctad-creativeeconomy-afeasibledevelopmentoption-110517093009-phpapp01-204-320.jpg)
![and made commercially available by the likes of IBM or
Novell, is available under the GNU General Public
License.10
National copyright legislation is obliged to
enforce and respect the licence conditions as declared in
these and other open public licenses, and recent cases have
upheld the rights of the copyright owners distributing works
under alternative free and/or open licences.11
6.4.5 Enforcement of copyright
The acquisition of copyrights is of little economic
value if these rights cannot be enforced effectively.The cred-
ibility of the system depends to a considerable extent on the
enforceability of the rights it confers. Well-functioning
enforcement mechanisms are the best means to limit the
number of violations of copyrights and to ensure that rights
holders and society as a whole can reap the benefits from the
intellectual property system. However, this is another area in
which more transparency is required. One of the main com-
plaints from artists and creators in developing countries is
the lack of data related to the real rights transactions. A
number of questions have no simple answers: What are the
values of rights transferred inside corporations from the
consuming to the producing country?Who benefits from it?
In most cases, the rights holders are not the authors.Thus it
is imperative to ensure that creators really benefit from the
earnings of their work. If the real problems could be solved,
this would encourage better enforcement in developing
countries. Therefore, the key issue is not only enforcement
but also the ambiguities of the current IPR regime, which
deserve to be carefully addressed by governments.
In considering the protection and enforcement of
copyright and related rights, piracy appears as one of the
central issues. All kinds of works are at risk of unauthorized
use. Music, books, videos, DVDs and even craft design are
copied illegally.WIPO argues that in developing economies,
as a result of the flooding of markets with cheap “copyright-
free” foreign products, domestic creators and producers lose
their competitiveness, which in turn endangers cultural diver-
sity and national identity. This is a huge challenge in many
countries, and the argument is that countries where piracy is
rampant may forego opportunities for growth and develop-
ment on several levels, both tangible and intangible, since it
destabilizes the local creative industries and undermines the
efforts of creative entrepreneurs and businesses. Inadequate
enforcement of copyright limits incentives to develop
creative products, especially for small and medium-sized
enterprises. Other critiques point to the need to review the
current IPR legislation to address the root of the issue, not
just the consequences.
Copyrighted works, like other intangible goods, suffer
from what economists call the public goods problem: they
are non-rivalries and non-excludable goods. This means that
their use by one person does not reduce their usefulness for
other persons; thus an unlimited number of people may con-
sume the work without using it up. In addition, while the
cost of creating copyright goods is often high, the cost of
reproducing them is low.This leads to an economic disincen-
tive to commercialize new works.
The limited monopoly granted by copyright laws pro-
vides copyright owners with the legal entitlement to exclude
others from enjoying the copyrighted work. In the case of
traditional copyright where the terms and conditions are not
specified beyond the designation “Copyright [date]”, “©”
or eventually “All rights reserved”, anyone else who wants to
use the work needs to seek permission from the owner. Yet
while these rights may be exclusive, they are not absolute and
some national IPR legislation provides limitations and
exceptions to help to keep the copyright system balanced to
avoid the costs of an overly extensive set of rights. These
so-called “fair-use” rights indicate a permissible degree of
copying, in part or in full, within the family or household
circle, for creating backups in the production of comic and
satirical material, and for the purpose of study and academ-
ic research. Creative Commons licences refers to a set of
liberal copyright licences, often referred to as “copyleft”,
that instruct the users of the work as to which conditions
(none, some, any/all) govern copying, attribution and the
177C R E AT I V E E C O N O M Y R E P O R T 2 0 1 0
Theroleofintellectualpropertyinthecreativeeconomy
6
10
http://www.gnu.org/copyleft/gpl.html.
11
See http://gpl-violations.org/about.html.
6.5 The economics of copyright](https://image.slidesharecdn.com/unctad-creativeeconomy-afeasibledevelopmentoption-110517093009-phpapp01-140509045035-phpapp02/85/Unctad-creativeeconomy-afeasibledevelopmentoption-110517093009-phpapp01-207-320.jpg)
![186 C R E AT I V E E C O N O M Y R E P O R T 2 0 1 0
Theroleofintellectualpropertyinthecreativeeconomy
6
C R E AT I V E E C O N O M Y R E P O R T 2 0 1 0
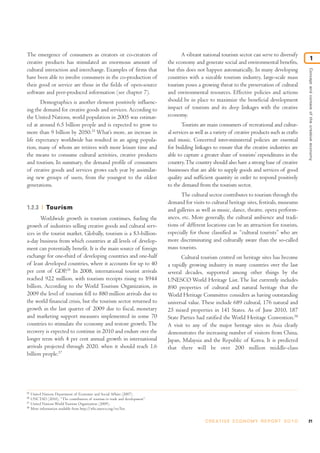
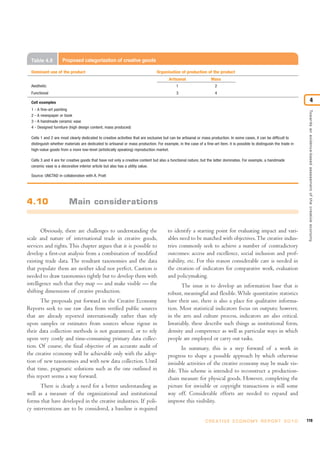
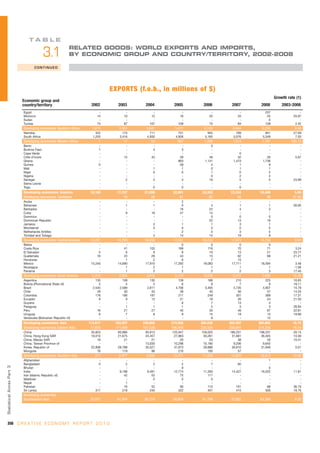
The analysis in this chapter underscores the idea that
an efficient and fair international intellectual property sys-
tem is in the interest of creators, creative industries and con-
sumers in all countries, and the level of its implementation
is often the subject of discussions in free trade agreements.
IPRs are territorial, which means that they are protected only
in the country or region where protection has been applied
for and obtained. Protecting intellectual property in export
markets is crucial if a creator is to enjoy the same benefits of
protection abroad as are enjoyed in the domestic market.
From the WIPO perspective, adherence to interna-
tional instruments allows developing countries to have equal
access to the markets of other member nations, and to
ensure that their local creators’ works are protected abroad.
It allows the creation of a domestic creative-industry infra-
structure that competes with foreign products.This helps to
establish credibility in the global community.
Intellectual property provides incentives to creators
and entrepreneurs in the form of a tradable economic asset
— a copyright — that is instrumental for investing in the
development, production and distribution of goods and
services, in a market economy, that are largely based on
human creativity. This in turn helps increase access to, and
enhances the enjoyment of, culture, knowledge and enter-
tainment all over the world. Ideally, under this system of
rights, rights owners are assured that their works can be dis-
seminated without fear of unauthorized use of their creative
and intellectual products. In practice, viable enforcement is
often a more critical issue than legal acknowledgement.
Increasing awareness of the contribution and potential of
the creative sector for development is a major task.
Protecting copyright is a public-policy goal of countries
seeking sustained growth in the creative economy. The rich,
intangible cultural heritage of many indigenous and
local communities and developing countries is a source of
creativity that should be tapped for the direct benefit of
these communities and countries.
According to WIPO, the inefficiency of intellectual
property legislation and enforcement systems imperils the
economic growth to which the creative industries contribute.
Enforcement is as important as the education and awareness.
Countries that wish to see their creative industries prosper
must take a strong stance for the promotion of the full
spectrum of copyrights and their licences, for the best way
to expand the creative economy is to implement a balanced
copyright framework that realizes their development poten-
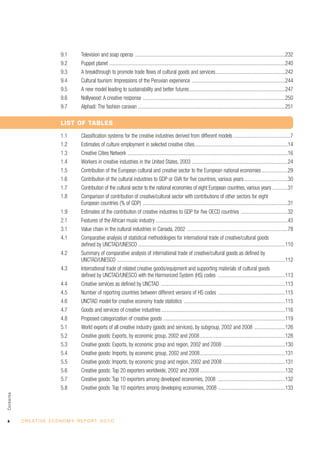
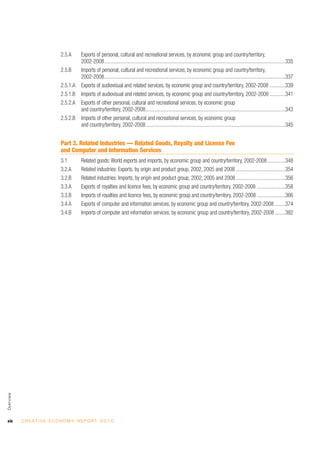
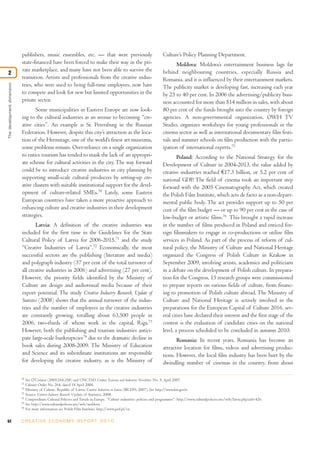
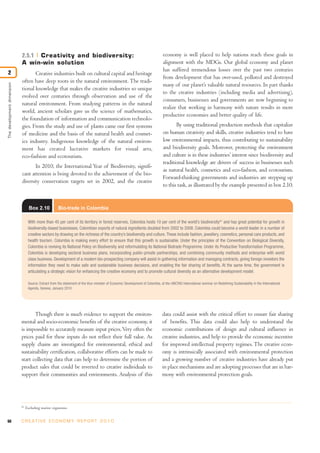
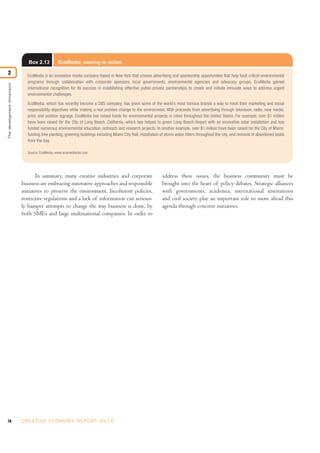
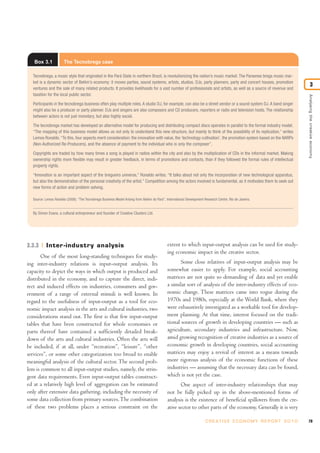
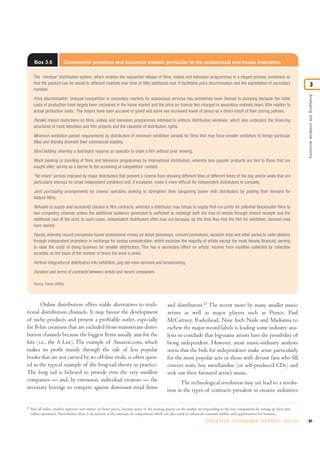
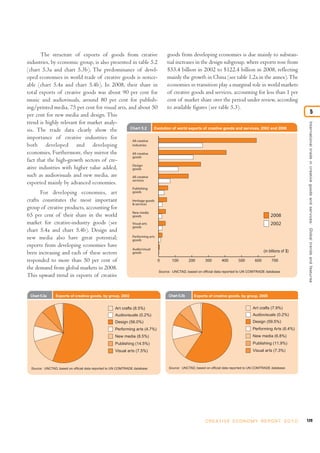
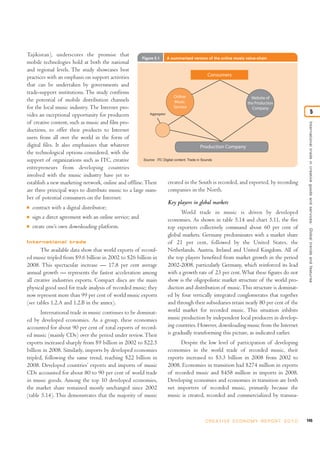
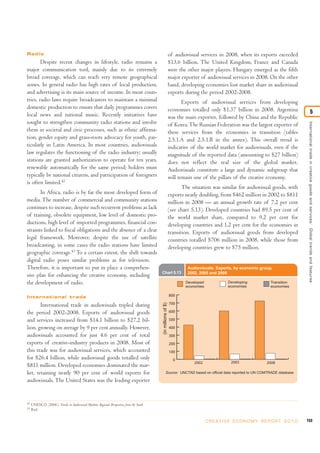
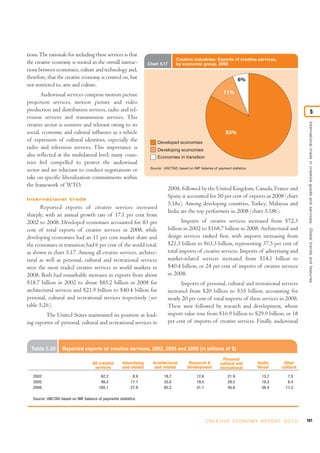
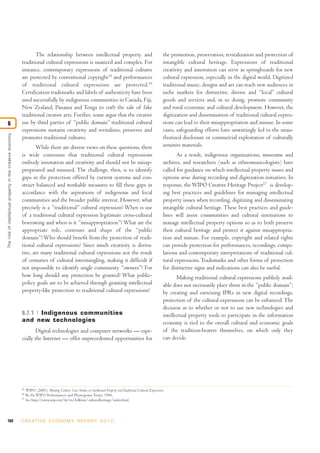
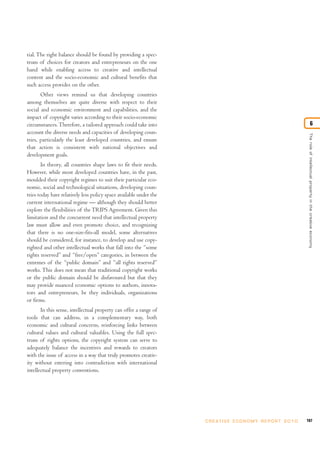
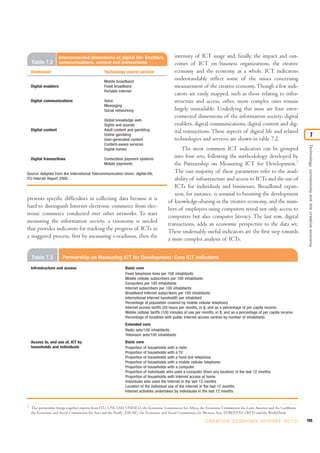
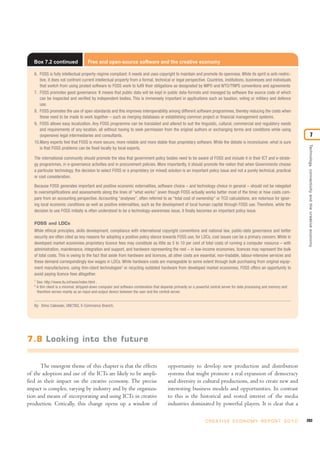
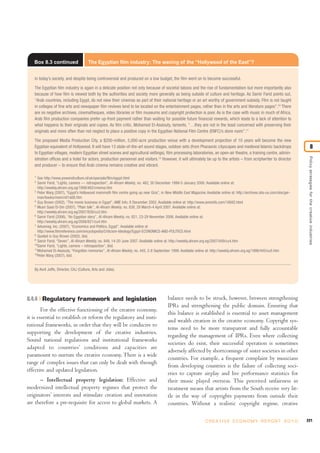
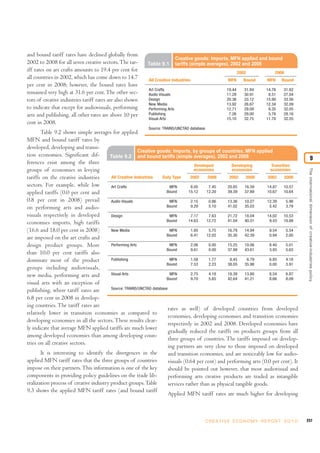
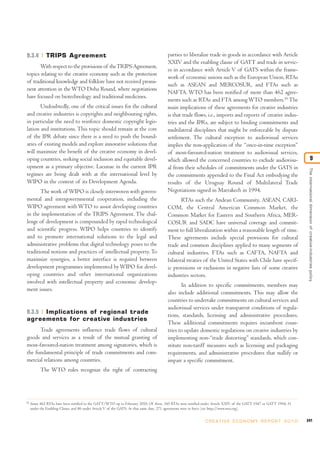
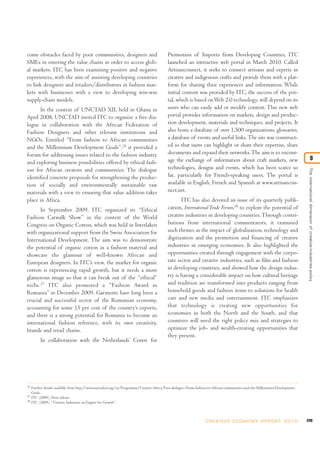
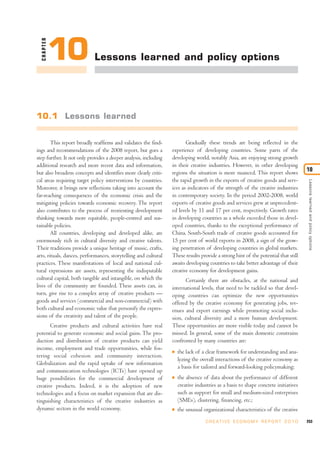
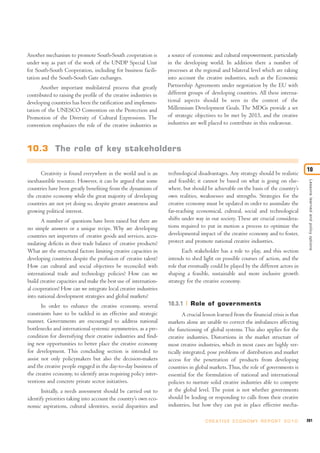
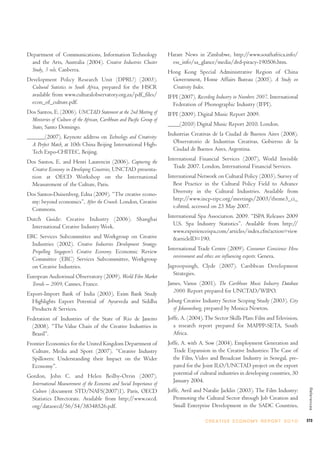
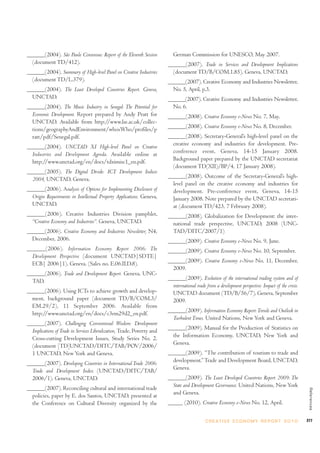
Box 6.5 Collective management of copyright
“How is it possible to ensure that an individual musician is remunerated each time his song is played on the radio?
Or a writer whenever his play is performed? How can the copyright and related rights of such creators be managed
efficiently so as to enable them to concentrate on their creative activity while receiving the economic reward due to
them?
“From Artist to Audience, a WIPO booklet produced in cooperation with the International Confederation of Societies
of Authors [and Composers] (CISAC) and the International Federation of Reproduction Rights Organisations (IFRRO),
aims to answer some of these questions by exploring one way in which the copyright and related rights system
works, namely through the collective management of rights.”
“From Artist to Audience (Publication No. 922) is available in PDF in English or French on the WIPO Free Publications
website: www.wipo.int/freepublications/en/”
Source: Excerpt from “From Artist to Audience — Collective Management of Copyright”, WIPO Magazine, January 2007. Available at:
http://www.wipo.int/wipo_magazine/en/2007/01/article_0004.html .
6.9 Possible policy options](https://image.slidesharecdn.com/unctad-creativeeconomy-afeasibledevelopmentoption-110517093009-phpapp01-140509045035-phpapp02/85/Unctad-creativeeconomy-afeasibledevelopmentoption-110517093009-phpapp01-216-320.jpg)


The document provides an overview of the creative economy report published by UNCTAD in 2010. It discusses key concepts related to creativity, cultural industries, and the creative economy. It also examines the major drivers of the creative economy worldwide such as technology, demand, and tourism. Additionally, it outlines the multiple economic, social, and cultural dimensions of the creative economy as well as its cross-cutting nature requiring inter-ministerial policies.


